

Abstract
Purpose
To examine tracking of physical activity (PA) over a ten-year period and investigate whether sex differences in PA trajectories are altered after aligning by maturity instead of age.
Methods
The Iowa Bone Development Study collected accelerometer data on a cohort of 140 girls and 128 boys at ages 5, 9, 11, 13, and 15 yr. Logistic regression determined the odds ratio of being in lowest PA tertile at 15 yr if in lowest tertile at age 5. Spearman correlation coefficients examined PA tracking from age 5 to 15. Using additional Iowa Bone Development participants at ages 9, 11, 13, and 15 (N=482, 457, 416, and 316, respectively), we examined the stability of PA for chronological and biological age in two-year intervals surrounding peak height velocity (PHV) age. Year from PHV was estimated using Mirwald prediction equation.
Results
Girls had significant ten-year correlations (r=0.27); boys did not. Girls, not boys, were more likely to be in the lowest tertile for PA at age 15 if in the lowest tertile at age 5 (OR=3.1 MVPA; 95% CI=1.4, 6.9; OR=2.8 Vigorous PA; 95% CI=1.2, 6.1). Girls’ two-year intervals for PA showed moderate associations (r=0.31–0.56) when aligned chronologically, but were moderate to high (r=0.41–0.63) when aligned biologically. Boys’ associations were low to moderate (r=0.26–0.56) chronologically. When aligned biologically, the associations were low for the −1 to 1 yr interval (1 yr prior to 1 yr post-PHV), but moderate to high for the −2 to 0 yr and 0 to 2 yr intervals (r=0.50–0.61).
Conclusion
Physical activity tracking from childhood to adolescence is stronger in girls than boys. Intervention programs targeting boys should focus on time surrounding puberty in boys where activity patterns change.
Keywords: accelerometer, children, adolescence, longitudinal, puberty
INTRODUCTION
In response to growing evidence of the health benefits of physical activity (PA) and the health risks posed by inactivity, experts recommend that adolescents accumulate at least 60 minutes of moderate to vigorous physical activity (MVPA) each day (3). However, recent CDC reports indicate that only 35.8% of adolescents meet the recommended PA guideline (3). The low compliance with this federal PA guideline calls for a better understanding of the factors determining PA participation in youth (30).
Examining the tracking of PA behaviors is important for understanding potential determinants and the continuance of physical inactivity risk, which in turn can inform interventions for ‘at-risk’ youth (11). Tracking studies rely on longitudinal data to examine the maintenance of a phenomenon over time within a group (18). Tracking PA behaviors contributes to our understanding of how regular, cumulative PA and/or inactivity contribute to health outcomes through the lifespan. Malina (18) suggests that tracking correlations of <0.30 are low, while moderate correlations range from 0.30 to 0.60, and correlations >0.60 are moderately high. In a comprehensive review of the existing tracking literature, Malina (18) found that the majority of correlation coefficients ranged from 0.10 to 0.49, suggesting low to moderate levels of tracking. Furthermore, higher correlations are observed when the time span between measurements is shorter; thus, tracking correlations tend to decline as the interval increases (18).
Adolescence is a time of substantive physiological and social change and great inter-individual variability in maturity. For example, the onset of puberty can differ as much as four to five years in normal, healthy males and females (25); therefore, adolescents of the same chronological age would be expected to experience different physiological, psychosocial, and environmental determinants of PA due to differences in their maturity. Most research supports the notion that adolescent PA levels may be more closely associated with biological maturity than chronological age (24, 26); however, recently, Erlandson and colleagues (6) reported similar 2-year tracking estimates for PA aligned by chronological age and PA aligned by biological age.
Unlike cross-sectional designs, which offer a snapshot of a single moment in time, longitudinal designs document intra-individual biological and behavioral change, because these designs obtain within-individual variance which can be used to calculate the timing and tempo of an individual’s pattern of change (2). Numerous studies of PA in youth report that males are more active than females and that PA levels decline with age in both sexes, with the most notable decline occurring during the adolescent years (15, 22, 27, 29). While longitudinal research has established sex-specific differences and the age-related decline in PA, the reasons for these are not well understood (24).
In a sample of 951 middle school girls, Baggett and colleagues (1) report that tracking of PA and inactivity in middle school girls was very low to moderate (0.06 to 0.33), depending on the assessment method and the days measured. More specifically, three-day tracking assessments were similar whether measured by self-report or accelerometry, while six days of accelerometry tended to provide higher tracking measures than self-report or accelerometry three-day options, suggesting greater stability of PA when more days were included (1). The Iowa Bone Development Study used accelerometers to assess tracking of activity and sedentary behaviors over a three-year period in five to eight-year-old boys and girls (11). Spearman rank-order correlation coefficients between baseline and follow-up MVPA and Vigorous PA were modest (r = 0.32–0.40). The low to moderate tracking correlation coefficients found in previous studies is likely due to the complexity of PA behavior, which is difficult to accurately measure. Low to moderate tracking might also be due to real change in PA influenced by a variety of physiological, psychosocial, and environmental factors (1, 4, 9, 23).
Using an objective measure of PA, this study compared the tracking of childhood and adolescent PA aligned by chronological age and biological age. The purpose of this study was to examine tracking of PA over a ten-year period (age 5 to 15 years) from childhood to adolescence. In addition, we sought to investigate whether known sex differences in PA trajectories are altered after aligning by biological maturity instead of the traditional chronological age approach. To better understand when adolescent PA is least stable, we examined differences in the PA data organized in 2-year tracking intervals prior, during, and after puberty. When aligned by biological maturity, we hypothesized that PA trajectories would be more similar in boys and girls and that higher tracking coefficients would be seen than when aligned by chronological age.
METHODS
Participants
The Iowa Bone Development Study is an ongoing, longitudinal study of bone health during childhood, adolescence, and young adulthood. Study participants were a subset of Midwestern residents recruited from 1998 to 2001 from a cohort of 890 families then participating in the Iowa Fluoride Study. Additional information about the study design and demographic characteristics of the participants can be found elsewhere (11, 12, 13). This paper focused on data collected at 5, 9, 11, 13, and 15 years of age from 1998 to 2009. To be included in the ten-year tracking analyses, we required a PA record at every age (referred to as closed cohort; N = 140 girls, 128 boys; see Table 1). In addition, we constructed another cohort where we required at least one PA record at age 5 or 9 yr, and at least one PA record at age 13 or 15 yr (referred to as open cohort). Parents provided written informed consent, children provided assent, and the study was approved by the University of Iowa Institutional Review Board (Human Subjects).
Table 1.
Participant characteristics by gender and age for all 5 measurement periods in closed cohort.
| Age Group | Age (yr) | Na | Height (cm) | Body Mass (kg) | Nb | MVPA (min) | Vigorous PA (min) | PA Sum (counts)c |
|---|---|---|---|---|---|---|---|---|
| Girls | ||||||||
| 5 | 5.7 (0.5) | 140 | 110.9 (5.0) | 19.9 (3.7) | 139 | 48.4 (20.4) | 10.4 (7.5) | 514.1 (127.5) |
| 9 | 8.6 (0.5) | 140 | 131.9 (6.3) | 31.0 (8.4) | 133 | 45.2 (20.1) | 11.4 (8.0) | 452.6 (129.6) |
| 11 | 11.1 (0.3) | 140 | 148.6 (7.0) | 44.1 (11.6) | 133 | 40.6 (20.8) | 11.7 (9.5) | 410.2 (133.7) |
| 13 | 13.1 (0.3) | 140 | 160.1 (6.0) | 55.1 (12.9) | 123 | 32.5 (17.8) | 8.8 (8.0) | 331.0 (111.5) |
| 15 | 15.0 (0.3) | 140 | 164.0 (6.4) | 61.4 (14.2) | 114 | 25.3 (15.2) | 6.5 (6.8) | 242.8 (88.9) |
| Boys | ||||||||
| 5 | 5.7 (0.5) | 128 | 112.1 (5.7) | 20.2 (3.4) | 128 | 59.2 (23.3)* | 13.0 (9.1)* | 561.6 (128.2)* |
| 9 | 8.6 (0.6) | 128 | 133.6 (7.4) | 31.6 (8.8) | 122 | 66.7 (28.3)* | 18.8 (14.1)* | 545.9 (154.3)* |
| 11 | 11.0 (0.3) | 128 | 148.8 (7.8) | 44.2 (13.5) | 119 | 63.3 (29.5)* | 22.0 (16.5)* | 514.9 (173.4)* |
| 13 | 13.0 (0.2) | 128 | 162.4 (10.1) | 56.7 (17.8) | 114 | 52.0 (21.9)* | 16.5 (10.5)* | 429.6 (118.1)* |
| 15 | 15.0 (0.3) | 128 | 175.4 (8.3)* | 70.3 (18.6)* | 108 | 38.3 (19.2)* | 10.6 (10.4)* | 315.4 (115.3)* |
Means (SD)
Sample size for those who wore ActiGraph.
Sample size for those with height and body mass measurements.
PA Sum counts in thousands.
Boys significantly (p < 0.05) greater than girls using t-test.
Chronological Age
Chronological age (yr) was determined by subtracting date of birth from date of PA assessment and dividing by 365. Chronological age groups were constructed using 1 yr intervals, for instance, children from 8.5 to 9.4 yr were categorized into the 9 yr group. Additional Iowa Bone Development Study participants who fell outside the ages of interest (ages 4.5 – 5.4, 8.5 – 9.4, 10.5 – 11.4, 12.5 – 13.4, and 14.5 – 15.4 yr) were not included in this study.
Anthropometry
Each participant attended clinical visits where research nurses measured body mass (kilograms; kg) and height (centimeters; cm) at each measurement period. Body mass was measured using a Healthometer physician’s scale (Continental, Bridgeview IL) and height was measured using a Harpenden stadiometer (Holtain, United Kingdom). Both devices were calibrated routinely. Children were measured while wearing indoor clothes, without shoes. Sitting height was also measured when the children were 11, 13, and 15 yr. Using height, weight, age, sex, sitting height, and leg length as predictors, peak height velocity (PHV) was estimated using predictive equations determined by Mirwald (18). These equations have been validated in white Canadian children and adolescents (R2 = 0.91, 0.92, SEE = 0.49 yr, 0.50 yr, respectively) (20).
Biological Age (Maturity)
Determining years from PHV is a commonly used technique for assessing maturity in longitudinal studies, as it is one indicator of biological maturity that reflects the maximum growth rate in height during adolescence (16). This method was chosen over Tanner staging due to its noninvasive, objective nature. In this study, biological age was defined as number of years from PHV age (PA age – PHV age), which resulted in a continuous measure of biological age. Categories were also constructed for biological age using 1 yr intervals so that, for example, −1.5 to −0.51 = −1 group (before PHV), −0.5 to 0.49 = 0 group (at PHV), and 0.5 to 1.49 = 1 group (after PHV).
Physical Activity
ActiGraph accelerometer model number 7164 was worn by participants at ages 5, 9, 11, and 13 yr. Due to the discontinuation of this model at the 15 yr measurement, model GT1M was used. The ActiGraph was worn by participants during the autumn months. Validation studies examining the ActiGraph and the construction of summary variables of PA indicate that it is valid and reliable for monitoring activity in children in field settings (5, 8). At ages 5 and 9 yr, children were asked to wear the monitor during all waking hours for four consecutive days, including one weekend day. This amount of wear time has been shown to provide an 82% reliability coefficient using the Spearman-Brown prophecy formula (21). For all following ages, the children were asked to wear the monitor for five consecutive days, including both weekend days. Previous studies have shown less stable intraclass correlation coefficients in activity monitored PA in older children compared to younger children, indicating the need for increased wear time in the older children (14). To be included in the analyses, participants must have worn the monitor for at least eight hours per day and three days per measurement period (corresponding to a 60% reliability coefficient). ActiGraph movement counts were collected in one-minute epochs for ages 5, 9, 11, and 13 yr and five-second epochs for age 15 yr (later reintegrated to one-minute).
The PA variables of interest were time in MVPA (minutes), time in Vigorous PA (minutes), and PA Sum (counts). Mean values for these variables were obtained from all minutes of all valid days of wear. Cutpoints were defined as < 100 counts per minute for sedentary, ≥ 2,296 counts per minute for MVPA, and ≥ 4,012 counts per minute for Vigorous PA, as specified by Evenson and colleagues (7). PA Sum refers to the sum of all counts greater than the sedentary cutpoint, and as such reflects the total of all light, moderate, and vigorous PA (all counts ≥ 100 counts per minute).
The Evenson cutpoints (7) have been evaluated using area under the receiver operating characteristic curve (ROC-AUC). An area of 1 represents perfect classification, while an area of 0.5 represents an absence of classification accuracy (19). The moderate and vigorous cutpoints have been shown to exhibit fair (ROC-AUC = 0.74) to good (ROC-AUC = 0.84) classification accuracy, respectively. For moderate and vigorous PA combined (MVPA), the cutpoints exhibited excellent classification accuracy (ROC-AUC = 0.90). Based on a comparison of five independently developed sets of cutpoints, Trost and colleagues recommend that researchers use the Evenson cutpoints (27).
Statistical Analysis
Descriptive statistics (means, standard deviations) were calculated for the anthropometric and PA characteristics of the participants. T-tests were used to examine sex differences. Spearman correlation coefficients were used to examine the tracking of PA from age 5 to 15 yr. For the closed cohort only, logistic regression was used to determine the odds ratio of being in the lowest tertile of each PA variable of interest at age 15 yr if in the lowest tertile at age 5 yr, compared to the middle and upper tertile. Spearman correlation coefficients were also used to examine the stability of PA for chronological age and biological age in multiple two-year intervals close to PHV age. Linear mixed models were used to describe and compare sex-specific trajectories of MVPA for chronological and biological age. These models allowed utilizing all available data while taking care of missing observations at some time points and residual variance-covariance structure that incorporated correlations for all of the observations arising from the same person. Biological/chronological age and age squared were included in the models; a cubed age term was also tried, but was not statistically significant demonstrating that at least up to the age of the study follow-up quadratic polynomial was adequate to describe MVPA trajectory shapes. An unstructured residual covariance matrix was initially investigated and compared with heterogeneous autoregressive structure that assumes the lower residual correlation the further apart in time the measurements are on the same person. Heterogeneous autoregressive residual covariance appeared adequate for the models. The models did not include any adjustment variables, since this report was not specifically designed to investigate covariates of PA. Overall, the study participants were mostly white, with above average socioeconomic status and living in safe, non-restrictive environments for PA, so it appeared that comparisons of non-adjusted trajectories for boys and girls were justified. All statistical analyses were conducted using SAS version 9.2 and were analyzed separately by sex. Results with p < 0.05 were considered statistically significant.
RESULTS
The distribution of the participants’ characteristics in the closed cohort at each age (5 to 15 yr) is reported in Table 1. The boys were significantly taller and had more body mass than the girls at age 15 (p < 0.05). On average, participants wore the monitor 12.29 hours per day (SD = 1.58 hr) and for 4.43 days (SD = 0.60 day). The Spearman correlation coefficients for this closed cohort are shown in Tables 2a, b, and c (MVPA, Vigorous PA, and PA Sum, respectively). The 10-year tracking coefficients from age 5 to 15 were higher in girls for all PA variables (MVPA: r = 0.27; Vigorous: r = 0.23; PA Sum: r = 0.24; all p < 0.05) when compared to the boys (MVPA: r = 0.02; Vigorous: r = −0.03; PA Sum: r = 0.02; all p > 0.05).
Table 2.
Spearman correlation coefficients for closed cohort.
| a. MVPA (min).
| |||||||||||
|---|---|---|---|---|---|---|---|---|---|---|---|
| Girls | Boys | ||||||||||
|
| |||||||||||
| Age (yr) | 5 | 9 | 11 | 13 | 15 | Age (yr) | 5 | 9 | 11 | 13 | 15 |
| 5 | 0.39** | 0.29** | 0.21* | 0.27* | 5 | 0.35** | 0.32** | 0.36** | 0.02 | ||
| 9 | 0.46** | 0.31** | 0.22* | 9 | 0.52** | 0.34** | 0.08 | ||||
| 11 | 0.54** | 0.28** | 11 | 0.50** | 0.28* | ||||||
| 13 | 0.27* | 13 | 0.33** | ||||||||
| 15 | 15 | ||||||||||
| b. Vigorous PA (min).
| |||||||||||
|---|---|---|---|---|---|---|---|---|---|---|---|
| Girls | Boys | ||||||||||
|
| |||||||||||
| Age (yr) | 5 | 9 | 11 | 13 | 15 | Age (yr) | 5 | 9 | 11 | 13 | 15 |
| 5 | 0.26* | 0.22* | 0.16 | 0.23* | 5 | 0.38** | 0.30** | 0.25* | −0.03 | ||
| 9 | 0.29** | 0.12 | 0.09 | 9 | 0.55** | 0.31** | 0.10 | ||||
| 11 | 0.40** | 0.25* | 11 | 0.48** | 0.25* | ||||||
| 13 | 0.31** | 13 | 0.35** | ||||||||
| 15 | 15 | ||||||||||
| c. PA Sum (counts).
| |||||||||||
|---|---|---|---|---|---|---|---|---|---|---|---|
| Girls | Boys | ||||||||||
|
| |||||||||||
| Age (yr) | 5 | 9 | 11 | 13 | 15 | Age (yr) | 5 | 9 | 11 | 13 | 15 |
| 5 | 0.42** | 0.36** | 0.26* | 0.24* | 5 | 0.34** | 0.24* | 0.28* | 0.02 | ||
| 9 | 0.47** | 0.31** | 0.24* | 9 | 0.45** | 0.28* | 0.08 | ||||
| 11 | 0.55** | 0.31** | 11 | 0.40** | 0.20* | ||||||
| 13 | 0.39** | 13 | 0.36** | ||||||||
| 15 | 15 | ||||||||||
p-value < 0.05;
p-value < 0.01
Logistic regression was used in the closed cohort to determine the odds ratio, or increased risk, of remaining in the lowest tertile of each PA variable at age 15 if previously in the lowest tertile at age 5, compared with the middle and upper tertile (Table 3). For MVPA and Vigorous PA, the girls in the lowest tertile at age 5 had an increased risk of remaining in the lowest tertile at age 15, compared to the girls in the middle and upper tertiles (OR = 3.1 and 2.8, respectively). The boys in the lowest tertile at age 5 did not show this increased risk for age 15, when compared to the boys in the middle and upper tertile, for MVPA and Vigorous PA. For PA Sum, neither the girls nor the boys in the lowest tertile at age 5 had an increased risk of remaining in the lowest tertile at age 15, compared to the others in the middle and upper tertile.
Table 3.
Odds ratio for staying in lowest PA tertile at age 15 if in lowest tertile at Age 5 for closed cohort.
| Girls | Boys | |
|---|---|---|
| OR (95% CI) | OR (95% CI) | |
| MVPA (min) | 3.1 (1.4, 6.9) | 1.3 (0.6, 3.1) |
| Vigorous PA (min) | 2.8 (1.2, 6.1) | 0.9 (0.4, 2.1) |
| PA Sum (counts) | 1.7 (0.8, 3.9) | 1.0 (0.4, 2.4) |
Variables dichotomized as 1 = lowest tertile of PA and 0 = all others.
The distribution of the participants’ characteristics (open cohort) for the 2-year intervals surrounding PHV were similar to the closed cohort (data not shown). When sorted by chronological age, the boys were significantly more active than the girls at every age for MVPA, Vigorous PA, and PA Sum (p < 0.05) (Table 4). When aligned by biological age, the average counts remained higher for the boys than the girls at every age for all three PA variables of interest, but fewer comparisons were statistically significant.
Table 4.
MVPA, Vigorous PA, and PA Sum by gender, chronological age (CA), and biological age (BA)a in open cohort.
| CA (yr) | N | MVPA (min) | Vigorous PA (min) | PA Sum (counts)b | BA (yr) | N | MVPA (min) | Vigorous PA (min) | PA Sum (counts)b |
|---|---|---|---|---|---|---|---|---|---|
| Girls | Girls | ||||||||
| 9 | 112 | 46.4 (22.7) | 12.8 (11.2) | 468.8 (155.9) | −2 | 35 | 40.6 (19.3) | 11.1 (8.6) | 418.3 (94.2) |
| 11 | 112 | 38.8 (19.2) | 10.9 (8.6) | 396.5 (112.7) | 0 | 35 | 38.2 (21.6) | 11.3 (9.9) | 381.3 (125.0) |
| 11 | 196 | 39.5 (19.6) | 11.0 (9.1) | 406.8 (123.9) | −1 | 119 | 41.9 (20.9) | 12.2 (10.0) | 424.1 (133.5) |
| 13 | 196 | 33.2 (18.6) | 9.6 (9.5) | 339.7 (123.5) | 1 | 119 | 33.8 (18.7) | 9.6 (10.1) | 348.6 (129.9) |
| 13 | 159 | 33.2 (19.0) | 9.4 (9.4) | 336.2 (109.8) | 0 | 61 | 36.4 (19.4) | 9.9 (8.6) | 372.4 (116.6) |
| 15 | 159 | 25.8 (16.8) | 7.0 (9.0) | 249.9 (107.0) | 2 | 61 | 28.3 (18.0) | 8.4 (10.2) | 304.7 (131.7) |
| Boys | Boys | ||||||||
| 9 | 96 | 64.9 (29.1)* | 19.3 (15.0)* | 539.5 (161.9)* | −2 | 91 | 59.1 (27.7)* | 20.3 (15.6)* | 484.0 (161.2)* |
| 11 | 96 | 63.5 (31.7)* | 21.3 (16.4)* | 520.5 (181.6)* | 0 | 91 | 45.6 (23.0) | 13.8 (12.4) | 385.3 (137.8) |
| 11 | 194 | 63.8 (29.8)* | 22.2 (16.2)* | 517.9 (173.9)* | −1 | 75 | 50.3 (22.7)* | 15.7 (9.7)* | 428.5 (125.6) |
| 13 | 194 | 51.2 (23.5)* | 16.5 (11.7)* | 424.6 (135.9)* | 1 | 75 | 39.3 (21.3) | 11.4 (12.8) | 330.2 (131.3) |
| 13 | 165 | 50.6 (22.0)* | 16.0 (10.5)* | 422.0 (128.0)* | 0 | 59 | 49.3 (20.7)* | 14.8 (9.4)* | 410.0 (113.2) |
| 15 | 165 | 37.5 (19.0)* | 10.2 (9.7)* | 309.1 (113.0)* | 2 | 59 | 37.9 (20.4)* | 11.0 (11.2) | 306.7 (128.9) |
Means (SD)
Biological age calculated in years from age at peak height velocity.
PA Sum counts in thousands.
Boys significantly (p < 0.05) greater than girls using t-test.
The PA Spearman correlation coefficients for the two-year intervals immediately surrounding PHV are shown in Figure 1. The girls’ two-year interval associations for PA were moderate (r = 0.31 – 0.56; p < 0.05) when aligned by chronological age. However, when aligned by biological age, they were moderate to high associations (r = 0.41 – 0.63; p < 0.05). The boys’ associations were low to moderate when aligned chronologically or biologically (r = 0.26 – 0.56; p < 0.05). From −1 to 1 yr the correlation coefficients were not statistically significant (MVPA: r = 0.11, Vigorous PA: r = 0.15, PA Sum: r = 0.09; all p > 0.05).
Figure 1.

Spearman correlation coefficients for Chronological and Biological Age by gender, MVPA, Vigorous PA, and PA Sum in open cohort. All coefficients statistically significant (p < 0.05) except boys −1 to 1 yr for MVPA, Vigorous PA, and PA Sum
For both chronological and biological age, girls’ average time in MVPA was highest at the youngest age and steadily declined thereafter (Figure 2). For both chronological and biological age, boys’ average time spent in MVPA increased until mid-childhood, followed by a decline in late-childhood and adolescence. Trajectories for boys and girls appear more similar and even overlap in the later years when aligned by biological age rather than chronological age. For example, for chronological age, the mean difference between boys’ and girls’ MVPA began at approximately 7 minutes at age 5, widened to about 20 minutes at 9.5 years of age, and then decreased to about 10 minutes at age 15. For biological age, the mean difference between boys’ and girls’ MVPA began at approximately 15 minutes at −7 yr, remained approximately 15 minutes at −1.5 yr, then decreased to 0 minutes (overlapped) 3 yr post-PHV.
Figure 2.
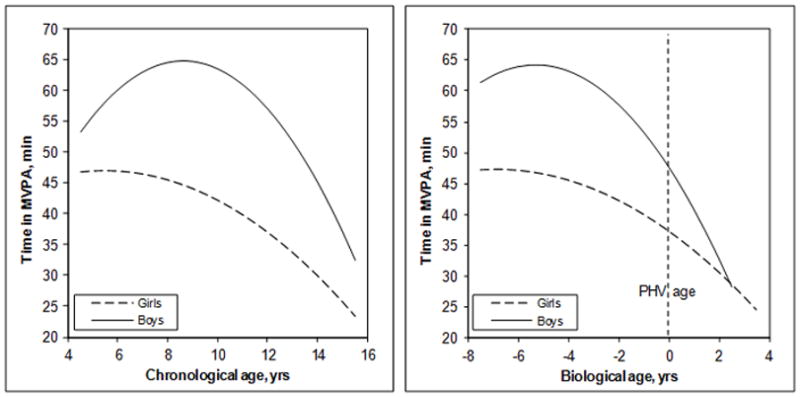
Predicted Trajectory of Time in MVPA (min) for Chronological and Biological Age in the Open Cohort.
DISCUSSION
The purpose of this report was to examine tracking of PA from childhood to adolescence. The ten-year associations (age 5 to 15) and odds ratios indicate that girls have more stable and predictive PA levels than boys. The tracking data suggest a tendency for active girls to remain active and inactive girls to remain inactive as they age. The odds ratios suggest an increased risk of maintaining inactive MVPA and Vigorous PA levels at age 15 for girls who are inactive at age 5. In addition, our data suggest that, on average, girls maintain an inadequate level of PA from childhood through adolescence, i.e., the mean time spent in MVPA for girls was below the federal guideline of 60 minutes per day. The insignificant PA ten-year correlation coefficients and odds ratios for boys suggest that their activity level is less predictable and that boys are likely to alter their activity patterns over time.
Additionally, we investigated whether known sex differences in PA were altered after aligning by biological maturity instead of the traditional chronological age approach. Predicting age at PHV is a commonly used measure of maturity for many scholars within the PA literature (2, 6, 16, 18, 20, 24, 26). Similar to most of the previous research, our results showed that girls were significantly less active than boys when aligned by chronological age. However, our results differed from previous studies when aligned by biological maturity. Erlandson et al., Sherer et al., and Thompson et al. (6, 24, 26) found that the sex difference in PA disappeared completely when analyzed by biological maturity (using age at PHV), while our results indicated that sex differences in mean MVPA were reduced, but not eliminated. Similarly, the shapes of our trajectories for MVPA were more alike for boys and girls when aligned by biological maturity than chronological age (Figure 1). While not completely consistent with previous research, our results support the notion that the factors determining PA behaviors are more closely aligned with maturity than chronological age. Important implications of this finding could be to target PA interventions for girls earlier than boys to account for the different timing of puberty between the sexes, or to group children and adolescents by maturity status instead of chronological age when conducting research on determinants of PA participation and during PA interventions.
By using multiple two-year interval data from the same cohort, this study also provided a tight focus on adolescent PA behavior. Examining data at various two-year intervals provides more context to the unique developmental and psychosocial changes that may occur around the adolescent growth “spurt”, from start to finish. Of particular interest is the −1 to 1 year PHV comparison in boys that resulted in low (p > 0.05) Spearman correlation coefficients. These low associations during the 2-year interval spanning the attainment of PHV (adolescent growth “spurt”) suggest that this time of physical development might be a critical period for change in PA participation for boys. This changing of activity patterns could result in a formerly inactive boy becoming more active or vice versa. Research exploring why boys alter their PA patterns in the time surrounding puberty is lacking but could provide important information to be used in designing future interventions. For example, a recent analysis conducted by Hearst and colleagues (10) found that, among boys, self-efficacy or confidence to be physically active was an important psychosocial predictor of positive change in PA over time. It seems likely that self-efficacy in boys would be a particularly salient and changing factor during puberty. Within a group of boys of the same age, those who have reached biological maturity are usually taller and stronger than those who are premature (17). Perhaps the time immediately surrounding puberty in boys aligns with the time youth sport becomes competitive and when sport teams begin to make cuts, thus encouraging more participation in early maturing boys and limiting opportunities for those who mature later regardless of previous activity patterns.
Since self-reported PA often fails to capture the complexity of PA behavior in children and adolescents (23), the use of objective motion sensors (i.e., ActiGraph accelerometry) is a strength of this study, as it provides a valid and reliable measure of both structured and unstructured (i.e., lifestyle) movements. Additionally, this longitudinal research design with repeat measurement periods offers an important picture of adolescent PA levels by depicting the shape of the trajectory and, therefore, the nature of PA changes. Limitations of our research include the use of a mostly white, relatively high socioeconomic status, convenience sample that is not fully representative of the Iowa or U.S. population. In addition, the one-minute epochs used to accumulate accelerometer movement counts could have possibly underestimated shorter bouts of vigorous PA and muted the true reduction in PA over time.
In summary, our work suggests that girls’ MVPA at age 5 is associated with their age 15 activity, while the boys’ PA level did not track. The untracking of PA for boys occurred during their adolescent growth “spurt.” The moderate ten-year tracking associations reported for girls and the insignificant associations for boys indicate the need to conduct further research into the determinants of PA for children and adolescents, as well as to maintain the current public health strategy of a population focus for promoting PA for all children.
Acknowledgments
Source of Funding: This work was supported by the National Institute of Dental and Craniofacial Research (R01-DE12101 and R01-DE09551) and the National Center for Research Resources (UL1 RR024979 and M01-RR00059).
The authors would like to gratefully acknowledge and thank the children and families participating in the Iowa Fluoride Study and the Iowa Bone Development Study, because without their contributions, this work would not have been possible. We also thank the staff of the Iowa Fluoride Study for their organizational efforts and the investigators of the IBDS, Drs. Trudy Burns, James Torner, Marcia Willing, and Julie Eichenberger-Gilmore, for their support.
Footnotes
Conflicts of Interest
The results of the present study do not constitute endorsement by ACSM and the authors declare no conflicts of interest.
References
- 1.Baggett CD, Stevens J, McMurray RG, Evenson KR, Murray DM, Catellier DJ, He K. Tracking of physical activity and inactivity in middle school girls. Med Sci Sports Exerc. 2008;40(11):1916–22. doi: 10.1249/MSS.0b013e318180c390. [DOI] [PMC free article] [PubMed] [Google Scholar]
- 2.Baxter-Jones ADG, Eisenmann JC, Sherar LB. Controlling for maturation in pediatric exercise science. Pediatr Exerc Sci. 2005;17(1):18–30. [Google Scholar]
- 3.Centers for Disease Control and Prevention (CDC) Division of Nutrition, Physical Activity and Obesity, National Center for Chronic Disease Prevention and Health Promotion. Childhood Overweight and Obesity: Contributing Factors. 2009 Retrieved December 7, 2011, from http://www.cdc.gov/obesity/childhood/causes.html.
- 4.Drenowatz C, Eisenmann JC, Pfeiffer KA, Wickel EE, Gentile D, Walsh D. Maturity-related differences in physical activity among 10- to 12-year-old girls. Am J Hum Biol. 2010;22(1):18–22. doi: 10.1002/ajhb.20905. [DOI] [PubMed] [Google Scholar]
- 5.Ekelund U, Sjostrom M, Yngve A, et al. Physical activity assessed by activity monitor and doubly-labeled water in children. Med Sci Sports Exerc. 2001;33(2):275–81. doi: 10.1097/00005768-200102000-00017. [DOI] [PubMed] [Google Scholar]
- 6.Erlandson MC, Sherar LB, Mosewich AD, Kowalski KC, Bailey DA, Baxter-Jones ADG. Does controlling for biological maturity improve physical activity tracking? Med Sci Sports Exerc. 2011;43(5):800–07. doi: 10.1249/MSS.0b013e3181ffee8a. [DOI] [PubMed] [Google Scholar]
- 7.Evenson KR, Catellier DJ, Gill K, Ondrak KS, McMurray RG. Calibration of two objective measures of physical activity for children. J Sports Sci. 2006;24(14):1557–65. doi: 10.1080/02640410802334196. [DOI] [PubMed] [Google Scholar]
- 8.Fairweather SC, Reilly JJ, Grant S, Whittaker A, Paton JY. Using the computer science and applications (CSA) activity monitor in preschool children. Pediatr Exerc Sci. 1999;11(4):413–20. [Google Scholar]
- 9.Harro M, Riddoch CJ. Physical activity. In: Armstrong N, van Mechelen W, editors. Paediatric Exercise Science and Medicine. Oxford: Oxford University Press; 2000. pp. 77–84. [Google Scholar]
- 10.Hearst MO, Patnode CD, Sirard JR, Farbakhsh K, Lytle LA. Multilevel predictors of adolescent physical activity: a longitudinal analysis. IJBNPA. 2012;9:8. doi: 10.1186/1479-5868-9-8. [DOI] [PMC free article] [PubMed] [Google Scholar]
- 11.Janz KF, Burns TL, Levy SM. Tracking of activity and sedentary behaviors in childhood: The Iowa Bone Development Study. Am J Prev Med. 2005;29(3):171–8. doi: 10.1016/j.amepre.2005.06.001. [DOI] [PubMed] [Google Scholar]
- 12.Janz KF, Levy SM, Burns TL, Torner JC, Willing MC, Warren JJ. Fatness, physical activity, and television viewing in children during the adiposity rebound period: The Iowa Bone Development Study. Prev Med. 2002;35(6):563–71. doi: 10.1006/pmed.2002.1113. [DOI] [PubMed] [Google Scholar]
- 13.Janz KF, Kwon S, Letuchy EM, et al. Sustained effect of early physical activity on body fat mass in older children. Am J Prev Med. 2009;37(1):35–40. doi: 10.1016/j.amepre.2009.03.012. [DOI] [PMC free article] [PubMed] [Google Scholar]
- 14.Janz KF, Witt J, Mahoney LT. The stability of children’s physical activity as measured by accelerometry and self-report. Med Sci Sports Exer. 1995;27(9):1326–1332. [PubMed] [Google Scholar]
- 15.Kimm SYS, Glynn NW, Kriska AM, Barton BA, Kronsberg SS, Daniels SR, Crawford PB, Sabry ZI, Liu K. Decline in physical activity in black girls and white girls during adolescence. N Engl J Med. 2002;347(10):709–15. doi: 10.1056/NEJMoa003277. [DOI] [PubMed] [Google Scholar]
- 16.Malina RM. Adolescent growth and maturation: selected aspects of current research. Yearbook Phys Anthropol. 1978;21:63–94. [Google Scholar]
- 17.Malina RM, Bouchard C, Bar-Or O. Growth, Maturation, and Physical Activity. 2. Champaign (IL): Human Kinetics; 2004. p. 10. [Google Scholar]
- 18.Malina RM. Tracking of physical activity across the lifespan. Res Digest. 2001;3(14):1–8. [Google Scholar]
- 19.Metz CE. Basic principles of ROC analysis. Semin Nucl Med. 1978;8:283–98. doi: 10.1016/s0001-2998(78)80014-2. [DOI] [PubMed] [Google Scholar]
- 20.Mirwald RL, Baxter-Jones AD, Bailey DA, Beunen GP. An assessment of maturity from anthropometric measurements. Med Sci Sports Exerc. 2002;34(4):689–94. doi: 10.1097/00005768-200204000-00020. [DOI] [PubMed] [Google Scholar]
- 21.Penpraze V, Reilly JJ, MacLean CM, Montgomery C, Kelly LA, Paton JY, Aitchison T, Grant S. Monitoring of physical activity in young children: How much is enough? Pediatric Exercise Science. 2006;18(4):483–491. doi: 10.1123/pes.18.4.483. [DOI] [PubMed] [Google Scholar]
- 22.Prochaska JJ, Rodgers MW, Sallis JF. Association of parent and peer support with adolescent physical activity. RQES. 2002;73(2):206–10. doi: 10.1080/02701367.2002.10609010. [DOI] [PubMed] [Google Scholar]
- 23.Riddoch CJ, Andersen LB, Wedderkopp N, Harro M, Klasson-Heggebo L, Sardinha LB, Cooper AR, Ekelund U. Physical activity levels and patterns of 9- and 15-yr-old European children. Med Sci Sports Exerc. 2004;36(1):86–92. doi: 10.1249/01.MSS.0000106174.43932.92. [DOI] [PubMed] [Google Scholar]
- 24.Sherar LB, Esliger DW, Baxter-Jones ADG, Tremblay MS. Age and gender differences in youth physical activity: Does physical maturity matter? Med Sci Sports Exerc. 2007;39(5):830–35. doi: 10.1249/mss.0b013e3180335c3c. [DOI] [PubMed] [Google Scholar]
- 25.Summers-Effler E. Little girls in women’s bodies: Social interaction and the strategizing of early breast development. Sex Roles. 2004;51(1):29–44. [Google Scholar]
- 26.Thompson AM, Baxter-Jones ADG, Mirwald RL, Bailey DA. Comparison of physical activity in male and female children: Does maturation matter? Med Sci Sports Exerc. 2003;35(10):1684–90. doi: 10.1249/01.MSS.0000089244.44914.1F. [DOI] [PubMed] [Google Scholar]
- 27.Trost SG, Loprinzi PD, Moore R, Pfeiffer KA. Comparison of accelerometer cut-points for predicting activity intensity in youth. Med Sci Sports Exerc. 2011;43(7):1360–8. doi: 10.1249/MSS.0b013e318206476e. [DOI] [PubMed] [Google Scholar]
- 28.Trost SG, Pate RR. Physical activity in children and youth. In: Rippe JM, editor. Lifestyle Medicine. Malden, MA: Blackwell Science; 1999. pp. 663–673. [Google Scholar]
- 29.Trost SG, Pate RR, Sallis JF, Freedson PS, Taylor WC, Dowda M, Sirard J. Age and gender differences in objectively measured physical activity in youth. Med Sci Sports Exerc. 2002;34(2):350–55. doi: 10.1097/00005768-200202000-00025. [DOI] [PubMed] [Google Scholar]
- 30.U.S. Department of Health and Human Services. Office of Disease Prevention and Health Promotion. Healthy People 2020. Washington, DC: [Accessed January 07, 2011]. Available at http://healthypeople.gov/2020/topicsobjectives2020/default.aspx. [Google Scholar]