

Abstract
Huntington disease (HD) is a neurodegenerative disorder that involves preferential atrophy in the striatal complex and related subcortical nuclei. In this article, which is based on a dataset extracted from the PREDICT‐HD study, we use statistical shape analysis with deformation markers obtained through “Large Deformation Diffeomorphic Metric Mapping” of cortical surfaces to highlight specific atrophy patterns in the caudate, putamen, and globus pallidus, at different prodromal stages of the disease. On the basis of the relation to cortico‐basal ganglia circuitry, we propose that statistical shape analysis, along with other structural and functional imaging studies, may help expand our understanding of the brain circuitry affected and other aspects of the neurobiology of HD, and also guide the most effective strategies for intervention. Hum Brain Mapp 35:792–809, 2014. © 2012 Wiley Periodicals, Inc.
Keywords: striatal atrophy, pallidus atrophy, diffeomorphic mapping, surface registration, surface‐based morphometry
INTRODUCTION
Huntington disease (HD, MIM 143100) is a progressive, fatal, neurodegenerative disorder that presents with movement disorder, psychiatric features, and cognitive decline [Harper et al., 2000; Imarisio et al., 2008; Morrison et al., 2011; Paulson and Albin, 2010; Ross and Tabrizi, 2011; Warby et al., 2010].
HD is caused by a cytosine–adenine–guanine (CAG) repeat expansion in the huntingtin gene coding for an expanded polyglutamine repeat in the huntingtin protein [HD Collaborative Group, 1993]. Motor onset of HD is defined as voluntary and involuntary movement abnormalities consistent with an extrapyramidal movement disorder in an individual at risk for HD. CAG repeat length is inversely correlated with age of motor onset, with age dependent penetrance for repeat lengths between 36 and 40, and then earlier ages of motor onset for longer repeat lengths above 40.
Because predictive genetic testing is available, there is now a group of individuals who have tested positive for the HD triplet repeat expansion, but do not yet have manifest HD though some may have subtle motor, cognitive, or psychiatric signs (prodromal HD) [Paulsen et al., 2006, 2008; Tabrizi et al., 2011]. Using the relationship between CAG repeat length and motor onset age, it is possible to predict roughly how far a prodromal HD mutant allele carrier is from expected age of motor onset [Aylward et al., 2004; Langbehn et al., 2010; Ranen et al., 1995]. Alternatively, it is possible to define a “CAP score” (using a model including a CAG‐Age Product term [Langbehn et al., 2010]), which gives an index of the degree of exposure to the toxic polyglutamine expansion and correlates inversely with predicted years to motor onset [Zhang et al., 2011].
HD involves preferential atrophy of the striatal complex (caudate, putamen, nucleus accumbens) of the basal ganglia, and related subcortical nuclei [Vonsattel and Lianski, 1997]. There is atrophy of other brain regions as well, including substantial atrophy of subcortical white matter [de la Monte et al., 1988; Lange et al., 1976]. Within the striatum, there is dramatic loss of the medium spiny projection neurons, which constitute the great majority of cells in the striatum with sparing of some populations of striatal interneurons [Ferrante et al., 1987a, 1985, 1987b]. Neuropathologic studies of HD subjects suggest that striatal atrophy proceeds in dorsal to ventral and medial to lateral gradients with initial neuronal loss in the dorsal medial head of the caudate and dorsal medial putamen. There is also early neuronal loss in the tail of the caudate [Vonsattel et al., 1985]. In contrast, there is relative sparing of the nucleus accumbens and ventral striatum [Ferrante et al., 1986].
Striatal degeneration in HD disrupts cortico‐basal ganglionic‐thalamocortical circuits controlling movement, thought, and emotions [Albin et al., 1989; Alexander et al., 1986]. Neurons of deeper layers of some neocortical regions also degenerate, though not as dramatically as those in the striatum [Cudkowicz and Kowall, 1990; de la Monte et al., 1988; Hedreen et al., 1991; Sotrel et al., 1993].
Brain imaging studies have substantially advanced our knowledge of regional brain atrophy in HD [Aylward et al., 2004; Douaud et al., 2006; Fennema‐Notestine et al., 2004; Hobbs et al., 2009; Jernigan et al., 1991; Marrakchi‐Kacem et al., 2010; Sritharan et al., 2010; Vandenberghe et al., 2009; Weaver et al., 2009]. The neurobiological predictors of huntington's disease (PREDICT‐HD) study is a longitudinal characterization of these individuals at multiple sites in the US, Europe, and Australia, including structural brain MRI imaging, and using the CAP score. The TRACK‐HD study is a comparable study at different sites, in Europe and Canada.
MRI studies of prodromal HD individuals have found that striatal atrophy begins many years prior to predicted motor onset [Aylward et al., 2011; Jurgens et al., 2008; Paulsen et al., 2008, 2010; Squitieri, Cannella et al., 2009; Tabrizi et al., 2009, 2011]. Cross‐sectional and longitudinal studies [Aylward et al., 2011; Ross and Tabrizi, 2011; Tabrizi et al., 2012] indicate that atrophy proceeds relatively steadily throughout the prodromal HD period, beginning about 15 years prior to expected motor onset. MRI studies have indicated that other subcortical structures are affected, including subcortical white matter, and that in addition there is atrophy of some regions of cortical gray matter [Aylward et al., 2011; Hobbs et al., 2010; Stoffers et al., 2010; Tabrizi et al., 2011]. It has been suggested that the regions undergoing atrophy can be defined by their participation in the cortico‐basal ganglionic‐thalamocortical circuits [Douaud et al., 2009].
To date, most MRI studies of subcortical gray matter nuclei have defined a single measure of structural volume. While this has the advantage of being quantitative, it does not give specific information about the cell death pattern in the nuclei. This information would be useful in order to determine whether MRI morphometric results correlate with previous neuropathologic studies, to define better the subregional distribution of atrophy, and for correlation of pathologic deviations from the norm with clinical features of HD.
Methods of statistical shape analysis have proved enlightening for studying normal age related variation in subcortical nuclei and for studying a number of other diseases [Ashburner et al., 2003; Csernansky et al., 1998, 2002, 2000; Qiu et al., 2009a, 2009b, 2008, 2007, c, 2010; Thompson et al., 2004; van den Bogaard et al., 2011; Wang et al., 2007]. We have now applied statistical shape analysis methods to define regional atrophy within subcortical gray matter nuclei in a pilot study of a subset of individuals from the PREDICT‐HD study. We find that there is substantial heterogeneity of atrophy within basal ganglia nuclei. We find that shape analysis sensitively detects selective atrophy in specific regions of striatum and globus pallidus. Based on the relation to cortico‐basal ganglia circuitry, we propose that statistical shape analysis, along with other structural and functional imaging studies, may help expand our understanding of the neurobiology of HD, and also guide the most effective strategies for intervention.
Our shape analysis pipeline follows a general pattern that is common to many of other published studies although specific details vary. Reliable statistical analyses require a preliminary alignment phase, which produces a generally high dimensional representation of the data in a coordinate system in which each coordinate is directly comparable across shapes. A common approach in this framework is to register all shapes to a single one, called a template, defining each anatomy by its relative position with respect to the template. This operation, described in “LDDMM‐Surface Registration” section, will be done using diffeomorphic mapping methods. It is important, in this context, to ensure that the template is as close to the studied population as possible and it will be defined, in our study, as a population average along the lines described in “Template Averaging” section. Finally, the statistical analysis itself uses standard multivariate models, in which significance must be carefully assessed while considering multiple comparisons. It will be defined in “Statistical Analysis” section.
METHODS
Data Acquisition and Structure
Datasets were selected from the PREDICT‐HD study where the subjects are at risk for HD (have a parent with HD) and had previously undergone elective presymptomatic genetic testing. Prodromal subjects were those that are found to be gene expanded (CAG length ≥ 36) but had not yet manifested the disease (based on motor diagnostic guidelines). Those that were found to be nongene expanded (CAG at or below 30) were enrolled as comparison subjects. There were no subjects with CAG between 30 and 36 used in this analysis. Participants were recruited from 32 sites across the United States, Canada, Europe, and Australia and underwent annual study visits consisting of a neurological motor examination, cognitive assessment, brain MRI (biennial), psychiatric and functional assessment, with blood samples for genetic and biochemical analyses. Informed written consent was obtained from all subjects before participating in this study.
Subjects with CAG expansion were divided into three subgroups (“low,” “mid,” and “high”) based on their CAP score defined by their CAG repeat length and current age, which corresponds to risk for motor onset of HD. The dataset consisted of 80 subjects, structured as described in Table 1.
Table 1.
Demographic structure of the dataset
| Controls | Low | Mid | High | Total | |
|---|---|---|---|---|---|
| Female/Male | 10/10 | 10/6 | 11/7 | 17/9 | 48/32 |
| Mean age (standard deviation) | 42.8 (10.6) | 36.7 (8.9) | 41.7 (9.1) | 43.3 (8.7) | 41.5 (9.5) |
All scans were obtained using a standard multimodal protocol from 1.5T scanners. The scanning protocol included a sagittal localizer, an axial three‐dimensional volumetric spoiled gradient recalled acquisition in steady state sequence (relaxation time (TR) = 18, excitation time (TE) = 3, field of view (FOV) = 24, thickness/gap = 1.5/0.0 mm, matrix = 256 × 192 with ¾ phase FOV, number of excitations (NEX) = 2, flip angle = 20°, 124 slices) and a coronal T2/proton density (PD) sequence (TR = 3,000, TE = 28, FOV = 26, thickness/gap = 3.0/0.0 mm, matrix = 256 × 192, NEX = 1, flip angle = 90°, 64 slices).
Each scan session was processed using the BRAINS AutoWorkup processing pipeline published in Pierson et al. 2011. After completion of AutoWorkup, all scans were individually inspected and manually corrected where necessary to ensure correct realignment and coregistration, tissue classification, and accuracy of brain and subcortical structures. The resulting preprocessed data included T1, T2, PD, and tissue classification volumetric images where the anterior commissure (AC point) was set to be the center of the image resampled to 1‐mm resolution in a 256 × 256 × 256 matrix along with binary images for the six substructures evaluated in this work (accumbens, caudate, globus pallidus, hippocampus, putamen, and thalamus). In preparation for surface‐based morphometry (SBM), all segmented binary volumes were converted into triangulated surfaces using the iso2mesh open source software.
Shape Analysis
Template averaging
Using rigid registration (rotation and translation), each surface was aligned to a common spatial position. The rigid registration algorithm computed an optimal transformation between vertices of two surfaces S 0 and S 1, by minimizing a score combining registration and soft assignment, given by
In this expression, R and T are a rotation matrix and a translation vector, respectively; σ1 and σ2 are area forms on S 1 and S 2, respectively; and w is a soft assignment function defined on S 1 × S 2, and is constrained to be positive, and to satisfy
for all (x,y) ∊ S 1 × S 2. This problem and the associated minimization algorithm are similar to the ones considered in [Rangarajan et al., 1997]. Right subvolumes were flipped before alignment to ensure that all structures could be compared.
From rigidly aligned volumes, and for each substructure, we computed an average shape, or template, using the algorithm described in Ma et al. 2010. This algorithm computes the average based on a generative shape model, in which an observed surface is modeled as a random deformation of a template, followed by the addition of some colored noise. Given this model, the template is estimated from data using an approximation of the expectation‐maximization (EM) algorithm, subject to some topology constraints, which are enacted by ensuring that the template is a diffeomorphic deformation of a reference shape, called hypertemplate (using a Bayesian viewpoint in which the template is considered as a random deformation of the hypertemplate). We refer the reader to Ma et al. 2010 for details.
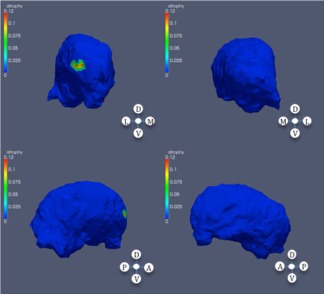
The resulting templates for the accumbens, caudate, globus pallidus, hippocampus, putamen, and thalamus are visualized in Figure 1. They were computed by running the averaging algorithm on the full population (160 volumes using left and right rigidly registered subvolumes) and were therefore blind to group labels.
Figure 1.
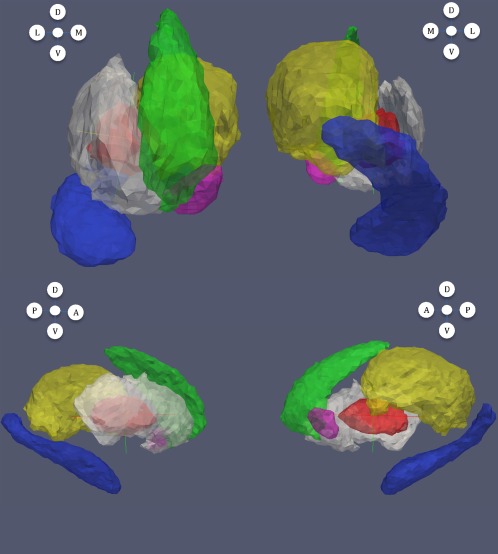
Templates computed for each subvolume. Magenta: accumbens; green: caudate; red: globus pallidus; blue: hippocampus; white: putamen; yellow: thalamus. In this figure and all subsequent ones: from left to right and top to bottom: anterior, posterior, lateral and medial views; letters A, P, D, V, L, and M, respectively, refer to anterior, posterior, dorsal, ventral, lateral, and medial directions.
LDDMM‐surface registration
The next step computes a nonrigid registration between the template and all 160 surfaces for a given subvolume. We used, for this purpose, the large deformation diffeomorphic metric mapping (LDDMM) surface registration algorithm, which is described in Vaillant and Glaunès 2005. For a given target surface, this algorithm computes a smooth, invertible transformation that can be applied to the template (represented as a triangulated surface) to deform it into a surface that is very close to the target. More precisely, it minimizes a two‐term energy function taking the form
where S temp is the template surface, S obs is the observed surface, and S def is the deformed template, which is estimated by the procedure. The first term, distshape, is a geodesic distance in shape space, which computes and optimizes a least‐deformation path between two surfaces, the distance being given by the optimal deformation cost. See Grenander and Miller 2007; Mumford and Desolneux 2010; Younes 2010 for additional details. The error term, which was introduced in Vaillant and Glaunès 2005, computes a norm between surfaces. The construction, based on a mathematical representation of surfaces in terms of “geometric currents,” is rather involved and the interested reader is again referred to Grenander and Miller 2007; Mumford and Desolneux 2010; Younes 2010 for complements.
Statistical Analysis
We performed SBM analyses on each subvolume, in two different ways. The first set of analyses focused on group difference, and made separate comparisons of the shape markers (defined as the degree of atrophy relative to the template, as measured by shape analysis) between each group of patients (low, mid, and high CAP scores) and the control group. The second set replaced group information by the rank of each subject in terms of CAP scores (and therefore only focuses on prodromal HD subjects). Both analyses included age, gender, and intracranial volumes as covariates; they computed statistics at each vertex of the triangulated template surface and returned P values corrected for multiple comparisons using permutation tests. They are described in detail in the next two sections.
Group‐based analysis
This first set of results describes how atrophy increased across patient groups (low, mid, and high) compared to controls. This analysis was applied separately to each left or right substructure and progressively added groups with higher CAP scores. Consider, for example, the analysis of the left caudate. During the preprocessing phase, each subject's left caudate (controls and patients) was registered to the caudate template, resulting in the computation, at each vertex k of the template surface, and for each subject s, of a deformation marker J k(s) that measured how much expansion/atrophy at vertex k was measured in the registration of subject s to the template. Examples of such deformation markers are provided in Figure 2. The equations that follow also include group variables Y low(s), Ymid(s), Yhigh(s) equal to 1 if subject s belongs to groups low, mid, or high in this order, and to zero otherwise.
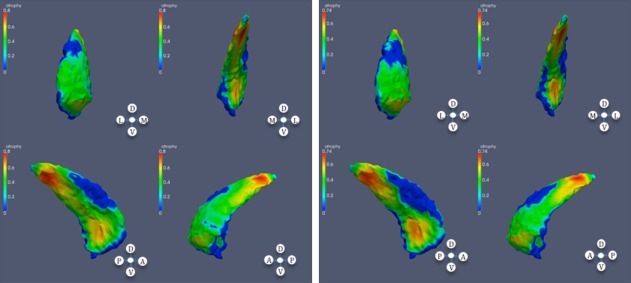
Figure 2.
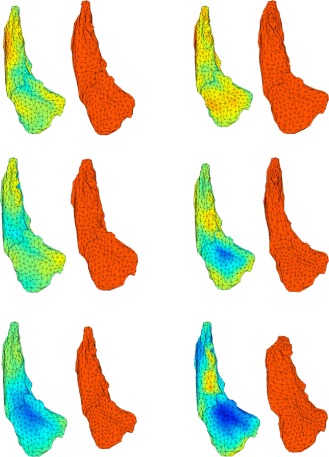
This figure displays six examples of deformation markers that were computed on our dataset. Original caudate surfaces are in red. The first two caudates are controls, followed by two examples from the mid group and two examples from the high group. Markers are aligned with the template shape (left shapes) and measure how much expansion (red) or atrophy (blue) is needed to deform the template into each of the observed caudates.
We progressively added groups in the model to measure the disease impact at different prodromal HD stages. Our first model only included controls and low CAP score group, and was given by (for each vertex k):
where the sum refers to covariates (which are gender, age, and logarithm of intracranial volume), and we tested for the null hypothesis βk,low = 0 simultaneously for all k. The second model added the mid CAP score group, taking the form
in which we tested for the null hypothesis βk,low = βk,mid = 0. Similarly, our third model added the high CAP score group,
with null hypothesis βk,low = βk,mid = βk,high = 0.
These models were studied separately, and P values were computed using permutation sampling. More precisely, we computed for all k the statistic
where RSS 0 is the residual sum of squares under the null hypothesis, and RSS is the sum of squares under the general hypothesis, and computed F * = maxk F k, the maximum value over all vertices. This maximum value was then compared to those obtained by performing the same computation a large number of times, with group labels randomly assigned to subjects, and the P value was given by the fraction of times the values of F* computed after permuting the labels was larger than the value obtained with the true groups. The P values that were observed via this procedure are provided, for each structure and the left and right sides of the brain, in Table 3. (Table 2 provides P values for the same model, also evaluated via permutations, in which J is replaced by the structure volume, for which no multiple‐testing procedure was required).
Table 3.
P values for shape difference between groups (controls vs. low, mid, and high CAP scores)
| Substructure | Low | Mid | High |
|---|---|---|---|
| Accumbens (Left) | 0.44 | 0.25 | 0.064 |
| Accumbens (Right) | 0.37 | 0.30 | 0.035 |
| Caudate (Left) | 0.91 | 0.025 | <0.0001 |
| Caudate (Right) | 0.08 | 0.14 | <0.0001 |
| Globus Pallidus (Left) | 0.02 | 0.001 | <0.0001 |
| Globus Pallidus (Right) | 0.0042 | 0.014 | <0.0001 |
| Hippocampus (Left) | 0.18 | 0.23 | 0.18 |
| Hippocampus (Right) | 0.64 | 0.74 | 0.23 |
| Putamen (Left) | 0.33 | <0.0001 | <0.0001 |
| Putamen (Right) | 0.011 | 0.018 | <0.0001 |
| Thalamus (Left) | 0.13 | 0.59 | 0.17 |
| Thalamus (Right) | 0.50 | 0.66 | 0.04 |
P values were computed using rank‐based regression (“Rank‐Based Regression” section), separately for each subvolume.
Table 2.
P values for volume difference between groups (controls vs. low, mid, and high CAP scores)
| Substructure | Low | Mid | High |
|---|---|---|---|
| Accumbens (Left) | 0.01 | 0.09 | 0.025 |
| Accumbens (Right) | 0.11 | 0.40 | 0.18 |
| Caudate (Left) | 0.62 | 0.039 | <0.0001 |
| Caudate (Right) | 0.55 | 0.10 | <0.0001 |
| Globus Pallidus (Left) | 0.05 | 0.0003 | <0.0001 |
| Globus Pallidus (Right) | 0.002 | 0.0003 | <0.0001 |
| Hippocampus (Left) | 0.77 | 0.82 | 0.58 |
| Hippocampus (Right) | 0.32 | 0.62 | 0.30 |
| Putamen (Left) | 0.57 | 0.0007 | <0.0001 |
| Putamen (Right) | 0.41 | 0.037 | <0.0001 |
| Thalamus (Left) | 0.60 | 0.51 | 0.23 |
| Thalamus (Right) | 0.79 | 0.90 | 0.67 |
P values are computed separately for each subvolume based on the model described in “Group‐Based Analysis” section.
Moderately significant P values (between 0.001 and 0.05) are shown in italic, and highly significant P values (less than 0.001) are shown in boldface.
This permutation testing procedure also provided a (conservative) estimate of the set of vertices k on which the null hypothesis was not valid. This set can indeed be defined by
where q* is the 95 percentile of the observed value of F* over the permutations [Nichols and Hayasaka, 2003]. Figures 3, 4, 5, 6, 3, 4, 5, 6 provide an illustration of these results by coloring the vertices that were significant with an atrophy measure defined as minus the sum of the β coefficients associated to the considered groups.
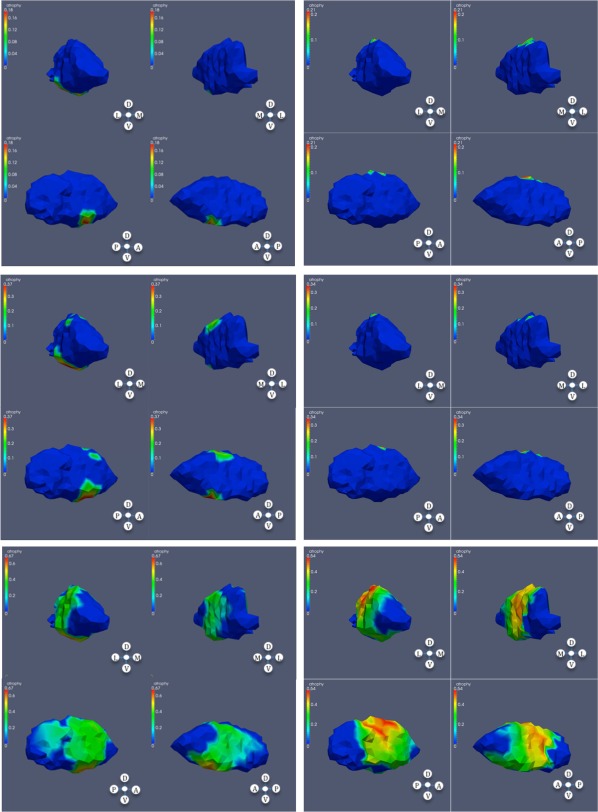
Figure 3.
Significant atrophy in caudate (high CAP score); each panel contains anterior, posterior, lateral, and medial views in this order; left: left caudate; right: right caudate.
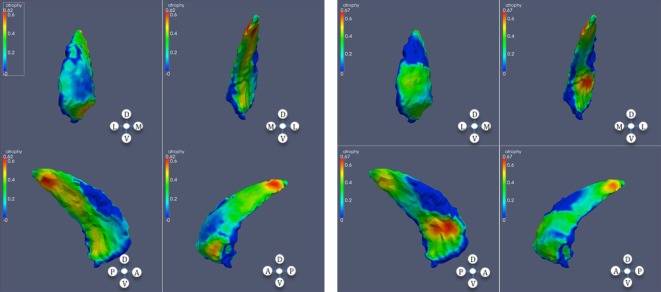
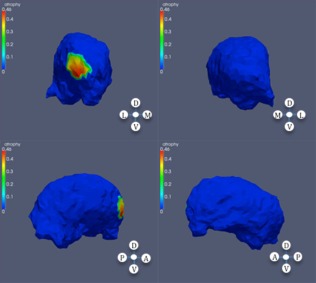
Figure 4.
Significant atrophy in globus pallidus. From top to bottom: low, mid, and high CAP scores; left: left globus; right: right globus.
Figure 5.
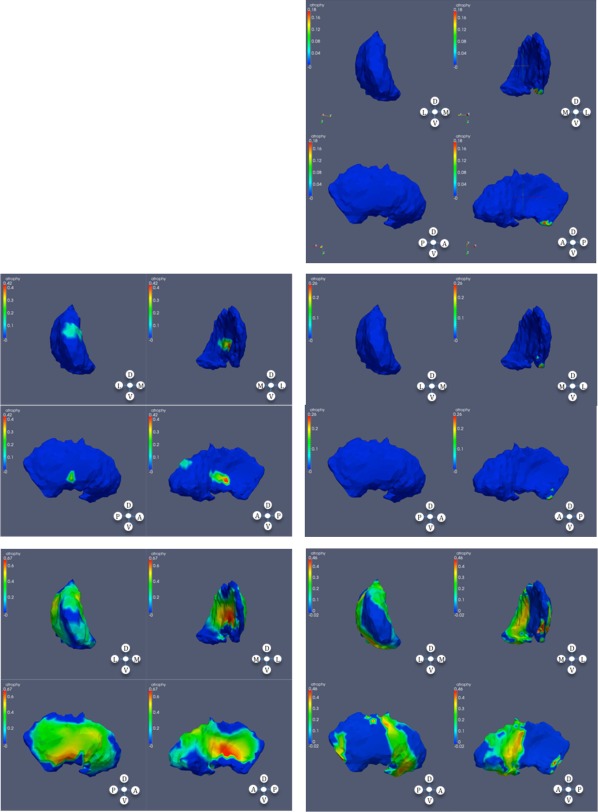
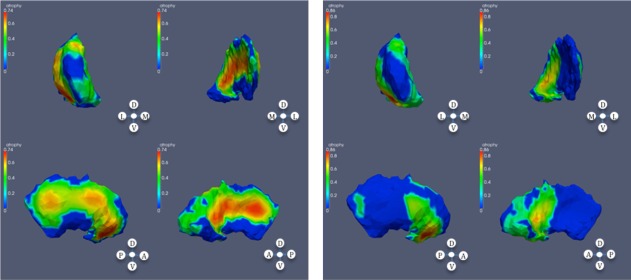
Significant atrophy in putamen. From top to bottom: low (right), mid, and high CAP scores; left: left putamen; right: right putamen.
Figure 6.
Significance regions in right thalamus, high CAP score.
Rank‐based regression
We also considered a model in which atrophy was predicted by the rank of each patient in terms of CAP scores (this evaluation being restricted to prodromal HD patients, because the CAP score was not defined for controls). In this setting, each patient, s, was attributed a rank r(s) between 1 and 60 according to their score. We then fitted a linear model
and tested for the null hypothesis βk = 0 using permutation tests similar to the previous section. Results are provided in Table 4, and Figures 7, 8, 9, 10, 7, 8, 9, 10.
Table 4.
P values for rank‐based prediction of atrophy based on volume only
| Subvolume | P |
|---|---|
| Accumbens (Left) | 0.049 |
| Accumbens (Right) | 0.012 |
| Caudate (Left) | <0.0001 |
| Caudate (Right) | <0.0001 |
| Globus Pallidus (Left) | <0.0001 |
| Globus Pallidus (Right) | <0.0001 |
| Hippocampus (Left) | 0.12 |
| Hippocampus (Right) | 0.02 |
| Putamen (Left) | <0.0001 |
| Putamen (Right) | <0.0001 |
| Thalamus (Left) | 0.08 |
| Thalamus (Right) | 0.002 |
Figure 7.
Significant atrophy in caudate based on CAP ranks; left: left caudate; right: right caudate.
Figure 8.
Significant atrophy in globus pallidus based on CAP ranks; left: left globus; right: right globus.
Figure 9.
Significant atrophy in putamen based on CAP ranks; left: left putamen; right: right putamen.
Figure 10.
Significant atrophy in right thalamus based on CAP ranks.
RESULTS
These results are summarized by tables of P values (Tables 2–4), and by figures that describe regions of significant atrophy on each subvolume.
Table 2 provides P values for significant volume difference between the populations as described in “Group‐Based Analysis” section. Table 3 provides P values for SBM shape difference between the populations, still along the lines of “Group‐Based Analysis” section. Table 4 provides corrected P values obtained using rank‐based regression as described in “Rank‐Based Regression” section. P values that are close to 5% in these tables should be taken with care, since we are not correcting for multiple comparison across structures. They will have to be confirmed in future studies.
The first remark that can be made is that the three tables are largely in agreement regarding which structures are affected or not. The only difference is with the right thalamus, for which a mild significance is detected by the SBM analysis in the high group, whereas such a difference was not detectable based on volume. This might be due to the fact that only a small region of the thalamus is found to be affected, inducing a limited volume difference (relative to normal population variation).
The agreement between these three tests can be understood by the fact that shape differences in HD are always caused by volume reduction, which makes them detectable by a test based on volume, but also seem to concentrate on consistent locations on surfaces, which makes them detectable by SBM.
At the global level, the P values displayed in Tables 2–4 indicate higher significance in caudate, globus pallidus, and putamen. Some weak difference (P ∼0.05) is detected in the accumbens and in the thalamus, and no significant atrophy is measured in the hippocampus.
The effects are highly significant within the “high” groups, with several P values below the detectable threshold of 10− 4(this threshold being due to the maximal number of permutations run in our permutations tests, which is 40,000). A still notable significant effect can be observed in the “mid” group (left caudate, globus pallidus, and putamen), and in the “low” group (globus pallidus and right putamen), although P values get closer to 5% for these groups.
In addition to global‐level significance, SBM identifies regions of consistent shape differences in each structure. These regions are visualized in Figures 3, 4, 5, 6, 3, 4, 5, 6 for the groupwise analysis and in Figures 7, 8, 9, 10, 7, 8, 9, 10 for the rank‐based correlation. In these figures, we only display groups and volumes for which some significant atrophy has been measured.
These figures highlight vertices on the surfaces of the templates at which significant atrophy has been measured by our tests. Color corresponds to the differential amount of atrophy in the considered group(s), i.e., the (sum of) coefficients β in the linear model that correspond to groups or ranks.
In the striatum, and in subjects with high CAP score, a considerable area of the caudate is affected, with sparing of dorsolateral and dorsomedial regions of the mid‐body bilaterally. In the putamen, in the subjects with mid CAP score, shape differences appear at the anterior dorsomedial left putamen. In subjects with high CAP score, much of the putamen is affected with some sparing of the most rostral putamen. The nucleus accumbens was relatively less affected.
The method additionally showed specificity in that the hippocampus was almost entirely spared until very close to predicted motor onset. Similarly, the thalamus showed some variation, but compared with striatum, was relatively spared.
The statistical shape analysis revealed significant differences within the globus pallidus already in subjects with low CAP score.
DISCUSSION
In this study, we used statistical shape analysis to define subregional atrophy in subcortical gray matter in HD. We describe the changes as “atrophy,” because both PREDICT‐HD and TRACK_HD cross‐sectional data show that individuals very far from onset have essentially normal regional brain volumes (with the proviso that there may be very subtle developmental differences, e.g., Lee et al., 2012; Nopoulos et al., 2011, in HD brain development), and longitudinal data from both studies show consistent atrophy in many brain regions during the period addressed in the current study. We find that the method is capable of detecting differences even in small groups of research subjects far from predicted motor onset of diagnosable HD. Like volumetric measures, statistical shape analysis detects greater differences in the striatum than in other structures. However, the subregions of striatum most affected can now be better defined. In addition, statistical shape analysis (based on both volume and morphometry) indicates that there are early differences in globus pallidus in subjects predicted to be far from motorically manifest HD. The method is likely to have applicability as a biomarker of brain atrophy in the prodromal HD period. In future studies, with larger numbers of patients, and including diffusion tensor imaging (DTI), it could help better define the exact circuitry affected in this disorder.
There are some limitations in the study. The number of subjects is relatively small, especially when P values are computed, as done here, using familywise error rates (which present the advantage of not requiring any additional assumption on the data, like independence or positive regression dependence). To see how larger samples can improve the previous results, we can apply the following power analysis. Based on an estimate of 8.0 for the cut off value of the F‐test corrected for multiple comparisons on our surfaces (the exact value varies between 6.5 and 8.9 on our experiments, depending on the considered structure), we can estimate that when comparing two groups with, say, 90 subjects each, we will be able to detect group difference at a 5% level, and with a power larger than 80%, provided that there exists a point in the structure such that the ratio μ/σ is larger than 0.4, where μ is the difference between the group averages of the atrophy coefficient (interpreted as a surface area reduction in log scale) at this point and σ is the standard deviation of this atrophy coefficient at this point (Both μ and σ being corrected for covariates, age, cranial volume and gender.) Taking σ ≈ 0.1 (as observed in our dataset), we can therefore expect that the shape analysis will be able to detect variation of order 4% or more in the atrophy coefficients. This discussion also applies to group difference resulting from treatment trials.
The analysis also suffers from the relatively low resolution of the data, compared to the size of the structures, especially the accumbens. Also, the tail of the caudate is not visualized well in this analysis. The study is cross‐sectional in design only. As a multicenter study, it has the advantage of studying subjects from a large area, but this may increase random variation due to scanners at multiple sites. Any study of shape has the limitation that it is difficult to correlate differences in the exterior shape of an anatomic structure with loss of neurons or other atrophic processes within the structure.
The results of the study overall are in good accord with previous volumetric studies, in that the most significant and earliest group differences were in the striatum, with greater striatal deformation closer to predicted motor onset, as shown either when the subjects were divided into three groups (based on CAG age product, which correlates highly with estimated years to motor onset), or when this index was used as a continuous variable. The statistical shape analysis, in addition, revealed heterogeneity within the striatum, as described in the Results section. This corresponds quite well to previous observations of a gradient of pathology within the striatum [Vonsattel et al., 1985]. The nucleus accumbens and ventral striatum are relatively spared in neuropathologic studies, comparable to our statistical shape analysis [Ferrante et al., 1986].
A recent shape analysis of a subset of prodromal and HD affected subjects in the TRACK‐HD study [van den Bogaard et al., 2011] found small areas of deviation from the norm in the prodromal HD subjects, with very few areas of shrinkage in the far from onset group and a few scattered areas in the medial portion of the body of the caudate and putamen, and also the pallidum, in the close to onset group. These results do not correspond well to those in our study, but it is difficult to compare, as the methods are quite different; both methods use distinct registration algorithms. Shape markers in van den Bogaard et al. 2011 are based on absolute displacement relative to a healthy population template, whereas we locally evaluate surface atrophy relative to an average computed from the global population. The use of LDDMM in our study might have conferred increased sensitivity. Finally, the statistical models differ, although both are validated via permutation testing.
Our pallidal results are consistent with the older pathologic literature [Albin, Reiner et al. (1990); Deng et al., 2004; Reiner et al., 1988; Richfield and Herkenham, 1994; Richfield et al., 1995; Sapp et al., 1995], as well as MRI results from TRACK‐HD and PREDICT‐HD [Aylward et al., 2011; van den Bogaard et al., 2011].
Striatal medium spiny projection neurons are subdivided into subpopulations based on neuropeptide expression and downstream projection targets. Different populations of medium spiny neurons project to the external segment of the globus pallidus (GPe) and the internal segment of globus pallidus (GPi), and striato‐GPe neurons degenerate prior to striato‐GPi neurons [Albin et al., 1990a; Deng et al., 2004; Reiner et al., 1988; Richfield and Herkenham, 1994; Richfield et al., 1995; Sapp et al., 1995]. Preferential loss of striato‐GPe terminals has been documented in prior case reports of prodromal HD subjects [Albin, Young et al., 1990, 1992]. The globus pallidus is a relatively neuron‐poor structure with many striatal afferent terminals and fibers of passage. It is plausible that the pallidal shape differences described here reflect loss of striatal afferent terminals. The pattern of pallidal shape difference found in the subjects with high CAP score (Fig. 4, third panel) suggests relatively sparing of portions of the medial globus pallidus, a result consistent with the pathologic results indicating preferential loss of striato‐GPe afferent terminals. Our pallidal shape results are consistent also with the recent MRI study of [Douaud et al., 2009] who studied integrity of white matter tracts in a small number of manifest HD subjects. This group reports results consistent with substantial loss of putaminal–pallidal projections.
The observations of basal ganglia atrophy with heterogeneous distribution raise the possibility that statistical shape analysis could be used to help define in more detail the neural circuitry affected in HD. Previous studies have used DTI in order to define potential circuitry [Douaud et al., 2009]. No DTI scans were available from our subjects. However, one can begin to make correlations based on the regional heterogeneity of atrophy seen in the study, and a presumed role of corticostriatal circuitry in degeneration. Previous studies of cortical gray matter [Nopoulos et al., 2010; Rosas et al., 2008] have indicated that cortical gray matter atrophy begins earliest in occipital, parietal, superior temporal, and dorsolateral frontal cortices. Corticostriatal projection anatomy has a complex topology, including elements of somatotopic organization, projections from cortical fields in rostral‐caudal parasagittal zones, and some convergence of projections from anatomically separate but functionally related cortical regions [Haber and Knutson, 2009; Kemp and Powell, 1970; Selemon and Goldman‐Rakic, 1985; Yeterian and Van Hoesen, 1978].
Our observed pattern of striatal shape deformations appears to overlap partly with the pattern of abnormal deviations in the cortex. For example, Nopoulos et al. 2010 found relative sparing of ventromedial and orbitofrontal frontal cortices, which would correlate with relative lack of shape variation in the nucleus accumbens and ventral caudate‐putamen, and early differences in occipital and parietal cortical volumes in subjects approximately comparable to our mid CAP score subjects, which could correlate with shape differences seen in left caudal dorsolateral caudate [Cavada and Goldman‐Rakic, 1991; Yeterian and Pandya, 1995, 1993].
However, other changes in basal ganglia do not correspond well with changes in cortex. Nopoulos et al. 2010 describe also the presence of dorsolateral frontal cortex atrophy. A correlated deviation in striatal shape is predicted to manifest in dorsomedial caudate [Haber and Knutson, 2009; Kemp and Powell, 1970; Selemon and Goldman‐Rakic, 1985], which is not seen. Similarly, Nopoulos et al. 2010 find significant atrophy of primary sensorimotor cortex in subjects similar to our high CAP score subjects. If cortical volume decrement and striatal shape deformations were correlated closely [Kemp and Powell, 1970; Kunzle, 1975, 1977; Selemon and Goldman‐Rakic, 1985], the more rostral dorsolateral and dorsomedial caudate would exhibit a difference in shape, which is not the case. It maybe that some correlated deviations are not visualized in our analysis, as occipital and parietal cortices project heavily to the relatively small tail of the caudate, which is not measurable in our analysis.
Thus, while it is possible that striatal atrophy is secondary or concurrent with cortical atrophy, it is also possible that the two processes proceed relatively independently. This would be consistent with recent studies showing substantial white matter atrophy in many regions of the brain, not just in regions subjacent to those of cortical gray matter loss [Stoffers et al., 2010]. This point may be relevant to understanding the mechanisms of pathogenesis of striatal neurodegeneration in HD and potential therapies. One proposed family of mechanisms of neurodegeneration are “cell nonautonomous” sequences in which corticostriate neuron dysfunction or death leads to striatal neuron dysfunction or death. For instance, there may be loss of trophic support because of deficient brain‐derived neurotrophic factor secretion by or transport to corticostriate terminals [Zuccato and Cattaneo, 2009]. Our finding of only partial congruence with patterns of cortical atrophy suggests a more complex picture in which both cell autonomous and nonautonomous mechanisms are involved. Plurality of mechanisms would be consistent with some experimental results in murine genetic models of HD [Brown et al., 2008; Gu et al., 2005]. Further studies examining cortical variations and striatal shape differences in parallel and in larger numbers of subjects would address this point.
This question of the involvement of circuitry in HD is an important one. If the degeneration in HD, like that of Alzheimer's and perhaps Parkinson's disease [Braak et al., 2003], starts in a very restricted location—for instance, the striatum—and then proceeds in a circuit‐based fashion, this would offer the hope that gene therapy (perhaps using viral vectors injected into these regions) or transplantation approaches could be effective at aborting the disease process before it spreads further in the brain. By contrast, if degeneration in HD is multifocal and does not proceed purely on the basis of neuronal circuitry, that would require much more widespread administration of gene therapeutic agents, or would favor systemic small molecule therapy, which would be able to penetrate more widely throughout the brain. Thus, statistical shape analysis, along with other structural and functional imaging studies in a larger number of subjects, especially with a longitudinal design, may help expand our understanding of the neurobiology of HD, and also guide the most effective strategies for intervention.
ACKNOWLEDGMENTS
The authors thank the PREDICT‐HD sites, the study participants, and the National Research Roster for Huntington Disease Patients and Families.
PREDICT‐HD Investigators, Coordinators, Motor Raters, Cognitive Raters
Thomas Wassink, MD, Stephen Cross, BA, Mycah Kimble, BA, Patricia Ryan, MSW, LISW, MA, and Eric A. Epping, MD, PhD (University of Iowa, Iowa City, Iowa, USA); Edmond Chiu, MD, Olga Yastrubetskaya, PhD, Joy Preston, Anita Goh, D.Psych, Stephanie Antonopoulos and Samantha Loi (St. Vincent's Hospital, The University of Melbourne, Kew, Victoria, Australia); Phyllis Chua, MD, and Angela Komiti, BS, MA (The University of Melbourne, Royal Melbourne Hospital, Melbourne, Australia); Lynn Raymond, MD, PhD, and Joji Decolongon, MSC, CCRP (University of British Columbia, Vancouver, British Columbia, Canada); Christopher A. Ross, MD, PhD, Mark Varvaris, BA, and William M. Mallonee, MD, and Greg Suter, BA (Hereditary Neurological Disease Centre, Wichita, Kansas, USA); Ali Samii, MD, and Alma Macaraeg, BS (University of Washington and VA Puget Sound Health Care System, Seattle, Washington, USA); Randi Jones, PhD, Cathy Wood‐Siverio, MS, Stewart A. Factor, DO, and Claudia Testa, MD, PhD (Emory University School of Medicine, Atlanta, Georgia, USA); Roger A. Barker, BA, MBBS, MRCP, and Sarah Mason, BSC (Cambridge Centre for Brain Repair, Cambridge, UK); Elizabeth McCusker, MD, Jane Griffith, RN, Clement Loy, MD, and David Gunn, BS (Westmead Hospital, Sydney, Australia); Michael Orth MD, PhD, Sigurd Süβmuth, MD, RN, Katrin Barth, RN, and Sonja Trautmann, RN (University of Ulm, Ulm, Germany); Kimberly Quaid, PhD, Melissa Wesson, MS, and Joanne Wojcieszek, MD (Indiana University School of Medicine, Indianapolis, IN); Mark Guttman, MD, Alanna Sheinberg, BA, and Irita Karmalkar, BSc (Centre for Addiction and Mental Health, University of Toronto, Markham, Ontario, Canada); Susan Perlman, MD, and Brian Clemente, (Los Angeles Medical Center, Los Angeles, California, USA); Michael D. Geschwind, MD, PhD, and Gail Kang, MD (University of California San Francisco, California, USA); Gabriela Satris, BA, Tom Warner, MD, PhD, Maggie Burrows, RN, BA (National Hospital for Neurology and Neurosurgery, London, UK); Anne Rosser, MD, PhD, MRCP, Kathy Price, RN, and Sarah Hunt, BSc (Cardiff University, Cardiff, Wales, UK); Frederick Marshall, MD, Amy Chesire, LCSW‐R, MSG, Mary Wodarski, BA, and Charlyne Hickey, RN, MS (University of Rochester, Rochester, New York, USA); Peter Panegyres, MB, BS, PhD, Joseph Lee, and Steve Andrew (Neurosciences Unit, Graylands, Selby‐Lemnos & Special Care Health Services, Perth, Australia); Joel Perlmutter, MD, Stacey Barton, MSW, LCSW, and Amy Schmidt (Washington University, St. Louis, Missouri, USA); Zosia Miedzybrodzka, MD, PhD, Daniela Rae, RN, and Mariella D'Alessandro, PhD (Clinical Genetics Centre, Aberdeen, Scotland, UK); David Craufurd, MD, Judith Bek, PhD, and Elizabeth Howard, MD (University of Manchester, Manchester, UK); Pietro Mazzoni, MD, PhD, Karen Marder, MD, MPH, and Paula Wasserman, MA (Columbia University Medical Center, New York, New York, USA); Rajeev Kumar, MD and Diane Erickson, RN (Colorado Neurological Institute, Englewood, Colorado, USA); Vicki Wheelock, MD, Terry Tempkin, RNC, MSN, and Lisa Kjer, MSW (University of California Davis, Sacramento, California, USA); Wayne Martin, MD, Pamela King, BScN, RN, Marguerite Wieler and Satwinder Sran, BSC (University of Alberta, Edmonton, Alberta, Canada); Oksana Suchowersky, MD, FRCPC, Anwar Ahmed, PhD, Stephen Rao, PhD, Christine Reece, BS, Alex Bura, BA, Lyla Mourany, and Juliet Schulz (Cleveland Clinic Foundation, Cleveland, Ohio, USA). Executive Committee—Jane Paulsen, PhD, Principal Investigator, Eric A. Epping, MD, PhD, Hans Johnson, PhD, Megan Smith, PhD, Jeffrey D. Long, PhD, (University of Iowa, Iowa City, IA); Elizabeth Aylward, PhD (Seattle Children's Research Institute, WA); Kelsey Montross, BA, Jeremy Bockholt, BS, MS, Steve Blanchard, MSHA. Scientific Consultants—Bio Markers: Ken Evans, PhD (Ontario Cancer Biomarker Network); Wayne Matson, PhD (VA Medical Center, Bedford, MA); Asa Peterson, MD, PhD (Lund University, Sweden); James A. Mills, MS (University of Iowa). Brain: Jean Paul Vonsattel, PhD (Chair), and Carol Moskowitz, ANP, MS (Columbia University Medical Center); Stacie Vik, BA (University of Iowa). Cognitive: Deborah Harrington, PhD (Chair), Gabriel Castillo, BS, Jessica Morison, BS, and Jason Reed, BS (University of California, San Diego), Michael Diaz, PhD, Ian Dobbins, PhD, Tamara Hershey, PhD, Erin Foster, OTD, and Deborah Moore, BA (Washington University Cognitive Science Battery Development); Holly Westervelt, PhD (Chair, Quality Control and Training, Alpert Medical School of Brown University), Jennifer Davis, PhD, and Geoff Tremont, PhD, MS (Scientific Consultants, Alpert Medical School of Brown University); Megan Smith, PhD (Chair, Administration), David J. Moser, PhD (University of Iowa); Carissa Gehl, PhD (VA Medical Center, Iowa City, IA); Kirsty Matheson (University of Aberdeen); Karen Siedlecki, PhD (Fordham University); Marleen Van Walsem (EHDN); Greg Elias, BA, Mary Gover, and Rachel Bernier, (Rhode Island Hospital); Noelle Carlozzi (University of Michigan); Kevin Duff, PhD (University of Utah); Nellie Georgiou‐Karistianis (St. Vincent's Hospital, The University of Melbourne, Australia); and Kate Papp (University of Connecticut). Functional: Janet Williams, PhD Eunyoe Ro, MA, Lee Anna Clark, Nancy Downing, RN, PhD, Michelle Harreld, BS, and Stacie Vik, BA (University of Iowa); Rebecca Ready, PhD (University of Massachusetts); Anthony Vaccarino, PhD (Ontario Cancer Biomarker Network); Sarah Farias, PhD (University of California, Davis); Noelle Carlozzi, PhD (University of Michigan); and Carissa Gehl, PhD (VA Medical Center, Iowa City, IA). Genetics: Marcy MacDonald, PhD Jim Gusella, PhD, and Rick Myers, PhD (Massachusetts General Hospital); Tom Wassink, MD (Co‐Chair) Eric A. Epping, MD, PhD, and James Mills, MS, (University of Iowa); Zosia Miedzybrodzka, MD, PhD (University of Aberdeen); and Christopher Ross, MD, PhD (Johns Hopkins University). Imaging: Administrative: Kathy Jones, BS, Jacquie Marietta, BS, Greg Harris, BS, Eun Young Kim, MS, Hans Johnson, PhD, Greg Ennis, MA, and Thomas Wassink, MD (University of Iowa); John Ashburner, PhD (Functional Imaging Lab, London); Steve Potkin, MD (University of California, Irvine); and Arthur Toga, PhD (University of California, Los Angeles). Striatal: Elizabeth Aylward, PhD (Chair, Seattle Children's Research Institute). Surface Analysis: Eric Axelson, BSE (University of Iowa). Shape Analysis: Christopher A. Ross (Chair), MD, PhD, Michael Miller, PhD, and Sarah Reading, MD (Johns Hopkins University); Mirza Faisal Beg, PhD (Simon Fraser University). DTI: Vincent A. Magnotta, PhD (Chair, University of Iowa); Karl Helmer, PhD (Massachusetts General Hospital); Kelvin Lim, MD (University of Ulm, Germany); Mark Lowe, PhD (Cleveland Clinic); Sasumu Mori, PhD (Johns Hopkins University); Allen Song, PhD (Duke University); and Jessica Turner, PhD (University of California, Irvine). fMRI: Steve Rao, PhD (Chair), Erik Beall, PhD, Katherine Koenig, PhD, Michael Phillips, MD, Christine Reece, BS, and Jan Zimbelman, PhD, PT (Cleveland Clinic); Kathy Jones, (University of Iowa). Psychiatric: Eric A. Epping, MD, PhD (Chair), Nancy Downing, RN, PhD, Jess Fiedorowicz, MD, Robert Robinson, MD, Megan Smith, PhD, Leigh Beglinger, PhD, James Mills, MS, Michelle Harreld, BS, Stacie Vik, BA, Janet Williams, PhD, Dawei Liu, PhD, David Moser, PhD, and Kelly Rowe (University of Iowa); Karen Anderson, MD (University of Maryland); David Craufurd, MD (University of Manchester); Mark Groves, MD (Columbia University); Anthony Vaccarino, PhD and Ken Evans, PhD (Ontario Cancer Biomarker Network); Hugh Rickards, MD (Queen Elizabeth Psychiatric Hospital); Eric van Duijn, MD (Leiden University Medical Center, Netherlands). Core Sections—Biostatistics: Jeffrey D. Long, PhD, Ji‐In Kim, PhD, James A. Mills, MS, Ying Zhang, PhD, Dawei Liu, PhD, Wenjing Lu, Craig Stout, and Spencer Lourens (University of Iowa). Recruitment/Retention: Martha Nance, MD (Chair, University of Minnesota); Mycah Kimble, BA, Patricia Ryan, MSW, LISW, MA, Sean Thompson, BA (University of Iowa). Ethics: Cheryl Erwin, JD, PhD, (Chair, McGovern Center for Health, Humanities and the Human Spirit); Eric A. Epping, MD, PhD Janet Williams, PhD, James Mills, MS, and Stacie Vik, BA (University of Iowa); Martha Nance, MD (University of Minnesota); and Lisa Hughes, MEd (University of Texas Medical School at Houston). IT/Management: Jeremy Bockholt, Jim Smith, AS, Roland Zschiegner, Ryan Wyse, Owen Wade, Jason Evans, and Derek Weston (University of Iowa). Program Management—Administrative: Chris Werling‐Witkoske (Chair), Greg Ennis, MA, Stacie Vik, BA, Karla Anderson, BS, Brittany Lichty, BA, and Leann Davis (University of Iowa). Financial: Steve Blanchard, MSHA, Kelsey Montross, BA, and Phil Danzer (University of Iowa).
REFERENCES
- Albin RL, Reiner A, Anderson KD, Dure LSt, Handelin B, Balfour R, Whetsell WO Jr, Penney JB, Young AB (1992): Preferential loss of striato‐external pallidal projection neurons in presymptomatic Huntington's disease. Ann Neurol 31:425–430. [DOI] [PubMed] [Google Scholar]
- Albin RL, Reiner A, Anderson KD, Penney JB, Young AB (1990): Striatal and nigral neuron subpopulations in rigid Huntington's disease: Implications for the functional anatomy of chorea and rigidity‐akinesia. Ann Neurol 27:357–365. [DOI] [PubMed] [Google Scholar]
- Albin RL, Young AB, Penney JB (1989): The functional anatomy of basal ganglia disorders. Trends Neurosci 12:366–375. [DOI] [PubMed] [Google Scholar]
- Albin RL, Young AB, Penney JB, Handelin B, Balfour R, Anderson KD, Markel DS, Tourtellotte WW, Reiner A (1990): Abnormalities of striatal projection neurons and N‐methyl‐D‐aspartate receptors in presymptomatic Huntington's disease. N Engl J Med 322:1293–1298. [DOI] [PubMed] [Google Scholar]
- Alexander G, DeLong M, Strick P (1986): I. Parallel organization of cuntionally segregated circuits linking basal ganglia and cortex. Annu Rev Neurosci 9:357–381. [DOI] [PubMed] [Google Scholar]
- Ashburner J, Csernansky JG, Davatzikos C, Fox NC, Frisoni GB, Thompson PM (2003): Computer‐assisted imaging to assess brain structure in healthy and diseased brains. Lancet Neurol 2:79–88. [DOI] [PubMed] [Google Scholar]
- Aylward EH, Nopoulos PC, Ross CA, Langbehn DR, Pierson RK, Mills JA, Johnson HJ, Magnotta VA, Juhl AR, Paulsen JS (2011): Longitudinal change in regional brain volumes in prodromal Huntington disease. J Neurol Neurosurg Psychiatry 82:405–410. [DOI] [PMC free article] [PubMed] [Google Scholar]
- Aylward EH, Sparks BF, Field KM, Yallapragada V, Shpritz BD, Rosenblatt A, Brandt J, Gourley LM, Liang K, Zhou H, Margolis RL, Ross CA (2004): Onset and rate of striatal atrophy in preclinical Huntington disease. Neurology 63:66–72. [DOI] [PubMed] [Google Scholar]
- Braak H, Del Tredici K, Rub U, de Vos RA, Jansen Steur EN, Braak E (2003): Staging of brain pathology related to sporadic Parkinson's disease. Neurobiol Aging 24:197–211. [DOI] [PubMed] [Google Scholar]
- Brown TB, Bogush AI, Ehrlich ME (2008): Neocortical expression of mutant huntingtin is not required for alterations in striatal gene expression or motor dysfunction in a transgenic mouse. Hum Mol Genet 17:3095–3104. [DOI] [PMC free article] [PubMed] [Google Scholar]
- Cavada C, Goldman‐Rakic PS (1991): Topographic segregation of corticostriatal projections from posterior parietal subdivisions in the macaque monkey. Neuroscience 42:683–696. [DOI] [PubMed] [Google Scholar]
- Csernansky JG, Joshi S, Wang L, Haller JW, Gado M, Miller JP, Grenander U, Miller MI (1998): Hippocampal morphometry in schizophrenia by high dimensional brain mapping. Proc Natl Acad Sci USA 95:11406–11411. [DOI] [PMC free article] [PubMed] [Google Scholar]
- Csernansky JG, Wang L, Jones D, Rastogi‐Cruz D, Posener JA, Heydebrand G, Miller JP, Miller MI (2002): Hippocampal deformities in schizophrenia characterized by high dimensional brain mapping. Am J Psychiat 159:2000–2006. [DOI] [PubMed] [Google Scholar]
- Csernansky JG, Wang L, Joshi S, Miller JP, Gado M, Kido D, McKeel D, Morris JC, Miller MI (2000): Early DAT is distinguished from aging by high‐dimensional mapping of the hippocampus. Neurology 55:1636–1643. [DOI] [PubMed] [Google Scholar]
- Cudkowicz M, Kowall NW (1990): Degeneration of pyramidal projection neurons in Huntingtons‐disease cortex. Ann Neurol 27:200–204. [DOI] [PubMed] [Google Scholar]
- de la Monte SM, Vonsattel JP, Richardson EP Jr (1988): Morphometric demonstration of atrophic changes in the cerebral cortex, white matter, and neostriatum in Huntington's disease. J Neuropathol Exp Neurol 47:516–525. [DOI] [PubMed] [Google Scholar]
- Deng Y, Albin R, Penney J, Young A, Anderson K, Reiner A (2004): Differential loss of striatal projection systems in Huntington's disease: A quantitative immunohistochemical study. J Chem Neuroanat 27:143–164. [DOI] [PubMed] [Google Scholar]
- Douaud G, Behrens TE, Poupon C, Cointepas Y, Jbabdi S, Gaura V, Golestani N, Krystkowiak P, Verny C, Damier P, Bachoud‐Levi AC, Hantraye P, Remy P (2009): In vivo evidence for the selective subcortical degeneration in Huntington's disease. NeuroImage 46:958–966. [DOI] [PubMed] [Google Scholar]
- Douaud G, Gaura V, Ribeiro MJ, Lethimonnier F, Maroy R, Verny C, Krystkowiak P, Damier P, Bachoud‐Levi AC, Hantraye P, Remy P (2006): Distribution of grey matter atrophy in Huntington's disease patients: A combined ROI‐based and voxel‐based morphometric study. NeuroImage 32:1562–1575. [DOI] [PubMed] [Google Scholar]
- Fennema‐Notestine C, Archibald SL, Jacobson MW, Corey‐Bloom J, Paulsen JS, Peavy GM, Gamst AC, Hamilton JM, Salmon DP, Jernigan TL (2004): In vivo evidence of cerebellar atrophy and cerebral white matter loss in Huntington disease. Neurology 63:989–995. [DOI] [PubMed] [Google Scholar]
- Ferrante R, Beal MF, Kowall NW, Richardson EP Jr, Martin JB (1987a): Sparing of acetylcholinesterase‐containing striatal neurons in Huntington's disease Brain Res 411:162–166. [DOI] [PubMed] [Google Scholar]
- Ferrante RJ, Kowall NW, Beal MF, Richardson EP Jr, Bird ED, Martin JB (1985): Selective sparing of a class of striatal neurons in Huntington's disease. Science 230:561–563. [DOI] [PubMed] [Google Scholar]
- Ferrante RJ, Kowall NW, Richardson EP Jr, Bird ED, Martin JB (1986): Topography of enkephalin, substance P and acetylcholinesterase staining in Huntington's disease striatum. Neurosci Lett 71:283–288. [DOI] [PubMed] [Google Scholar]
- Ferrante RJ, Beal MF, Kowall NW, Richardson EP Jr, Martin JB (1987b): Morphologic and histochemical characteristics of a spared subset of striatal neurons in Huntington's disease. J Neuropathol Exp Neurol 46:12–27. [DOI] [PubMed] [Google Scholar]
- Grenander U, Miller MI (2007): Pattern Theory: From Representation to Inference. New York:Oxford University Press; xii, 596 p. [Google Scholar]
- Gu X, Li C, Wei W, Lo V, Gong S, Li SH, Iwasato T, Itohara S, Li XJ, Mody I, Heintz N, Yang XW (2005): Pathological cell‐cell interactions elicited by a neuropathogenic form of mutant Huntingtin contribute to cortical pathogenesis in HD mice. Neuron 46:433–444. [DOI] [PubMed] [Google Scholar]
- Haber SN, Knutson B (2009): The reward circuit: Linking primate anatomy and human imaging. Neuropsychopharmacology 35:4–26. [DOI] [PMC free article] [PubMed] [Google Scholar]
- Harper P, Lim C, Craufurd D (2000): Ten years of presymptomatic testing for Huntington's disease: The experience of the UK Huntington's disease Prediction Consortium. J Med Genet 37:567–571. [DOI] [PMC free article] [PubMed] [Google Scholar]
- HD Collaborative Group (1993): A novel gene containing a trinucleotide repeat that is expanded and unstable on Huntington's disease chromosomes. Cell 72:971–983. [DOI] [PubMed] [Google Scholar]
- Hedreen JC, Peyser CE, Folstein SE, Ross CA (1991): Neuronal loss in layers V and VI of cerebral cortex in Huntington's disease. Neurosci Lett 133:257–261. [DOI] [PubMed] [Google Scholar]
- Hobbs NZ, Henley SM, Ridgway GR, Wild EJ, Barker RA, Scahill RI, Barnes J, Fox NC, Tabrizi SJ (2010): The progression of regional atrophy in premanifest and early Huntington's disease: A longitudinal voxel‐based morphometry study. J Neurol Neurosurg Psychiatry 81:756–763. [DOI] [PubMed] [Google Scholar]
- Hobbs NZ, Henley SM, Wild EJ, Leung KK, Frost C, Barker RA, Scahill RI, Barnes J, Tabrizi SJ, Fox NC (2009): Automated quantification of caudate atrophy by local registration of serial MRI: Evaluation and application in Huntington's disease. NeuroImage 47:1659–1665. [DOI] [PubMed] [Google Scholar]
- Imarisio S, Carmichael J, Korolchuk V, Chen CW, Saiki S, Rose C, Krishna G, Davies JE, Ttofi E, Underwood BR, Rubinsztein DC (2008): Huntington's disease: From pathology and genetics to potential therapies. Biochem J 412:191–209. [DOI] [PubMed] [Google Scholar]
- Jernigan TL, Salmon DP, Butters N, Hesselink JR (1991): Cerebral Structure on Mri .2. Specific Changes in Alzheimers and Huntingtons Diseases. Biol Psychiat 29:68–81. [DOI] [PubMed] [Google Scholar]
- Jurgens CK, van de Wiel L, van Es AC, Grimbergen YM, Witjes‐Ane MN, van der Grond J, Middelkoop HA, Roos RA (2008): Basal ganglia volume and clinical correlates in ‘preclinical’ Huntington's disease. J Neurol 255:1785–1791. [DOI] [PubMed] [Google Scholar]
- Kemp J, Powell T (1970): The cortico‐striate projection in the monkey. Brain 93:525–546. [DOI] [PubMed] [Google Scholar]
- Kunzle H (1975): Bilateral projections from precentral motor cortex to the putamen and other parts of the basal ganglia. An autoradiographic study inMacaca fascicularis. Brain Res 88:195–209. [DOI] [PubMed] [Google Scholar]
- Kunzle H (1977): Projections from the primary somatosensory cortex to basal ganglia and thalamus in the monkey. Exp Brain Res 30:481–492. [DOI] [PubMed] [Google Scholar]
- Langbehn DR, Hayden MR, Paulsen JS (2010): CAG‐repeat length and the age of onset in Huntington disease (HD): A review and validation study of statistical approaches. Am J Med Genet B Neuropsychiatr Genet 153B:397–408. [DOI] [PMC free article] [PubMed] [Google Scholar]
- Lange H, Thörner G, Hopf A, Schröder K (1976): Morphometric studies of the neuropathological changes in choreatic diseases. J Neurol Sci 28:401–425. [DOI] [PubMed] [Google Scholar]
- Ma J, Miller M, Younes L (2010): A bayesian generative model for surface template estimation. Int J Biomed Imaging 2010:14. [DOI] [PMC free article] [PubMed] [Google Scholar]
- Marrakchi‐Kacem L, Delmaire C, Tucholka A, Roca P, Guevara P, Poupon F, Yelnik J, Durr A, Mangin JF, Lehericy S, Poupon C (2010): Analysis of the striato‐thalamo‐cortical connectivity on the cortical surface to infer biomarkers of Huntington's disease. Med Image Comput Comput Assist Interv 13:217–224. [DOI] [PubMed] [Google Scholar]
- Morrison P, Harding‐Lester S, Bradley A (2011): Uptake of Huntington disease predictive testing in a complete population. Clin Genet 80:281–286. [DOI] [PubMed] [Google Scholar]
- Mumford D, Desolneux A (2010): Pattern Theory: The Stochastic Analysis of Real‐world signals. Natick:A. K. Peters; 375 p. [Google Scholar]
- Nichols T, Hayasaka S (2003): Controlling the familywise error rate in functional neuroimaging: A comparative review. Stat Methods Med Res 12:419–446. [DOI] [PubMed] [Google Scholar]
- Nopoulos PC, Aylward EH, Ross CA, Johnson HJ, Magnotta VA, Juhl AR, Pierson RK, Mills J, Langbehn DR, Paulsen JS (2010): Cerebral cortex structure in prodromal Huntington disease. Neurobiol Dis 40:544–554. [DOI] [PMC free article] [PubMed] [Google Scholar]
- Lee JK, Mathews K, Schlaggar B, Perlmutter J, Paulsen JS, Epping E, Burmeister L, Nopoulos P (2012): Measures of growth in children at risk for Huntington disease. Neurology 79:668–674. [DOI] [PMC free article] [PubMed] [Google Scholar]
- Nopoulos PC, Aylward EH, Ross CA, Mills JA, Langbehn DR, Johnson HJ, Magnotta VA, Pierson RK, Beglinger LJ, Nance MA, Barker RA, Paulsen JS (2011): Smaller intracranial volume in prodromal Huntington's disease: Evidence for abnormal neurodevelopment. Brain 134:137–42. [DOI] [PMC free article] [PubMed] [Google Scholar]
- Paulsen JS, Magnotta VA, Mikos AE, Paulson HL, Penziner E, Andreasen NC, Nopoulos PC (2006): Brain structure in preclinical Huntington's disease. Biol Psychiatry 59:57–63. [DOI] [PubMed] [Google Scholar]
- Paulsen JS, Langbehn DR, Stout JC, Aylward E, Ross CA, Nance M, Guttman M, Johnson S, MacDonald M, Beglinger LJ, Duff K, Kayson E, Biglan K, Shoulson I, Oakes D, Hayden M (2008): Detection of Huntington's disease decades before diagnosis: The PREDICT‐HD study. J Neurol Neurosurg Psychiatry 79:874–880. [DOI] [PMC free article] [PubMed] [Google Scholar]
- Paulsen JS, Nopoulos PC, Aylward E, Ross CA, Johnson H, Magnotta VA, Juhl A, Pierson RK, Mills J, Langbehn D, Nance M (2010): Striatal and white matter predictors of estimated diagnosis for Huntington disease. Brain Res Bull 82:201–207. [DOI] [PMC free article] [PubMed] [Google Scholar]
- Paulson H, Albin R (2010): Huntington's disease: Clinical features and routes to therapy In: Lo D, Hughes R, editors. Neurobiology of Huntington's disease: applications to drug discovery, CRC press, Boca Raton (FL), Chapter 1. [Google Scholar]
- Pierson R, Johnson H, Harris G, Keefe H, Paulsen JS, Andreasen NC, Magnotta VA (2011): Fully automated analysis using BRAINS: AutoWorkup. NeuroImage 54:328–336. [DOI] [PMC free article] [PubMed] [Google Scholar]
- Qiu A, Adler M, Crocetti D, Miller MI, Mostofsky SH (2010): Basal ganglia shapes predict social, communication, and motor dysfunctions in boys with autism spectrum disorder. J Am Acad Child AdolescPsychiatry 49:539–551. [DOI] [PubMed] [Google Scholar]
- Qiu A, Crocetti D, Adler M, Mahone EM, Denckla MB, Miller MI, Mostofsky SH (2009a): Basal ganglia volume and shape in children with attention deficit hyperactivity disorder. Am J Psychiatry 166:74–82. [DOI] [PMC free article] [PubMed] [Google Scholar]
- Qiu A, Fennema‐Notestine C, Dale AM, Miller MI (2009b): Regional shape abnormalities in mild cognitive impairment and Alzheimer's disease. NeuroImage 45:656–661. [DOI] [PMC free article] [PubMed] [Google Scholar]
- Qiu A, Wang L, Younes L, Harms MP, Ratnanather JT, Miller MI, Csernansky JG (2009c): Neuroanatomical asymmetry patterns in individuals with schizophrenia and their non‐psychotic siblings. NeuroImage 47:1221–1229. [DOI] [PMC free article] [PubMed] [Google Scholar]
- Qiu A, Younes L, Miller MI, Csernansky JG (2008): Parallel transport in diffeomorphisms distinguishes the time‐dependent pattern of hippocampal surface deformation due to healthy aging and the dementia of the Alzheimer's type. NeuroImage 40:68–76. [DOI] [PMC free article] [PubMed] [Google Scholar]
- Qiu A, Younes L, Wang L, Ratnanather JT, Gillepsie SK, Kaplan G, Csernansky J, Miller MI (2007): Combining anatomical manifold information via diffeomorphic metric mappings for studying cortical thinning of the cingulate gyrus in schizophrenia. NeuroImage 37:821–833. [DOI] [PMC free article] [PubMed] [Google Scholar]
- Ranen NG, Stine OC, Abbott MH, Sherr M, Codori AM, Franz ML, Chao NI, Chung AS, Pleasant N, Callahan C, Kash LM, Ghaffari M, Chase GA, Kazazian HH, Brandt J, Folstein SE, Ross CA (1995): Anticipation and instability of IT‐15 (CAG)n repeats in parent‐offspring pairs with Huntington disease. Am J Hum Genet 57:593–602. [PMC free article] [PubMed] [Google Scholar]
- Rangarajan A, Chui H, Bookstein F (1997): The softassign procrustes matching algorithm.Springer; p29–42. [Google Scholar]
- Reiner A, Albin RL, Anderson KD, D'Amato CJ, Penney JB, Young AB (1988): Differential loss of striatal projection neurons in Huntington disease. Proc Natl Acad Sci USA 85:5733. [DOI] [PMC free article] [PubMed] [Google Scholar]
- Richfield EK, Herkenham M (1994): Selective vulnerability in Huntington's disease: Preferential loss of cannabinoid receptors in lateral globus pallidus. Ann Neurol 36:577–584. [DOI] [PubMed] [Google Scholar]
- Richfield EK, Maguire‐Zeiss KA, Vonkeman HE, Voorn P (1995): Preferential loss of preproenkephalin versus preprotachykinin neurons from the striatum of Huntington's disease patients. Ann Neurol 38:852–861. [DOI] [PubMed] [Google Scholar]
- Rosas HD, Salat DH, Lee SY, Zaleta AK, Pappu V, Fischl B, Greve D, Hevelone N, Hersch SM (2008): Cerebral cortex and the clinical expression of Huntington's disease: Complexity and heterogeneity. Brain 131:1057–1068. [DOI] [PMC free article] [PubMed] [Google Scholar]
- Ross CA, Tabrizi SJ (2011): Huntington's disease: From molecular pathogenesis to clinical treatment. Lancet Neurol 10:83–98. [DOI] [PubMed] [Google Scholar]
- Sapp E, Ge P, Aizawa H, Bird E, Penney J, Young AB, Vonsattel JP, DiFiglia M (1995): Evidence for a preferential loss of enkephalin immunoreactivity in the external globus pallidus in low grade Huntington's disease using high resolution image analysis. Neuroscience 64:397–404. [DOI] [PubMed] [Google Scholar]
- Selemon L, Goldman‐Rakic P (1985): Longitudinal topography and interdigitation of corticostriatal projections in the rhesus monkey. J Neurosci 5:776–794. [DOI] [PMC free article] [PubMed] [Google Scholar]
- Sotrel A, Williams RS, Kaufmann WE, Myers RH (1993): Evidence for neuronal degeneration and dendritic plasticity in cortical pyramidal neurons of Huntington's disease: A quantitative Golgi study. Neurology 43:2088–2096. [DOI] [PubMed] [Google Scholar]
- Squitieri F, Cannella M, Simonelli M, Sassone J, Martino T, Venditti E, Ciammola A, Colonnese C, Frati L, Ciarmiello A (2009): Distinct brain volume changes correlating with clinical stage, disease progression rate, mutation size, and age at onset prediction as early biomarkers of brain atrophy in Huntington's disease. CNS Neurosci Ther 15:1–11. [DOI] [PMC free article] [PubMed] [Google Scholar]
- Sritharan A, Egan GF, Johnston L, Horne M, Bradshaw JL, Bohanna I, Asadi H, Cunnington R, Churchyard AJ, Chua P, Farrow M, Georgiou‐Karistianis N (2010): A longitudinal diffusion tensor imaging study in symptomatic Huntington's disease. J Neurol Neurosurg Psychiatry 81:257–262. [DOI] [PubMed] [Google Scholar]
- Stoffers D, Sheldon S, Kuperman J, Goldstein J, Corey‐Bloom J, Aron A (2010): Contrasting gray and white matter changes in preclinical Huntington disease: An MRI study. Neurology 74:1208. [DOI] [PMC free article] [PubMed] [Google Scholar]
- Tabrizi SJ, Langbehn DR, Leavitt BR, Roos RAC, Durr A, Craufurd D, and Kennard C, Hicks SL, Fox NC, Scahill RI, Borowsky B, Tobin AJ, Rosas HD, Johnson H, Reilmann R, Landwehrmeyer B, Stout JC (2009): Biological and clinical manifestations of Huntington's disease in the longitudinal TRACK‐HD study: Cross‐sectional analysis of baseline data. Lancet Neurol 8:791–801. [DOI] [PMC free article] [PubMed] [Google Scholar]
- Tabrizi SJ, Reilmann R, Roos RAC, Durr A, Leavitt B, Owen G, Jones R, Johnson H, Craufurd D, Hicks SL, Kennard C, Landwehrmeyer B, Stout JC, Borowsky B, Scahill RI, Frost C, Langbehn DR, the TRACK‐HD investigators (2012): Potential endpoints for clinical trials in premanifest and early Huntington's disease in the TRACK‐HD study: Analysis of 24 month observational data. Lancet Neurol 11:42–53. [DOI] [PubMed] [Google Scholar]
- Tabrizi SJ, Scahill RI, Durr A, Roos RAC, Leavitt BR, Jones R, Landwehrmeyer GB, Fox NC, Johnson H, Hicks SL, Kennard C, Craufurd D, Frost C, Langbehn DR, Reilmann R, Stout JC, the TRACK‐HD investigators (2011): Biological and clinical changes in premanifest and early stage Huntington's disease in the TRACK‐HD study: The 12‐month longitudinal analysis. Lancet Neurol 10:31–42. [DOI] [PubMed] [Google Scholar]
- Thompson PM, Hayashi KM, de Zubicaray GI, Janke AL, Rose SE, Semple J, Hong MS, Herman DH, Gravano D, Doddrell DM, Toga AW (2004): Mapping hippocampal and ventricular change in Alzheimer disease. Neuroimage 22:1754–1766. [DOI] [PubMed] [Google Scholar]
- Vaillant M, Glaunès J (2005): Surface matching via Currents In: Christensen G, Sonka M, Editors. Information Processing in Medical Imaging. Lecture notes in computer sciences,New York:Springer‐Verlag; pp 381–392. [DOI] [PubMed] [Google Scholar]
- van den Bogaard SJ, Dumas EM, Ferrarini L, Milles J, van Buchem MA, van der Grond J, Roos RA (2011): Shape analysis of subcortical nuclei in Huntington's disease, global versus local atrophy—results from the TRACK‐HD study. J Neurol Sci 307:60–68. [DOI] [PubMed] [Google Scholar]
- Vandenberghe W, Demaerel P, Dom R, Maes F (2009): Diffusion‐weighted versus volumetric imaging of the striatum in early symptomatic Huntington disease. J Neurol 256:109–114. [DOI] [PubMed] [Google Scholar]
- Vonsattel J, Myers R, Stevens TJ, Ferrante RJ, Bird ED, Richardson EP Jr (1985): Neuropathological classification of Huntington's disease. J Neuropathol Exp Neurol 44:559. [DOI] [PubMed] [Google Scholar]
- Vonsattel JPG, Lianski M (1997): Huntington's disease In: Esiri MM, Lee VM‐Y, Trojanowski JQ, Editors. The Neuropathology of Dementia, Cambridge University Press, p219–240. [Google Scholar]
- Wang L, Beg M, Ratnanather J, Ceritoglu C, Younes L, Morris J.Miller M (2007): Large deformation diffeomorphism and momentum based hippocampal shape discrimination in dementia of the Alzheimer type. IEEE T Med Imaging 26:462–470. [DOI] [PMC free article] [PubMed] [Google Scholar]
- Warby S, Graham R, Hayden M (2010): Huntington Disease. US National Library of Medicine Bookshelf (online). Available at: http://www.ncbi.nlm.nih.gov/books/NBK1305 (Accessed May 20, 2011).
- Weaver KE, Richards TL, Liang O, Laurino MY, Samil A, Aylward EH (2009): Longitudinal diffusion tensor imaging in Huntington's Disease. Exp Neurol 216:525–529. [DOI] [PMC free article] [PubMed] [Google Scholar]
- Yeterian E, Pandya D (1995): Corticostriatal connections of extrastriate visual areas in rhesus monkeys. J Comp Neurol 352:436–457. [DOI] [PubMed] [Google Scholar]
- Yeterian EH, Van Hoesen GW (1978): Cortico‐striate projections in the rhesus monkey: The organization of certain cortico‐caudate connections. Brain Res 139:43–63. [DOI] [PubMed] [Google Scholar]
- Yeterian EH, Pandya DN (1993): Striatal connections of the parietal association cortices in rhesus monkeys. J Comp Neurol 332:175–197. [DOI] [PubMed] [Google Scholar]
- Younes L (2010): Shapes and Diffeomorphisms. New York:Springer. [Google Scholar]
- Zhang Y, Long JD, Mills JA, Warner JH, Lu W, Paulsen JS; PREDICT‐HD Investigators and Coordinators of the Huntington Study Group (2011): Indexing disease progression at study entry with individuals at‐risk for Huntington disease. Am J Med Genet B Neuropsychiatr Genet 156B:751–763. [DOI] [PMC free article] [PubMed] [Google Scholar]
- Zuccato C, Cattaneo E (2009): Brain‐derived neurotrophic factor in neurodegenerative diseases. Nat Rev Neurol 5:311–322. [DOI] [PubMed] [Google Scholar]