Abstract
Gold nanoparticles (AuNPs) with core sizes below 2 nm and compact ligand shells constitute versatile platforms for the development of novel reagents in nanomedicine. Due to their ultrasmall size, these AuNPs are especially attractive in applications requiring delivery to crowded intracellular spaces in the cytosol and nucleus. For eventual use in vivo, ultrasmall AuNPs should ideally be monodisperse, since small variations in size may affect how they interact with cells and behave in the body. Here we report the synthesis of ultrasmall, uniform 144-atom AuNPs protected by p-mercaptobenzoic acid (Au144(pMBA)60) followed by ligand exchange with glutathione (GSH). Quantitative scanning transmission electron microscopy (STEM) reveals that the resulting GSH-coated AuNPs (Au(GSH)) have a uniform mass distribution with cores that contain 134 gold atoms on average. Particle size dispersity is analyzed by analytical ultracentrifugation, giving a narrow distribution of apparent hydrodynamic diameter of 4.0 ± 0.6 nm. To evaluate the nanoparticles' intracellular fate, the cell penetrating peptide TAT is attached non-covalently to Au(GSH), which is confirmed by fluorescence quenching and isothermal titration calorimetry. HeLa cells are then incubated with both Au(GSH) and the Au(GSH)-TAT complex, and imaged without silver enhancement of the AuNPs in unstained thin sections by STEM. This imaging approach enables unbiased detection and quantification of individual ultrasmall nanoparticles and aggregates in the cytoplasm and nucleus of the cells.
Keywords: gold nanoparticle, nanomedicine, cellular uptake, STEM, cell penetrating peptide
1. Introduction
Monolayer-protected gold nanoparticles (AuNPs) constitute a versatile platform onto which small molecules such as drugs and peptides can be attached, and as such they have been intensely investigated for nanomedicine applications in therapy and diagnostics.[1–6] For use in these types of applications, functional AuNPs must be generally capable of entering cells efficiently.[7–9] Previous studies have indicated that the degree of AuNP accumulation inside cells depends on nanoparticle surface charge, nature of the ligand coating, as well as nanoparticle size and shape.[10–15] Usually, AuNPs are internalized by endocytosis, and thus remain confined to endosomes and lysosomes with no general access to the cytosol or nucleus.[7,8] In this scenario, the internalized AuNPs may be unable to produce the desired biological response.
Among the many different classes of AuNPs varying in both size and shape, ultrasmall nanoparticles (here defined to have a gold core less than 2 nm in diameter) have been shown to be effective as drug delivery vehicles, intracellular imaging probes, and in vivo imaging contrast agents.[16–20] As drug delivery vehicles, it is expected that ultrasmall AuNPs will show an increased probability of escaping from endosomes and diffusing in the cell cytosol and nucleus without the hindrance of the crowded cellular environment.[17,21] Conversely, larger nanoparticles may have a lower probability of escaping from endosomes, reaching specific intracellular sites, or entering the cell nucleus through the narrow channels of nuclear pore complexes.
Several different protocols inspired by the Brust-Schiffrin method[22] have been employed to synthesize ultrasmall organothiolate protected AuNPs. While it is now recognized that these syntheses can produce magic number[23] molecular formulae that are especially stable, for instance Au25(SR)18, Au102(SR)44 and Au144 (SR)60,[24–27] typical syntheses also simultaneously produce kinetically trapped and less stable (and usually less abundant) products with a wide range of molecular formulae.[28] Thus, size uniformity is not always easy to control in these preparations,[29] yet highly uniform or even molecularly pure AuNPs would be ultimately ideal for biomedical and nanomedicine applications. For example, relatively small differences in size can affect the behavior of the AuNPs in the body (e.g., kidney vs. liver clearance, degree of extravasation and accumulation in tumors) as well as how they interact with cells (e.g., mode and extent of cellular uptake, intracellular distribution). Size is also an essential variable controlling the physiological properties of other types of nanoparticles, such as quantum dots.[30,31]
In this work, we synthesize ultrasmall and uniform AuNPs stabilized by p-mercaptobenzoic acid (pMBA) ligands (Au(pMBA)). This nanoparticle has a presumed chemical formula of Au144(pMBA)60 and a core diameter of 2 nm, and is related to the 102-atom cluster Au102(pMBA)44 whose crystal structure has been recently determine by X-ray crystallography.[25,26,32] In addition to being ultrasmall and uniform, both the 102- and 144-atom AuNPs can be synthesized in relatively high yields and are amenable to being derivatized for potential applications in biology.[26,33,34] Synthesis of Au(pMBA) is followed in this work by ligand exchange[35] with the natural tripeptide glutathione (GSH) to make the nanoparticles more biocompatible and stable (Au(GSH)).
To characterize the size and degree of uniformity of Au(pMBA) and Au(GSH) nanoparticles, we use high-angle annular dark-field (HAADF) scanning transmission electron microscopy (STEM) and analytical ultracentrifugation (AUC), two powerful techniques that have been somewhat underutilized in the characterization of ultrasmall nanoparticles for applications in nanomedicine. In the HAADF STEM technique, image contrast scales approximately with the square of the atomic number Z,[36–38] and thus AuNPs (Z=79) adsorbed onto a thin carbon (Z=6) support film appear with high contrast as bright dots on a dark background. For a nanoparticle of a particular element the integrated pixel intensity is proportional to the mass. Thus, because STEM images can be analyzed quantitatively,[37–41] information on a nanoparticle's mass distribution can be obtained from a histogram of net nanoparticle intensities, which provides for a much more robust metric of particle uniformity than does the particle's diameter. In comparison, the common approach of measuring nanoparticle size from traditional bright-field TEM micrographs can be imprecise and lead to underestimated measurements of size uniformity. When imaged in bright-field TEM, ultrasmall AuNPs give rise to intrinsically low contrast, which falls with decreasing nanoparticle size. Moreover, the limited number of pixels contained within individual AuNPs makes it difficult to define their boundary and thus to determine their diameters accurately. To measure hydrodynamic size distributions of the ultrasmall AuNPs, we use analytical ultracentrifugation, which is a technique that has become increasingly important in the characterization of nanoparticles for biological applications.[31,42–44] One particular advantage of AUC over other methods such as dynamic light scattering is that high resolution size-distributions can be obtained resulting from hydrodynamic separation of species by centrifugal force. This separation is achieved through differences in sedimentation rates due to heterogeneity in particle size and shape.
Following the synthesis and characterization of the ultrasmall AuNPs, we show next that the TAT cell penetrating peptide[45] (CPP) can be attached to Au(GSH) via non-covalent interactions. We then incubate HeLa cells with Au(GSH) and the Au(GSH)-TAT complex and track the intracellular fate of the nanoparticles using STEM. Images are acquired from samples that have not undergone heavy-metal staining or silver enhancement of the AuNPs, thus providing a route for unbiased detection and quantification of individual ultrasmall nanoparticles and small aggregates inside the cells.
2. Results and Discussion
2.1. Synthesis and characterization of Au(pMBA)
Au(pMBA) nanoparticles were first characterized by UV-Vis spectroscopy. The UV-Vis spectrum displayed in Figure 1A is characteristic of AuNPs having a core diameter of about 2 nm, since there is no surface plasmon absorption peak at around 500 nm but only a weak shoulder near this wavelength.[46] The spectrum also shows a peak around 280 nm originating from the pMBA ligands.
Figure 1.
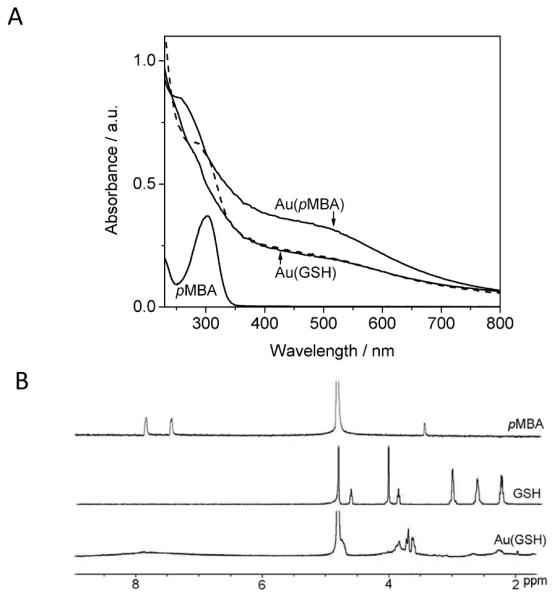
(A) UV-Vis spectra of Au(pMBA), pMBA ligands and Au(GSH) before (dashed line) and after (solid line) purification. (B) 1H NMR spectrum of Au(GSH) shows peaks at chemical shifts in the range from 3.5 to 5 ppm, corresponding to GSH ligands attached to the surface of the nanoparticle. This same spectrum does not show any peaks around 8 ppm, consistent with complete exchange of pMBA for GSH during ligand exchange. The intense peak at about 4.8 ppm (which has been truncated) is due to D2O.
HAADF STEM imaging confirmed that synthesis of Au(pMBA) led to a very uniform population of nanoparticles with a core diameter of 2.0 ± 0.2 nm (Figure 2A). To better assess quantitatively the uniformity of core sizes, however, we plotted a histogram of integrated intensities for 2000 AuNPs and fitted the histogram to a Gaussian distribution centered at 144 atoms (Figure 3A). We have verified independently the approximate core mass of Au(pMBA) by comparing intensities with th~67-Au atom AuNP (Nanogold®).[47,48] Assuming that Au(pMBA) nanoparticles have an average diameter of 2.0 nm and constant density, the full width at half maximum (FWHM) of the histogram translates to an extremely small range of core sizes from 1.9 to 2.1 nm (Figure 3A). The variation in core mass as given by the FWHM is probably lower since shot noise in the STEM dark-field signal and background estimation of the image intensity both contribute to the measured spread in AuNP intensity.
Figure 2.
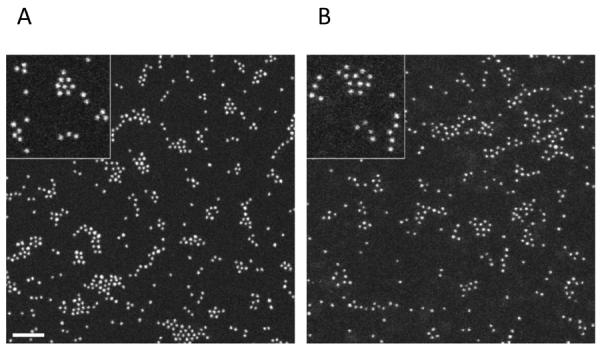
HAADF STEM images for (A) Au(pMBA) and (B) Au(GSH) AuNPs. The intensity scale is the same in both images. Scale bar, 20 nm.
Figure 3.
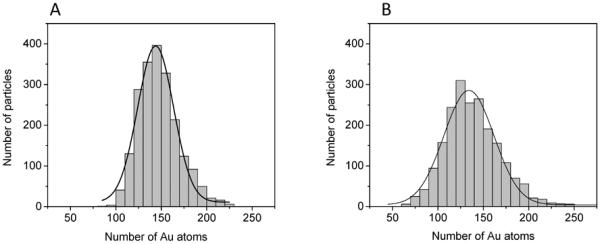
Histograms of integrated intensities represented in terms of number of gold atoms for (A) Au(pMBA) and (B) Au(GSH) AuNPs. Fitted Gaussian functions are centered at 144 and 134 atoms in (A) and (B), respectively. Size of histogram bin is 10 atoms.
The ligand shell in addition to the gold core defines the hydrodynamic size of AuNPs in solution. The hydrodynamic diameter of Au(pMBA) clusters in PBS was measured by dynamic light scattering (DLS), yielding an approximate value of 4.5 ± 0.5 nm (n = 6; where n refers to number of measurements). DLS, however, does not have sufficient resolution to yield detailed information on hydrodynamic size dispersity.
Thus, the hydrodynamic size uniformity of the nanoparticles was assessed by AUC. Figure 4A shows the raw sedimentation velocity profiles acquired for Au(pMBA) particles. The data are well-described by a continuous distribution of non-interacting particles (higher panel), with a root-mean-square difference of 0.00519 OD units (lower panel). The resulting sedimentation coefficient distribution exhibits a main peak with a weight-average sedimentation coefficient sw of 18.7 S (distribution not shown). Figure 4B shows the apparent-size distribution obtained by conversion of the sedimentation coefficient distribution. Accurate estimation of a hydrodynamic radius requires knowledge of the particle density, and in this experiment we have used a value (4.51g/cm3) recently published for particles of a similar size and composition.[49] While this value may lead to errors in the absolute value of the hydrodynamic radius, it would not affect the ability to draw conclusions regarding the overall homogeneity of the distribution of particle sizes. A narrow distribution of apparent particle diameters is observed, namely Dh = 3.6 ± 0.2 nm with the error representing the FWHM of the main peak.
Figure 4.
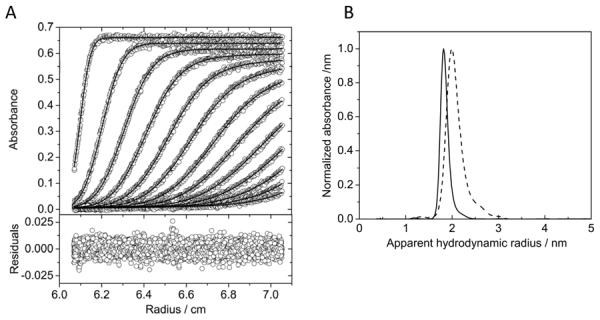
Analytical ultracentrifugation analysis of nanoparticles. A) Sedimentation velocity profiles for Au(pMBA) (higher panel). The best-fit Lamm equation solutions are shown in overlay (red lines). The residuals with an rmsd = 0.00519 OD (lower panel). B) Apparent hydrodynamic radius distribution for Au(pMBA) (solid trace) and Au(GSH) (dashed trace) nanoparticles obtained by transformation of the sedimentation coefficient distribution, assuming a particle density of 4.51 g/cm3. Dh = 3.6 ± 0.2 nm for Au(pMBA) and 4.0 ± 0.6 nm for Au(GSH).
2.2. Ligand exchange with glutathione
Taken together, the above data show that Au(pMBA) is small and extremely uniform, thus constituting an interesting platform for applications in nanomedicine. However, to ensure the biocompatibility of the nanoparticles, we attempted to substitute the pMBA ligand for GSH through a ligand exchange reaction. It was not clear a priori if most or all pMBA could be substituted for GSH, while maintaining the original core size and excellent degree of uniformity of Au(pMBA). In the ligand exchange of up to ~50% of the ligands on Au(pMBA), ligand exchange is a straightforward 1:1 stoichiometric reaction, proceeding through an associative mechanism.[50] In more aggressive ligand exchange conditions, oxidative etching of the inorganic core producing (RS-Au-)n oligomers can become a competing reaction.[51] While the exact details of the interplay between etching and exchange are unclear, our 10:1 incoming ligand feed ratio and 2 hour time course are consistent with conditions that might give complete ligand exchange accompanied by some AuNP etching.
A UV-Vis spectrum obtained after ligand exchange with GSH but before purification shows that the peak due to pMBA is shifted to 300 nm, which now coincides with the peak position from a solution of free pMBA molecules (Figure 1A). After washing extensively by centrifuge filtration, the peak at 300 nm disappears revealing the spectrum of pure Au(GSH) in solution. Interestingly, the shoulder near 500 nm for Au(GSH) is less prominent than that for Au(pMBA), suggesting that the parent 144-atom gold core might have been slightly etched during ligand exchange. Because a UV-Vis spectrum for the analogous 102-atom gold cluster shows a completely smooth decay near 500 nm,[33] it is thus reasonable to assume that the Au(GSH) AuNP contains between 102 and 144 gold atoms.
Although UV-vis demonstrated successful ligand exchange of pMBA for GSH, the sensitivity of the technique is not high enough to establish whether the exchange was complete. We therefore utilized NMR to verify with high accuracy the degree of ligand exchange of pMBA for GSH (Figure 1B). First, 1H NMR of Au(GSH) showed peaks at chemical shifts in the range from 3.5 to 5 ppm, corresponding to GSH ligands attached on the surface of the nanoparticles.[52] Moreover, the 1H NMR spectrum of Au(GSH) showed no peaks near 8 ppm that could be attributable to the aromatic protons of pMBA ligands, indicating therefore that the ligand exchange reaction reached completion.
STEM imaging showed no obvious difference between the Au(GSH) and Au(pMBA) nanoparticles (Figure 2). However, a quantitative analysis of the STEM images for Au(GSH) revealed smaller integrated intensities compared to Au(pMBA). Two thousand Au(GSH) nanoparticles were analyzed from a total of 15 images collected over three different days. Using the 144-atom Au(pMBA) as a calibration standard, the Gaussian function fitted to the Au(GSH) histogram was then found to be centered at 134 atoms (Figure 3B). The difference between 144 and 134 gold atoms for Au(pMBA) and Au(GSH) is relatively small (7%) but statistically significant (p < 0.001). This difference in numbers of atoms is also consistent with the UV-Vis results discussed above. The histograms in Figures 3A and 3B also indicate that the distribution of integrated intensities is slightly broader for Au(GSH) than for Au(pMBA). Assuming a constant core density, an analysis of the Gaussian FWHM for Au(GSH) translates into an estimated range of core sizes of 1.8–2.1 nm.
DLS was utilized to measure the hydrodynamic diameter of Au(GSH), yielding a value of 4.5 ± 0.8 nm (n = 4). The apparent hydrodynamic radius distribution determined by AUC is shown in Figure 4B. It was obtained by conversion of the sedimentation coefficient distribution assuming the particles to have the same density as the Au(pMBA) particles. The weight-average diameter of the distribution is 4.0 nm with a FWHM of 0.6 nm. It is conceivable that the apparent difference in size between Au(pMBA) and Au(GSH) (3.6 vs. 4 nm) is less pronounced, since the transformation does not take into account any potential differences in particle density. Contributions to this difference may come about by the relative amount of stabilizing ligand attached to the gold surface or from differences in hydration. Figure 4B also shows that the width of the distribution is slightly larger for Au(GSH) compared to Au(pMBA) (± 0.6 vs. 0.2 nm), indicating ligand exchange introduced a small degree of heterogeneity to the resulting Au(GSH) nanoparticles.
We also measured the Zeta potential of the AuNPs at pH 7.2 before and after ligand exchange, obtaining −18.4 ± 1.1 mV and −15.9 ± 1.2 mV for Au(pMBA) and Au(GSH), respectively.
Overall, the above results indicate that ligand exchange of Au(pMBA) with GSH can be successfully performed, since the reaction seems to reach completion and the Au(GSH) product maintains its size relative to the Au(pMBA) starting material. Although the size uniformity of Au(GSH) is slightly lower compared to Au(pMBA) as a result of ligand exchange, 4.0 ± 0.6 nm still constitutes a very tight size distribution for potential applications of Au(GSH) in biology. In future, it will be interesting to test whether Au(pMBA) can also undergo successful ligand exchange reactions with other suitable molecules (e.g., thiolated oligoethylene glycol) while maintaining the original core size and monodispersity.
2.3. Electrostatic binding of TAT to Au(GSH)
The attachment of CPPs to nanoparticles and other types of cargo can enhance cellular uptake by endocytosis with potential intracellular delivery to the cytosol and nucleus.[21,53–57] Because the Au(GSH) were negatively charged, we therefore tested whether the polycationic TAT CPP could be attached to the nanoparticles via electrostatic interactions. To measure the degree of association between TAT and Au(GSH) conveniently through fluorescence, we used a TAT peptide with a FAM fluorescent dye attached to its N-terminus. With this setup, a strong fluorescence quenching[58,59] of FAM in the presence of the nanoparticles would indicate close proximity between TAT and Au(GSH), thus implying association by electrostatic binding.
Figure 5A shows that the fluorescence intensity from a 1 μM TAT solution decreased dramatically upon addition of 0.5 μM Au(GSH). Because these are relatively small concentrations, collisional quenching cannot exclusively account for the high degree of quenching (~ 90%) observed in Figure 5A. Instead, the fluorescence quenching must be due to close binding between TAT and Au(GSH). Moreover, most of the quenched fluorescence emission could be recovered by adding NaCl (Figure 5B), adding further evidence that TAT binds to Au(GSH) electrostatically. For comparison, Figure 5C reveals that FAM in the presence of Au(GSH) underwent a much less significant degree of fluorescence quenching. Because FAM and Au(GSH) are not expected to bind to one another, the small decline in FAM fluorescence as a function of AuNP concentration can be now explained by collisional quenching between FAM and Au(GSH).[60] To see this more clearly, a characteristic Stern-Volmer (S-V) plot was generated from the data in Figure 5C. As expected, the computed S-V plot is linear with an intercept of unity (Figure 5C, inset). The slope of the curve, defined as the S-V collisional quenching constant (KSV), was found to be 5.5 × 10⁵ M−1. This measured KSV is in good agreement with previously determined KSV values for the collisional quenching of different fluorophores by a similarly sized gold nanoparticle having 140 Au atoms.[60]
Figure 5.
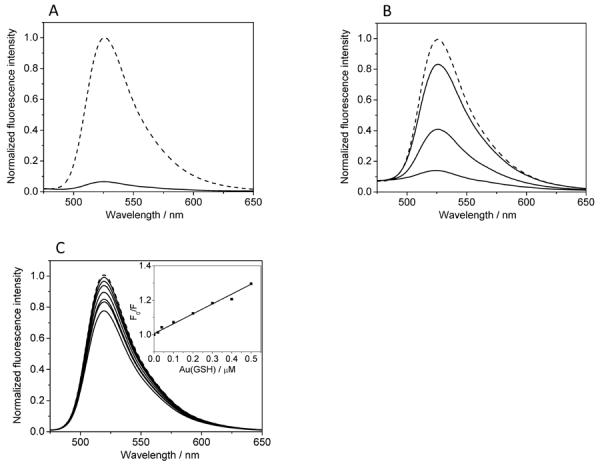
Binding of TAT to Au(GSH) assessed by fluorescence quenching. (A) Fluorescence emission spectra from a 1 μM solution of FAM-labeled TAT in the absence (dashed curve) and presence of 0.5 μM Au(GSH). (B) Fluorescence spectra from a 1 μM solution of Au(GSH)-TAT in the presence of 0, 0.25 and 1 M NaCl (from bottom to top). Dashed curve corresponds to a 1 μM control solution of FAM-labeled TAT. (C) Fluorescence emission spectra from a 1 μM solution of FAM in the presence of increasing amounts of Au(GSH) (from top to bottom: 0.02, 0.04, 0.1, 0.2, 0.3, 0.4, 0.5 μM). Dashed curve corresponds to a 1 μM control solution of FAM. Inset is a Stern-Volmer plot obtained using the fluorescence data in (C).
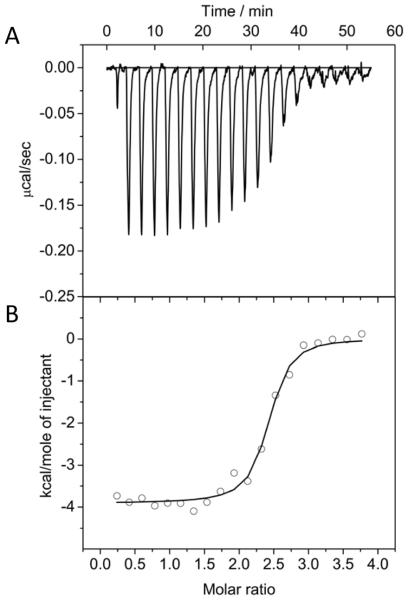
The binding between TAT and Au(GSH) was also confirmed by isothermal titration calorimetry (ITC), which showed decreasing heats of injection as TAT was titrated into a solution of Au(GSH) (Figure 6A). Integration of the heats and normalization to the molar ratio of TAT to Au(GSH) in the reaction cell resulted in the binding isotherm displayed in Figure 6B, which we used to derive a binding stoichiometry of 2.35 ± 0.02 TAT molecules per Au(GSH). We also found that the binding of TAT to Au(GSH) had a dissociation constant, Kd, of 56 ± 14 nM.
Figure 6.
Binding of TAT to Au(GSH) assessed by isothermal titration calorimetry. (A) Heat flow with subsequent injections of TAT into a Au(GSH) solution. (B) Binding isotherm obtained by integration of the thermogram. The curve indicates rapid binding of TAT to Au(GSH) with a saturation of binding sites. The data are well described by a single site model, with a TAT to Au(GSH) molar ratio of 2.35 ± 0.02 and binding constant of 56 ± 14 nM.
2.4. Intracellular imaging of Au(GSH) nanoparticles
Here we investigate the intracellular distribution of Au(GSH) with and without the presence of TAT bound to the nanoparticle surface. Cell uptake experiments using Au(GSH)-TAT were carried out at a solution concentration of 2 μM and at a 1:1 molar ratio Au(GSH):TAT. These solutions were stable over many days without the formation of visible nanoparticle aggregates. However, we observed that the addition of TAT at higher molar ratios (approximately > 4) could induce aggregation of the AuNPs. Using a Trypan Blue exclusion assay, we also determined that the Au(GSH) nanoparticles were not acutely cytotoxic in the concentration range of 1–10 μM. Cell viability was around 90 ± 3 % for all concentrations, and the same as that of control experiments where the cells were incubated in PBS only (data not shown).
HeLa cells were incubated with Au(GSH)-TAT for one hour and processed for electron microscopy imaging. Importantly, during sample processing, we did not employ osmium tetroxide or any other heavy metal compound. The lack of heavy-metal contrast agents allows ultrasmall Au(GSH) nanoparticles to be visualized by STEM in thin plastic-embedded cell sections without silver enhancement, thus providing a route for entirely unbiased detection of the AuNPs inside the cells. Silver enhancement, on the other hand, can produce false positives by auto-nucleation of silver particles[61] and/or cause coalescence of nearby Au(GSH) AuNPs into larger particles. The lack of heavy-metal contrast agents also rules out the possibility of mistaking ultrasmall nanoparticles to electron dense nano-sized artifacts.[39,62–64]
Figure 7 shows a few representative STEM images of Au(GSH) nanoparticles inside HeLa cells. Despite the lack of heavy-metal contrast agents, dark-field STEM images allow a clear delineation of the cytoplasm and nucleus (Figure 7A, left panel). Moreover, the dispersed areas with bright contrast in the nucleus correspond to regions of condensed chromatin, and the large round bright area also in the nucleus corresponds to the nucleolus (Figure 7A). In Figure 7B and C, nanoparticles outside the nucleus appear clustered together and confined to small areas, strongly suggesting that they are inside endosomes (see arrows). In Figure 7B, two larger aggregates (arrowheads) are seen within only 5–10 nm of the nuclear membrane, strongly suggesting that these particles may be free in the cytosol. In Figure 7A and B, Au(GSH) nanoparticles are visible inside the nucleus in the form of small aggregates ranging in size from about 4 to 18 nm.
Figure 7.
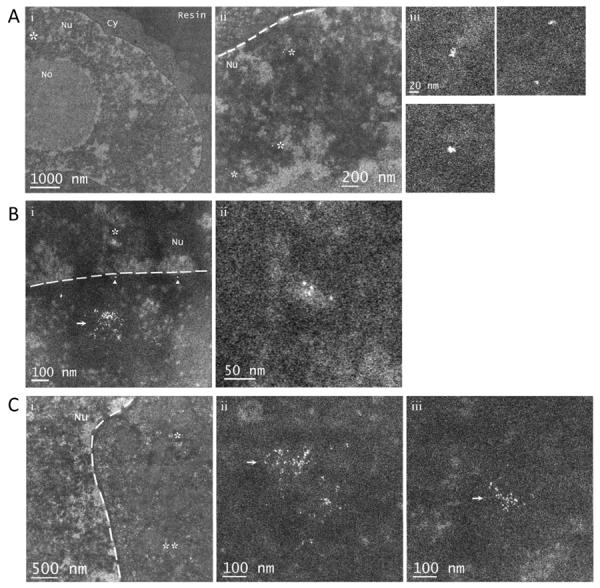
Intracellular imaging of Au(GSH) nanoparticles. (A) (i) STEM imaging allows a clear delineation of the cytoplasm and nucleus in plastic-embedded HeLa cells prepared with no heavy-metal contrast agents. (ii) Higher magnification image of the region marked with an asterisk in (i). (iii) Expanded views of the regions marked with asterisks in (ii). In (iii), small Au(GSH) nanoparticle aggregates are visible inside the nucleus. (B) (i) Au(GSH) nanoparticles both in and outside the nucleus. Nanoparticles outside the nucleus appear mostly clustered together and are likely to be inside endosomes (arrow). Nanoparticles marked with arrowheads appear isolated and are within 5–10 nm of the nuclear membrane, suggesting they are free in the cytosol. (ii) Expanded view of the region in the nucleus marked with an asterisk in (i). (C) Au(GSH) nanoparticles outside the nucleus, probably within endosomes (arrow). (ii) and (iii) are higher magnification images of the regions marked with one and two asterisks in (i), respectively. Nu, nucleus; No, nucleolus; Cy, cytoplasm. The dashed lines mark the boundary between the nucleus and cytoplasm.
Surprisingly, the intracellular distribution of Au(GSH) without TAT was remarkably similar to that as described above for Au(GSH)-TAT (data not shown). Importantly, Au(GSH) nanoparticles could also be observed in the nucleus of HeLa cells. One explanation for this result is that Au(GSH) has an intrinsic ability to escape from endosomes and access the cytosol and nucleus. Another possibility would involve direct crossing of the plasma membrane by the nanoparticles according to an energy-independent mechanism. In fact, a few recent studies have offered strong evidence that, given the right conditions of capping layer composition and organization, small gold nanoparticles as well as quantum dots are able to cross the plasma membrane of living cells.[11,15,65,66] However, in studies involving nanoparticle localization by electron microscopy, we cannot discount the fact that chemical fixation could potentially lead to the intracellular redistribution of nanoparticles. This issue needs to be investigated further in future studies.
The ability afforded by STEM to visualize ultrasmall AuNPs without silver enhancement in suitable specimens[67–70] is unique in that it enables counting the number of individual Au(GSH) AuNPs contained in larger aggregates in the cytosol and nucleus. We show in Figure 8 nanoparticles of different sizes for which we measured their number of gold atoms using Au(GSH) as a calibration standard. Some nanoparticles were found to contain 133–174 gold atoms, consistent with single Au(GSH) AuNPs, whereas other nanoparticles contained 265–295 atoms, which presumably were aggregates comprising two individual 134-atom Au(GSH) AuNPs. Much larger aggregates were also found with as many as 1500 gold atoms.
Figure 8.
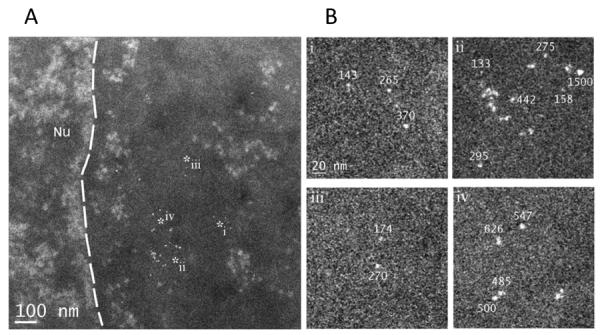
Quantification of Au(GSH) aggregates inside cells. (A) Image shows nanoparticles of different sizes for which their number of gold atoms was measured using Au(GSH) as a calibration standard. The dashed line marks the boundary between the nucleus (Nu) and cytoplasm. (B) Expanded views of the regions marked with asterisks in (A). Values annotated in the images indicate the number of gold atoms for the adjacent nanoparticle. Nanoparticles with 133–174 gold atoms correspond to a single Au(GSH) AuNP, whereas those with 265–295 atoms are consistent with two Au(GSH) AuNPs. Other nanoparticles had higher numbers of gold atoms up to 1500.
It is interesting to consider the primary cellular site where nanoparticle aggregates such as those observed in the nucleus (e.g., see rightmost panels in Figure 7A and B) are formed. First, however, we note that the possibility of Au(GSH)-TAT coalescing into small aggregates prior to being added to the cells can be ruled out by an AUC analysis of Au(GSH)-TAT solutions. Specifically, based on the rotor speed and particle density, it is expected that Au(GSH)-TAT particle aggregates as large as 29 nm would have been detected in solution by AUC if present at concentrations within the linear range of the optical system. By contrast, only a single size distribution curve centered at Dh = 3.8 nm ± 0.3 was detected for Au(GSH)-TAT (data not shown), implying that small Au(GSH) aggregates must form necessarily in the presence of the cells. Thus, it is possible that Au(GSH) aggregates observed inside the nucleus were produced by the coalescence of single ultrasmall AuNPs in the cytosol or nucleus after they escaped from endosomes. Alternatively, nanoparticle aggregates might have first formed inside endosomes and then escaped prior to nuclear entry. Still a third possibility would entail the formation of small aggregates at the plasma membrane outside the cell, followed by their uptake via endocytosis and endosomal escape. Differentiating among these possibilities is important, since this would have implications for the role of nanoparticle size in influencing endosomal escape and nuclear entry. We are currently trying to address these and similar questions related to the cellular uptake and intracellular fate of ultrasmall AuNPs. The ability not only to image ultrasmall AuNPs with high contrast in the STEM but also to analyze the images quantitatively as discussed above will play a significant role in these studies.
3. Conclusion
We have synthesized an ultrasmall, 144-atom gold nanoparticle ligand-stabilized with pMBA. These Au(pMBA) AuNPs have a core size of about 2 nm and are extremely uniform, which are both desirable features in potential biomedical and nanomedicine applications of AuNPs. Specifically, nanoparticles of a sufficiently small size are advantageous for delivery to crowded intracellular spaces in the cytosol and nucleus, and uniformity is essential for achieving consistent biological responses during nanoparticle-cell interactions both in vitro and in vivo.
Synthesis of Au(pMBA) nanoparticles was followed by a ligand exchange reaction with GSH. We analyzed the resulting Au(GSH) AuNPs using two powerful techniques that have been somewhat underutilized in the characterization of ultrasmall nanoparticles for applications in nanomedicine. Quantitative STEM imaging revealed that Au(GSH) was highly uniform and had almost the same number of core gold atoms (134) as the parent 144-atom Au(pMBA) nanoparticle. Analytical ultracentrifugation showed that Au(GSH) had a narrow hydrodynamic apparent size distribution of 4.0 ± 0.6 nm. Next, Au(GSH) as well as Au(GSH)-TAT complexes were incubated with HeLa cells to evaluate the intracellular fate of the nanoparticles. STEM revealed that both Au(GSH) and Au(GSH)-TAT were effectively internalized by the cells and delivered to the nucleus. A quantitative analysis of the images further indicated that Au(GSH) were present in the cell interior as single AuNPs as well as in the form of small aggregates containing from 2 to 10 individual nanoparticles.
It will be interesting to explore next whether Au(pMBA) can be exchanged with other types of ligands to create new monolayer-protected nanoparticles showing exceptional size uniformity for applications in biology. In addition, it will be important to understand more about the intracellular fate of these and other ultrasmall AuNPs, especially the potential role of nanoparticle size and ligand composition in mediating efficient access to the cytosol and nucleus. Together with other more widely used characterization techniques, quantitative STEM imaging and AUC as discussed in this work should play an essential role towards addressing these types of questions.
4. Experimental Section
Synthesis of Au(pMBA) and Au(GSH) nanoparticles
Au(pMBA) was synthesized according to a previously published procedure.[32] Briefly, HAuCl4 (2 mmol) (Sigma-Aldrich) was first dissolved in methanol (100 mL), and this solution added to an aqueous solution (80 mL) containing pMBA (TCI America) (6.8 mmol, pH > 13). This step produces a Au(I)-pMBA compound. After stirring for two days, Au(I)-pMBA (50 mL) was added to a water/methanol solution (1 L, 27%). To this mixture, NaBH4 (Sigma-Aldrich) freshly dissolved in water was added to Au (I) (1.5 times molar excess). The Au(I)-pMBA-NaBH4 mixture was then stirred for 18 hours at room temperature, and the product precipitated by adding methanol (about 1 L) followed by dialysis in water to remove impurities. The dialyzed product was then lyophilized, redispersed in PBS (1×) and kept at 4 °C. We note that the optimum 1.5-fold molar excess of NaBH4, which yielded the most uniform nanoparticles of the correct size, was found empirically by trying a few different molar excesses in the range from 0.5 to 5.
Ligand exchange of Au(pMBA) with GSH (Sigma-Aldrich) was carried out by mixing these two components together (10:1 GSH:pMBA molar ratio) for two hours at room temperature. The solution was purified by centrifuge filtration using an Amicon Ultra-4 filter (Millipore) (3 kDa).
UV-vis absorbance, spectrofluorometry, DLS, Zeta potential
UV-Vis spectra and fluorescence emission spectra were recorded using a GENESYS 10S UV-Vis spectrophotometer (Thermo Scientific) and F-7000 Fluorescence Spectrophotometer (Hitachi). Dynamic light scattering measurements were carried out in a DynaPro NanoStar (Wyatt Technology), and zeta potential performed in a Zetasizer Nano S (Malvern).
STEM imaging
HAADF STEM images of Au(pMBA) and Au(GSH) were recorded by means of a 300 kV Tecnai TF30 transmission electron microscope (FEI Company) equipped with a Schottky field emission gun and a model-3000 high-angle annular dark-field STEM detector (Fischione Instruments). The nanoparticles were deposited onto ultrathin carbon support films and imaged with a 0.31 nm pixel size and a probe diameter of approximately 0.5 nm. The microscope was operated with a small camera length of 130 mm to increase the inner collection semi-angle of the HAADF detector, leading to incoherent imaging conditions suitable for quantitative STEM image analysis of Au(pMBA) and Au(GSH). The large detector inner semi-angle also ensures that the contribution of the low-atomic number pMBA and GSH ligands to the STEM signal is negligible. Thus, integrated image intensities from individual AuNPs are exclusively proportional to their number of core gold atoms.
Analytical ultracentrifugation
AUC sedimentation velocity experiments were performed using a ProteomeLab XL-I analytical ultracentrifuge (Beckman Coulter) following the protocols outlined in the literature.[71] Briefly, dilute nanoparticle solutions (400 μL) prepared in PBS were loaded into double-sector charcoal-filled epon centerpieces with sapphire windows. After a temperature equilibration period, the samples were centrifuged at 25,000 rpm at 20 °C. The evolution of the resulting concentration gradient was monitored using the integrated absorbance scanner at a wavelength of 250 nm with a radial step size of 0.003 cm. The buffer density (1.00534 g/mL) and viscosity (1.0189 cP) at 20 °C were predicted using the software Sednterp (kindly provided by Dr. John Philo). The sedimentation profiles were modeled with numerical solutions to the Lamm equation using the continuous c(s) distribution model, as implemented in SEDFIT (vs. 12.5).[72] The sedimentation profiles were analyzed with maximum entropy regularization[72] and algebraic elimination of systematic noise parameters, and refinement by non-linear regression of the parameters for weight-average frictional ratio (f/fo)w and meniscus position. Hydrodynamic radius distributions were obtained by transformation of the sedimentation coefficient distribution using the following relationship:[49,73]
where η represents the solvent viscosity, ρp and ρs the density of the gold particle and solvent, respectively. Particle density used was assumed to be 4.51 g/cm3 as was determined previously for a similarly stabilized gold nanocluster Au144 (SR)60 (R = −CH2CH2PH).[49]
Isothermal titration calorimetry
ITC was used to characterize the interaction between TAT(47–57) (Anaspec) and Au(GSH). ITC was conducted on a Microcal VP-ITC instrument (Northampton, MA) at 20.0 °C. A TAT (100 μM) solution prepared in PBS was injected into the calorimeter cell containing Au(GSH) (6 μM) in PBS, using 19 successive injections at 15 μL each following an initial injection of 5 μL. Data analysis was conducted using the manufacturer software. A single site model was used with floating parameters (n, Ka, ΔH) optimized by non-linear regression using the Marquadt-Levenburg and Simplex algorithms.
NMR spectroscopy
1H NMR spectra were obtained with a Varian Mercury 400 spectrometer using D2O as a solvent. The chemical shifts were expressed relative to HOD (4.80 ppm). NMR samples were prepared by dissolving Au(GSH) (1.2 mg) or pure pMBA or GSH in D2O (300 μL) and transferring to Shigemi NMR microtubes.
Cellular uptake of Au(GSH)-TAT
HeLa cells were seeded into 35 mm culture dishes and grown in Dulbecco's Modified Eagle Medium supplemented with 10% fetal bovine serum at 37 °C and in a 5% CO2 atmosphere. After 24 h, the cells were washed three times with PBS and incubated for 1 h with either Au(GSH) or Au(GSH)-TAT (1 mL, 2 μM). Following incubation of the cells with the AuNPs, they were washed five times with PBS and fixed with 2.5% glutaraldehyde (Electron Microscopy Sciences) for 30 min. After fixation, the cells were dehydrated in a graded series of water/ethanol and embedded in Epon-Aradite resin (Ted Pella). Following polymerization of the resin at 60 °C for 2 days, 50 nm-thick sections were cut using a Leica EM UC6 Ultramicrotome. No heavy-metal contrast agents were added to the preparation at any time.
In vitro cytotoxicity
The cytotoxicity of the nanoparticles against HeLa cells was assessed by a Trypan Blue exclusion assay. Cells grown in 6-well plates for 24h were treated with different AuNP concentrations (0 to 10 μM) for 1 and 5h, after which they were washed with PBS and incubated back in media. After 24h, the cells were detached from the well plates with trypsin, centrifuged, and the supernatant discarded. The cells were then resuspended back in PBS and mixed with a 0.4% Trypan Blue stock solution at a 1:1 (v/v) ratio. After incubation for 2 min, 20 μL of the solution was loaded into a haemocytometer, and cell viability was calculated as the ratio of cells without blue staining to the total number of cells (approximately 2.3 × 10⁵ cells for each well).
Acknowledgments
We thank Kevin Brown and Vladimir Majerciak for providing cells, M. Mendonca for helping with the cytotoxicity assay, and X. Chen, K. Jacobsen, H. Kalish, H. Bryant, M. Swierczewska and A. Bhirde for providing access to instrumentation. This work was supported by the intramural programs of NIBIB and NCI, NIH.
References
- 1.Duncan B, Kim C, Rotello VM. J. Control. Release. 2010;148:122. doi: 10.1016/j.jconrel.2010.06.004. [DOI] [PMC free article] [PubMed] [Google Scholar]
- 2.Rana S, Bajaj A, Mout R, Rotello VM. Adv. Drug Deliv. Rev. doi: 10.1016/j.addr.2011.08.006. DOI: 10.1016/j.addr.2011.08.00. [DOI] [PMC free article] [PubMed] [Google Scholar]
- 3.Kim C, Agasti SS, Zhu Z, Isaacs L, Rotello VM. Nat. Chemistry. 2010;2:962. doi: 10.1038/nchem.858. [DOI] [PMC free article] [PubMed] [Google Scholar]
- 4.Giljohann DA, Seferos DS, Daniel WL, Massich MD, Patel PC, Mirkin CA. Angew. Chem. Int. Ed. 2010;49:3280. doi: 10.1002/anie.200904359. [DOI] [PMC free article] [PubMed] [Google Scholar]
- 5.Boisselier E, Astruc D. Chem. Soc. Rev. 2009;38:1759. doi: 10.1039/b806051g. [DOI] [PubMed] [Google Scholar]
- 6.Dreaden EC, Mackey MA, Huang X, Kangy B, El-Sayed MA. Chem. Soc. Rev. 2011;40:3391. doi: 10.1039/c0cs00180e. [DOI] [PMC free article] [PubMed] [Google Scholar]
- 7.Levy R, Shaheen U, Cesbron Y, See V. Nano Reviews. 2010;1:4889. doi: 10.3402/nano.v1i0.4889. [DOI] [PMC free article] [PubMed] [Google Scholar]
- 8.Chou LYT, Ming K, Chan WCW. Chem. Soc. Rev. 2011;40:233. doi: 10.1039/c0cs00003e. [DOI] [PubMed] [Google Scholar]
- 9.Tkachenko AG, Xie H, Liu Y, Coleman D, Ryan J, Glomm WR, Shipton MK, Franzen S, Feldheim DL. Bioconj. Chem. 2004;15:482. doi: 10.1021/bc034189q. [DOI] [PubMed] [Google Scholar]
- 10.Cho EC, Xie J, Wurm PA, Xia Y. Nano Lett. 2009;9:1080. doi: 10.1021/nl803487r. [DOI] [PubMed] [Google Scholar]
- 11.Lund T, Callaghan MF, Williams P, Turmaine M, Bachmann C, Rademacher T, Roitt IM, Bayford R. Biomaterials. 2011;32:9776. doi: 10.1016/j.biomaterials.2011.09.018. [DOI] [PubMed] [Google Scholar]
- 12.Jiang W, Kim BYS, Rutka JT, Chan WCW. Nat. Nanotech. 2008;3:145. doi: 10.1038/nnano.2008.30. [DOI] [PubMed] [Google Scholar]
- 13.Kumari A, Yadav SK. Expert Opin. Drug Deliv. 2011;8:141. doi: 10.1517/17425247.2011.547934. [DOI] [PubMed] [Google Scholar]
- 14.Chithrani DB. Mol. Membrane Biol. 2010;27:199. doi: 10.3109/09687688.2010.507787. [DOI] [PubMed] [Google Scholar]
- 15.Verma A, Uzun O, Hu Y, Hu Y, Han H-S, Watson N, Chen S, Irvine DJ, Stellacci F. Nat. Materials. 2008;7:588. doi: 10.1038/nmat2202. [DOI] [PMC free article] [PubMed] [Google Scholar]
- 16.Zhou C, Long M, Qin Y, Sun X, Zheng J. Angew. Chem. Int. Ed. 2011;50:3168. doi: 10.1002/anie.201007321. [DOI] [PMC free article] [PubMed] [Google Scholar]
- 17.Zhang X, Chibli H, Mielke R, Nadeau J. Bioconj. Chem. 2011;22:235. doi: 10.1021/bc100374p. [DOI] [PubMed] [Google Scholar]
- 18.Hainfeld JF, Slatkin DN, Focella TM, Smilowitz HM. British J. Radiol. 2006;79:248. doi: 10.1259/bjr/13169882. [DOI] [PubMed] [Google Scholar]
- 19.Kumar A, Ma H, Zhang X, Huang K, Jin S, Liu J, Wei T, Cao W, Zou G, Liang X-J. Biomaterials. 2012;33:1180. doi: 10.1016/j.biomaterials.2011.10.058. [DOI] [PubMed] [Google Scholar]
- 20.Simpson CA, Agrawal AC, Balinski A, Harkness KM, Cliffel DE. ACS Nano. 2011;5:3577. doi: 10.1021/nn103148x. [DOI] [PMC free article] [PubMed] [Google Scholar]
- 21.Oh E, Delehanty JB, Sapsford KE, Susumu K, Goswami R, Blanco-Canosa JB, Dawson PE, Granek J, Shoff M, Zhang Q, Goering PL, Huston A, Medintz IL. ACS Nano. 2011;5:6434. doi: 10.1021/nn201624c. [DOI] [PubMed] [Google Scholar]
- 22.Brust M, Walker M, Bethell D, Schiffrin DJ, Whyman R. J. Chem. Soc., Chem. Commun. 1994;7:801. [Google Scholar]
- 23.Walter M, Akola J, Lopez-Acevedo O, Jadzinsky PD, Calero G, Ackerson CJ, Whetten RL, Grönbeck H, Häkkinen H. Proc. Natl. Acad. Sci. USA. 2008;105:9157. doi: 10.1073/pnas.0801001105. [DOI] [PMC free article] [PubMed] [Google Scholar]
- 24.Heaven MW, Dass A, White PS, Holt KM, Murray RW. J. Am. Chem. Soc. 2008;130:3754. doi: 10.1021/ja800561b. [DOI] [PubMed] [Google Scholar]
- 25.Jadzinsky PD, Calero G, Ackerson CJ, Bushnell DA, Kornberg RD. Science. 2007;318:430. doi: 10.1126/science.1148624. [DOI] [PubMed] [Google Scholar]
- 26.Ackerson CJ, Jadzinsky PD, Sexton JZ, Bushnell DA, Kornberg RD. Bioconj. Chem. 2010;21:214. doi: 10.1021/bc900135d. [DOI] [PMC free article] [PubMed] [Google Scholar]
- 27.Chaki NK, Negishi Y, Tsunoyama H, Shichibu Y, Tsukuda T. J. Am. Chem. Soc. 2008;130:8608. doi: 10.1021/ja8005379. [DOI] [PubMed] [Google Scholar]
- 28.Negishi Y, Nobusada K, Tsukuda T. J. Am. Chem. Soc. 2005;127:5261. doi: 10.1021/ja042218h. [DOI] [PubMed] [Google Scholar]
- 29.Li Y, Zaluzhna O, Tong YJ. Chem. Commun. 2011;47:6033. doi: 10.1039/c1cc11642h. [DOI] [PubMed] [Google Scholar]
- 30.Choi HS, Liu W, Misra P, Tanaka E, Zimmer JP, Ipe BI, Bawendi MG, Frangioni JV. Nat. Biotech. 2007;25:1165. doi: 10.1038/nbt1340. [DOI] [PMC free article] [PubMed] [Google Scholar]
- 31.Lees EE, Gunzburg MJ, Nguyen T-L, Howlett GJ, Rothacker J, Nice EC, Clayton AHA, Mulvaney P. Nano Lett. 2008;8:2883. doi: 10.1021/nl801629f. [DOI] [PubMed] [Google Scholar]
- 32.Ackerson CJ, Powell RD, Hainfeld JF. In: Cryo-EM Part A Sample Preparation and Data Collection. Jensen G, editor. Ch. 9. Elsevier; 2010. [Google Scholar]
- 33.Levi-Kalisman Y, Jadzinsky PD, Kalisman N, Tsunoyama H, Tsukuda T, Bushnell DA, Kornberg RD. J. Am. Chem. Soc. 2011;133:2976. doi: 10.1021/ja109131w. [DOI] [PubMed] [Google Scholar]
- 34.Bowman M-C, Ballard E, Ackerson CJ, Feldheim DL, Margolis DM, Melander C. J. Am. Chem. Soc. 2008;130:6896. doi: 10.1021/ja710321g. [DOI] [PMC free article] [PubMed] [Google Scholar]
- 35.Hostetler MJ, Templeton AC, Murray RW. Langmuir. 1999;15:3782. [Google Scholar]
- 36.Porter AE, Knowles TPJ, Muller K, Meehan S, McGuire E, Skepper J, Welland ME, Dobson CM. J. Mol. Biol. 2009;392:868. doi: 10.1016/j.jmb.2009.07.061. [DOI] [PubMed] [Google Scholar]
- 37.Wang ZW, Toikkanen O, Yin F, Li ZY, Quinn BM, Palmer RE. J. Am. Chem. Soc. 2010;132:2854. doi: 10.1021/ja909598g. [DOI] [PubMed] [Google Scholar]
- 38.Young NP, Li ZY, Chen Y, Palomba S, Vece MD, Palmer RE. Phys. Rev. Lett. 2008;101:246103. doi: 10.1103/PhysRevLett.101.246103. [DOI] [PubMed] [Google Scholar]
- 39.Sousa AA, Hohmann-Marriott M, Aronova MA, Zhang G, Leapman RD. J. Struct. Biol. 2008;162:14. doi: 10.1016/j.jsb.2008.01.007. [DOI] [PMC free article] [PubMed] [Google Scholar]
- 40.Menard LD, Gao S-P, Xu H, Twesten RD, Harper AS, Song Y, Wang G, Douglas AD, Yang JC, Frenkel AI, Nuzzo RG, Murray RW. J. Phys. Chem. B. 2006;110:12874. doi: 10.1021/jp060739g. [DOI] [PubMed] [Google Scholar]
- 41.Wall JS. J. Struct. Biol. 1999;127:161. doi: 10.1006/jsbi.1999.4148. [DOI] [PubMed] [Google Scholar]
- 42.Calabretta M, Jamison JA, Falkner JC, Liu Y, Yuhas BD, Matthews KS, Colvin VL. Nano Lett. 2005;5:963. doi: 10.1021/nl047926f. [DOI] [PubMed] [Google Scholar]
- 43.Falabella JB, Cho TJ, Ripple DC, Hackley VA, Tarlov MJ. Langmuir. 2010;26:12740. doi: 10.1021/la100761f. [DOI] [PubMed] [Google Scholar]
- 44.Zook JM, Rastogi V, MacCuspie RI, Keene AM, Fagan J. ACS Nano. 2011;5:8070. doi: 10.1021/nn202645b. [DOI] [PubMed] [Google Scholar]
- 45.Sawant R, Torchilin V. Mol. BioSyst. 2009;6:628. doi: 10.1039/b916297f. [DOI] [PubMed] [Google Scholar]
- 46.Hostetler MJ, Wingate JE, Zhong C-J, Harris JE, Vachet RW, Clark MR, David Londono J, Green SJ, Stokes JJ, Wignall GD, Glish GL, Porter MD, Evans Neal D., Murray RW. Langmuir. 1998;14:17. [Google Scholar]
- 47.Hainfeld JF, Furuya FR. J. Histochem. Cytochem. 1992;40:177. doi: 10.1177/40.2.1552162. [DOI] [PubMed] [Google Scholar]
- 48.Walter M, Moseler M, Whetten RL, Häkkinen H. Chem. Sci. 2011;2:1583. [Google Scholar]
- 49.Carney RP, Kim JY, Qian H, Jin R, Mehenni H, Stellacci F, Bakr OM. Nat. Commun. 2011;2 doi: 10.1038/ncomms1338. [DOI] [PMC free article] [PubMed] [Google Scholar]
- 50.Guo R, Song Y, Wang G, Murray RW. J. Am. Chem. Soc. 2005;127:2752. doi: 10.1021/ja044638c. [DOI] [PubMed] [Google Scholar]
- 51.Schaaff TG, Whetten RL. J. Phys. Chem. B. 1999;103:9394. [Google Scholar]
- 52.Wu Z, Jin R. ACS Nano. 2009;3:2036. doi: 10.1021/nn9004999. [DOI] [PubMed] [Google Scholar]
- 53.Krpetic Z, Saleemi S, Prior IA, See V, Qureshi R, Brust M. ACS Nano. 2011;5:5195. doi: 10.1021/nn201369k. [DOI] [PubMed] [Google Scholar]
- 54.Berry CC. Nanomedicine. 2008;3:357. doi: 10.2217/17435889.3.3.357. [DOI] [PubMed] [Google Scholar]
- 55.Fuente JM, Berry CC. Bioconj. Chem. 2005;16:1176. doi: 10.1021/bc050033+. [DOI] [PubMed] [Google Scholar]
- 56.Delehanty JB, Bradburne CE, Boeneman K, Susumu K, Farrell D, Mei BC, Blanco-Canosa JB, Dawson G, Dawson PE, Mattoussi H, Medintz IL. Integr. Biol. 2010;2:265. doi: 10.1039/c0ib00002g. [DOI] [PubMed] [Google Scholar]
- 57.Nativo P, Prior IA, Brust M. ACS Nano. 2008;2:1639. doi: 10.1021/nn800330a. [DOI] [PubMed] [Google Scholar]
- 58.Swierczewska M, Lee S, Chen X. Phys. Chem. Chem. Phys. 2011;13:9929. doi: 10.1039/c0cp02967j. [DOI] [PMC free article] [PubMed] [Google Scholar]
- 59.Chowdhury S, Wu Z, Jaquins-Gerstl A, Liu S, Dembska A, Armitage BA, Jin R, Peteanu LA. J. Phys. Chem. C. 2011;115:20105. doi: 10.1021/jp204836w. [DOI] [PMC free article] [PubMed] [Google Scholar]
- 60.Cheng PPH, Silvester D, Wang G, Kalyuzhny G, Douglas A, Murray RW. J. Chem. Phys. B. 2006;110:4637. doi: 10.1021/jp057028n. [DOI] [PubMed] [Google Scholar]
- 61.He W, Kivork C, Machinani S, Morphew MK, Gail AM, Tesar DB, Tiangco NE, McIntosh R, Bjorkman PJ. J. Struct. Biol. 2007;107:103. doi: 10.1016/j.jsb.2007.07.004. [DOI] [PMC free article] [PubMed] [Google Scholar]
- 62.Brandenberger C, Clift MJ, Vanhecke D, Mühlfeld C, Stone V, Gehr P, Rothen-Rutishauser B. Particle and Fibre Toxicology. 2010;7:15. doi: 10.1186/1743-8977-7-15. [DOI] [PMC free article] [PubMed] [Google Scholar]
- 63.Wingard CJ, Walters DM, Cathey BL, Hilderbrand SC, Katwa P, Lin S, Ke PC, Podila R, Rao A, Lust RM, Brown JM. Nanotoxicology. 2010;5:531. doi: 10.3109/17435390.2010.530004. [DOI] [PMC free article] [PubMed] [Google Scholar]
- 64.Peckys DB, Jonge N. d. Nano Lett. 2011;11:1733. doi: 10.1021/nl200285r. [DOI] [PMC free article] [PubMed] [Google Scholar]
- 65.Dubavik A, Sezgin E, Lesnyak V, Gaponik N, Schwille P, Eychmuller A. ACS Nano. doi: 10.1021/nn204930y. DOI: 10.1021/nn204930y. [DOI] [PubMed] [Google Scholar]
- 66.Wang T, Bai J, Jiang X, Nienhaus GU. ACS Nano. 2012;6:1251. doi: 10.1021/nn203892h. [DOI] [PubMed] [Google Scholar]
- 67.Jonge N. d., Poirier-Demers N, Demers H, Peckys DB, Drouin D. Ultramicroscopy. 2010;110:1114. doi: 10.1016/j.ultramic.2010.04.001. [DOI] [PMC free article] [PubMed] [Google Scholar]
- 68.Aronova MA, Sousa AA, Zhang G, Kruhlak MJ, Lei E, Leapman RD. Microsc. Microanal. 2009;15:920. [Google Scholar]
- 69.Gregori L, Hainfeld JF, Simon MN, Goldgaber D. J. Biol. Chem. 1997;272:58. doi: 10.1074/jbc.272.1.58. [DOI] [PubMed] [Google Scholar]
- 70.Hernández-Garrido JC, Yoshida K, Gai PL, Boyes ED, Christensen CH, Midgley PA. Catalysis Today. 2011;160:165. [Google Scholar]
- 71.Brown PH, Balbo A, Schuck P. Curr. Protoc. Immunol. 2008;(Unit 18.15) doi: 10.1002/0471142735.im1815s81. [DOI] [PubMed] [Google Scholar]
- 72.Schuck P. Biophys. J. 2000;78:1606. doi: 10.1016/S0006-3495(00)76713-0. [DOI] [PMC free article] [PubMed] [Google Scholar]
- 73.Planken KL, Cölfen H. Nanoscale. 2010;2:1849. doi: 10.1039/c0nr00215a. [DOI] [PubMed] [Google Scholar]


