

Abstract
The electroencephalogram (EEG) is a mainstay of clinical neurology and is tightly correlated with brain function, but the specific currents generating human EEG elements remain poorly specified because of a lack of microphysiological recordings. The largest event in healthy human EEGs is the K-complex (KC), which occurs in slow-wave sleep. Here, we show that KCs are generated in widespread cortical areas by outward dendritic currents in the middle and upper cortical layers, accompanied by decreased broadband EEG power and decreased neuronal firing, which demonstrate a steep decline in network activity. Thus, KCs are isolated “down-states,” a fundamental cortico-thalamic processing mode already characterized in animals. This correspondence is compatible with proposed contributions of the KC to sleep preservation and memory consolidation.
Although the electroencephalogram (EEG) is known to directly and instantaneously reflect synaptic and active transmembrane neuronal currents, the specific channels, synapses, and circuits that generate particular EEG elements in humans remain poorly specified. Much of the EEG is composed of repeated wave forms with characteristic morphologies, durations, amplitudes, frequency content, evoking events, and background states (1). The largest of these EEG “graphoelements” is the KC, characterized by a short surface-positive transient followed by a slower, larger surface-negative complex with peaks at 350 and 550 ms, and then a final positivity peaking near 900 ms, followed sometimes by 10- to 14-Hz “spindles” (2-4). KCs occur in non–rapid-eye-movement (non-REM) sleep, especially stage 2. Deeper sleep (stages 3 to 4) is characterized by slow waves, demonstrated in extensive animal studies to consist of a “slow oscillation” between periods of intense firing by both excitatory and inhibitory cortical neurons (termed “up-states”) and periods of neuronal silence (“down-states”) (5-9). Using micro- and macro-electrode arrays placed in patients undergoing evaluation for epilepsy (10), we demonstrate that the microphysiological characteristics of human KCs appear identical to those of down-states recorded in the same patients.
Typical KCs were recorded in eight patients (11). KCs were either spontaneous or evoked by a weak auditory stimulus. Within a given patient, the basic KC wave forms were similar regardless of whether they were recorded at the scalp or intracranially (Fig. 1A). In all cases, the wave form was dominated by a large deflection occurring ~500 to 600 ms after the onset of a stimulus, or after the onset of the initial deflection for spontaneous KCs. Characteristic KC wave forms were recorded by subdural electrodes placed on all cortical lobes, demonstrating widespread generation (Fig. 1B). In all scalp and most intracranial sites, this deflection was surface-negative. Different KCs recorded in the same patient varied in their relative size and timing across cortical locations (Fig. 1C). That is, KCs were not completely synchronous across the cortical surface, nor were the direction or duration of the transcortical delays constant across different KCs.
Fig. 1.
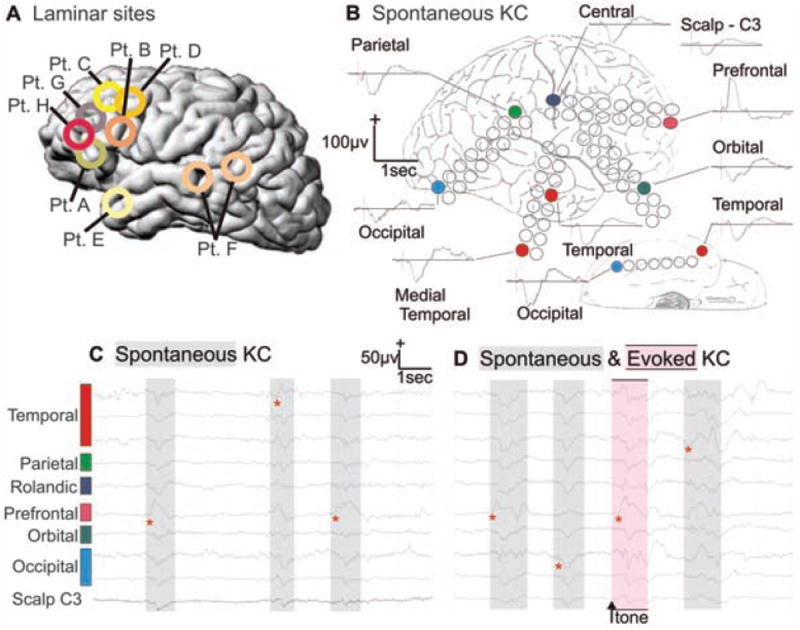
Spontaneous and evoked KCs recorded simultaneously from the surface of all cortical lobes. (A) Approximate locations of microelectrode arrays in the eight patients (Pt.) studied. (B) Averaged spontaneous KCs recorded with grid electrodes in multiple cortical locations and from the scalp (subject E). Unaveraged spontaneous (C and D) and evoked (D) KCs from the same electrodes. Red asterisks show earliest deflection during the KCs and demonstrate the variability in onset and spread. Sleep stages and KCs were identified during natural sleep with standard criteria (27). KCs were evoked with occasional tones. Subdural electrode arrays were placed to confirm the hypothesized seizure focus and to locate epileptogenic tissue in relation to essential cortex, so as to direct surgical treatment.
Potential gradients across cortical layers during KCs were recorded during these same events by using linear arrays of microelectrodes in temporal, frontal, and parietal sites (Fig. 1A). In all cases, KCs seen on the scalp electrodes were also observed on microelectrodes of the array and vice versa. Spontaneous and evoked KCs were recorded in four patients. They showed similar wave-form characteristics and distribution (Figs. 1D and 2), with the maximal negative response present on the same recording channel. No significant differences were found in the peak amplitude or area under the curve during this peak between spontaneous and evoked KCs (t test and Kolmogorov-Smirnov test; powered ≥0.80 to detect a 20% difference at P < 0.05).
Fig. 2.
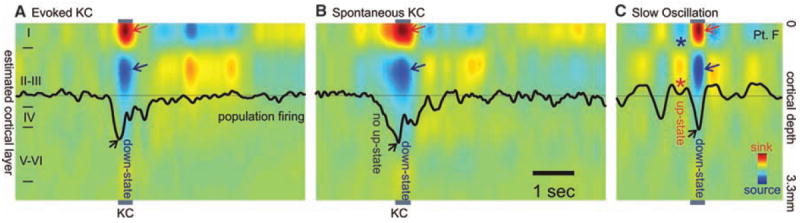
Population transmembrane currents and neuronal firing in different cortical layers during single evoked (A) and spontaneous (B) KC in stage 2 sleep, and (C) during the slow oscillation in stage 3 to 4 sleep. Evoked and spontaneous KC and the slow-oscillation down-state are all characterized by outward currents (sources) in cortical layers II to III (blue arrows), paired with inward currents (sinks) near the cortical surface (red arrows), and decreased neuronal firing (black arrows). Unlike the KC, the slow-oscillation down-state is embedded in rhythmic alternation with up-states consisting of layer II/III sinks (*), layer I sources (*), and increased firing. Patient F.
Current source density calculated from these data showed a consistent pattern for both spontaneously occurring and triggered KCs. During the surface-negative slow deflection, there was a current sink in the channels closest to the cortical surface, whereas a substantial source was present in middle channels ~450 to 600 μm below the sink. This pattern, observed in all subjects, likely corresponds to a passive sink centered in layer I and an active source centered in layer III (Figs. 2, A and B, and 3A1). Successful recordings of multiunit neuronal firing were obtained in four subjects, all of whom showed decreased firing during the surface-negative slow deflection of either spontaneous or evoked KCs (Figs. 2, A and B, and 3A2). The pattern of sinks and sources and the decreased neuronal firing changes described here indicate hyperpolarizing current flow in layer III during the large surface-negative deflection.
Fig. 3.
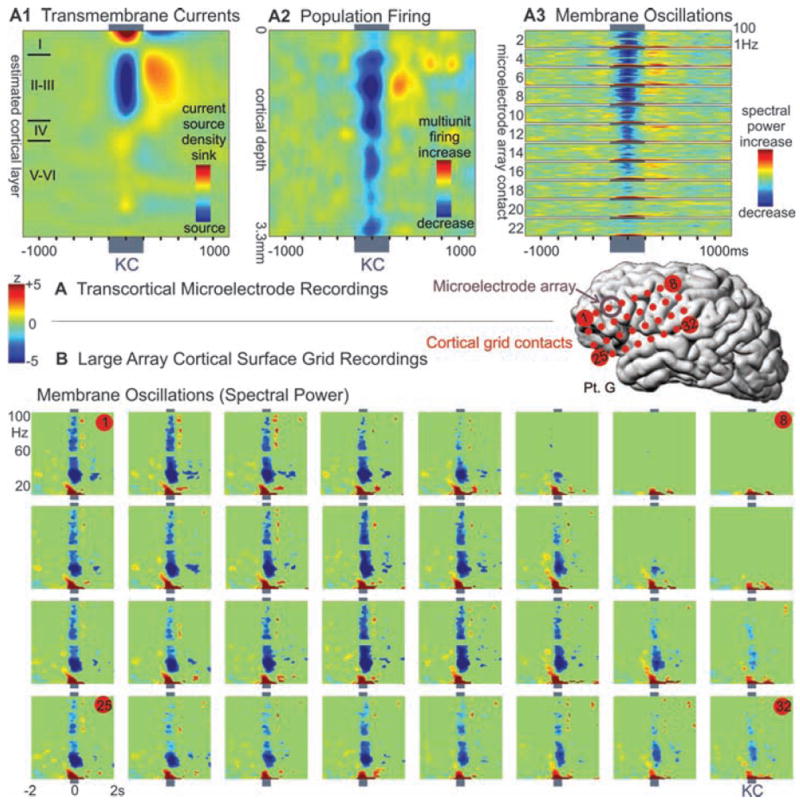
Decrement in population firing and high-frequency membrane oscillations during KC. (A) Microelectrode array recordings of (A1) averaged spontaneous KCs show a layer III source, (A2) decreased neuronal firing, and (A3) membrane oscillations (higher-frequency spectral power), in all layers, especially upper layers. (B) Simultaneous recordings in the same patient from a large grid array of electrodes on the cortical surface also show a decrease in high-frequency spectral power during KC. Plots are set to the same threshold to show significant (P < 0.01) spectral power changes compared with a period of 1500 to 250 ms before the KC.
Analysis of the spectral content of both spontaneous and evoked events consistently demonstrated a broadband decrease in the activity during the surface-negative event in multiple cortical layers when we used microelectrodes and in multiple locations with subdural macro-electrodes (Fig. 3). This was particularly pronounced for higher-frequency (gamma) activity from 20 to 100 Hz; low-frequency components—representing the wave form itself—were often maintained. High frequencies could remain depressed past resolution of the negative deflection. In six subjects, higher-frequency power briefly increased at KC onset. However, in no case was the surface-negative slow event preceded by rhythmic modulations of current or gamma power.
This study provides strong evidence that KCs are induced cortical down-states. First, our recordings demonstrate that KCs are generated in widespread cortical locations. Previous extracranial EEG (12), magnetoencephalogram (MEG) (13), and intracranial EEG recordings (14, 15) have not provided unambiguous localization of KC generators because of difficulties in localizing widely distributed sources. Local KC generation near the electrode contact is highly likely in our recordings from the cortical surface and is certain when steep gradients are recorded at 150-μm intervals with microelectrode arrays. Widespread intracortical generation of KCs is consistent with the generation of down-states in lower mammals, which arise in distributed cortico-cortical networks (16).
The current study also demonstrates that KCs in humans are associated with strong and consistent decreases in gamma and multiunit activity, similar to those observed in animals during the down-state and indicating widespread decreases in cortical activity (5, 6, 8, 9, 17). Direct confirmation of identical microphysiology was obtained in our subjects by comparing KC and slow-oscillation down-states recorded within the same sleep session and by the same microelectrode arrays (Fig. 2). Even at the 150-μm resolution of these recordings, the two conditions evoke identical laminar distributions of transmembrane currents (correlation coefficient at the peak of the deflection was 0.95 between spontaneous KC and slow waves and 0.96 between evoked KC and slow waves, with P < 10−12 for both). The indices of network synaptic activity (gamma power) and of population firing (multiunit activity) were both decreased during the KC in all cortical layers, but especially in the supragranular layers, as is characteristic of the slow-oscillation down-state (Fig. 3). Finally, although various inhibitory processes in the cortex have a wide range of durations, from less than 20 ms to several seconds, the KC and slow-oscillation down-states both last ~400 ms.
Although the data thus strongly support the proposal of Amzica and Steriade (7) that the KC reflects a cortical down-state, it does not support their corollary proposal that the KC is always part of an underlying oscillation (18). Rather, our evidence indicates that, at both the intracortical and epicortical levels, isolated KCs are the rule rather than the exception during stage 2 sleep. This is consistent with numerous observations over the past 70 years (2-4). Also consistent with these previous studies, but in contrast with Amzica and Steriade (7), we found the major component of KCs to be surface-negative.
The down-state is characterized by hyper-polarizing potassium currents, as well as low synaptic activity (6). The lack of a local up-state preceding the KC may pose difficulties for the proposal that an activity-dependent accumulation of calcium or adenosine diphosphate (ADP) triggers a potassium current and, thus, the downstate (19-21). Our findings, as well as recent evidence that the onset of the down-state is more synchronous than that of the up-state (16), suggest the need for additional synchronizing mechanisms, for instance, cortico-thalamo-cortical interactions, as have been shown for the sleep spindle (22). For example, in the tone-evoked KC, initial medial geniculate and auditory cortex activation could trigger a local down-state that spreads via thalamo-cortical and cortico-cortical connections. KCs would then occur spontaneously because of a similar mechanism, only with the sensory stimulus occult to the investigator (e.g., gastric), or because of a spontaneous burst of cortical activity. Thus, the KC down-state may follow an up-state, but only in the initiating zone. Our finding that successive KCs arise in variable cortical locations (Fig. 1D), which confirmed scalp recordings (12) and computational models (19), is consistent with this interpretation.
Sleep is thought to perform essential restorative and mnestic functions (23). Maintaining sleep is therefore crucial, but so is awakening in the face of danger. Our finding that the KC represents an isolated down-state supports the theory that it suppresses cortical activity and, thus, arousal in response to stimuli that are judged by the sleeping brain not to be dangerous (3, 4). Increasing evidence supports a strong contribution to memory consolidation of stage 2 sleep, characterized by KC and spindles (24). The cortical down-state may provide a period when the near absence of neural activity induces a blanket suppression of synaptic strengths, balancing the synaptic enhancement occurring during waking and up-states and thus preserving the signal-to-noise ratio in network representations (25). In addition, during the recovery from the down-state, cortical firing “reboots” in a systematic order, which allows the potential for engrams encoded in dynamic assemblies of neuronal firing to be repeatedly practiced and thus consolidated (26). The current study ties a universal, normal, prominent, easily-observed EEG phenomenon to its underlying substrate of membrane currents and neuronal circuits through direct observation and homology with animal studies. This allows previous observations relating human sleep EEG to memory and sensory arousal to be interpreted within mechanistic neural models.
Supplementary Material
Materials and Methods
Fig. S1
Table S1
References
Acknowledgments
Supported by National Institute of Neurogical Disorders and Stroke (NIH) grants NS18741 and NS44623 to E.H. and Neuroprobes IST-027017, OTKA49122, ETT135/2006, János Szentágothai Knowledge Center RET 05/2004 grants to I.U. We thank L. Papp for technical support; and L. Grand, A. Magony, B. Dombovári, and D. Fabó for support in data analysis and recording. The authors dedicate this work to the memory of Edward Bromfield, who passed away on 10 May 2009.
Footnotes
Supporting Online Material
References and Notes
- 1.Buzsaki G. Rhythms of the Brain. Oxford Univ. Press; Oxford: 2006. [Google Scholar]
- 2.Loomis AL, Harvey EN, Hobart G. J Neurophysiol. 1938;13(suppl):231. [Google Scholar]
- 3.Colrain IM. Sleep. 2005;28:255. doi: 10.1093/sleep/28.2.255. [DOI] [PubMed] [Google Scholar]
- 4.Halasz P. Sleep Med Rev. 2005;9:391. doi: 10.1016/j.smrv.2005.04.003. [DOI] [PubMed] [Google Scholar]
- 5.Steriade M, Amzica F, Nunez A. J Neurophysiol. 1993;70:1385. doi: 10.1152/jn.1993.70.4.1385. [DOI] [PubMed] [Google Scholar]
- 6.Contreras D, Timofeev I, Steriade M. J Physiol. 1996;494:251. doi: 10.1113/jphysiol.1996.sp021488. [DOI] [PMC free article] [PubMed] [Google Scholar]
- 7.Amzica F, Steriade M. Neuroscience. 1998;82:671. doi: 10.1016/s0306-4522(97)00319-9. [DOI] [PubMed] [Google Scholar]
- 8.Sanchez-Vives MV, McCormick DA. Nat Neurosci. 2000;3:1027. doi: 10.1038/79848. [DOI] [PubMed] [Google Scholar]
- 9.Timofeev I, Grenier F, Steriade M. Proc Natl Acad Sci U S A. 2001;98:1924. doi: 10.1073/pnas.041430398. [DOI] [PMC free article] [PubMed] [Google Scholar]
- 10.Ulbert I, Halgren E, Heit G, Karmos G. J Neurosci Methods. 2001;106:69. doi: 10.1016/s0165-0270(01)00330-2. [DOI] [PubMed] [Google Scholar]
- 11.Materials and methods are available as supporting material on Science Online.
- 12.Massimini M, Huber R, Ferrarelli F, Hill S, Tononi G. J Neurosci. 2004;24:6862. doi: 10.1523/JNEUROSCI.1318-04.2004. [DOI] [PMC free article] [PubMed] [Google Scholar]
- 13.Numminen J, Makela JP, Hari R. Electroencephalogr Clin Neurophysiol. 1996;99:544. doi: 10.1016/s0013-4694(96)95712-0. [DOI] [PubMed] [Google Scholar]
- 14.Velasco M, et al. Clin Neurophysiol. 2002;113:25. doi: 10.1016/s1388-2457(01)00707-6. [DOI] [PubMed] [Google Scholar]
- 15.Wennberg RA, Lozano AM. Clin Neurophysiol. 2003;114:1403. doi: 10.1016/s1388-2457(03)00152-4. [DOI] [PubMed] [Google Scholar]
- 16.Volgushev M, Chauvette S, Mukovski M, Timofeev I. J Neurosci. 2006;26:5665. doi: 10.1523/JNEUROSCI.0279-06.2006. [DOI] [PMC free article] [PubMed] [Google Scholar]
- 17.Mukovski M, Chauvette S, Timofeev I, Volgushev M. Cereb Cortex. 2007;17:400. doi: 10.1093/cercor/bhj157. [DOI] [PubMed] [Google Scholar]
- 18.Amzica F, Steriade M. Neurology. 1997;49:952. doi: 10.1212/wnl.49.4.952. [DOI] [PubMed] [Google Scholar]
- 19.Bazhenov M, Timofeev I, Steriade M, Sejnowski TJ. J Neurosci. 2002;22:8691. doi: 10.1523/JNEUROSCI.22-19-08691.2002. [DOI] [PMC free article] [PubMed] [Google Scholar]
- 20.Compte A, Sanchez-Vives MV, McCormick DA, Wang XJ. J Neurophysiol. 2003;89:2707. doi: 10.1152/jn.00845.2002. [DOI] [PubMed] [Google Scholar]
- 21.Cunningham MO, et al. Proc Natl Acad Sci U S A. 2006;103:5597. doi: 10.1073/pnas.0600604103. [DOI] [PMC free article] [PubMed] [Google Scholar]
- 22.Contreras D, Destexhe A, Sejnowski TJ, Steriade M. Science. 1996;274:771. doi: 10.1126/science.274.5288.771. [DOI] [PubMed] [Google Scholar]
- 23.Hobson JA, Pace-Schott EF. Nat Rev Neurosci. 2002;3:679. doi: 10.1038/nrn895. [DOI] [PubMed] [Google Scholar]
- 24.Stickgold R. Nature. 2005;437:1272. doi: 10.1038/nature04286. [DOI] [PubMed] [Google Scholar]
- 25.Tononi G, Cirelli C. Sleep Med Rev. 2006;10:49. doi: 10.1016/j.smrv.2005.05.002. [DOI] [PubMed] [Google Scholar]
- 26.Ribeiro S, et al. PLoS Biol. 2004;2:E24. doi: 10.1371/journal.pbio.0020024. [DOI] [PMC free article] [PubMed] [Google Scholar]
- 27.Rechtschaffen A, Kales A. A Manual of Standardized Terminology, Techniques and Scoring System for Sleep Stages of Human Subjects. U.S. Government Printing Office; Washington, DC: 1968. [Google Scholar]
Associated Data
This section collects any data citations, data availability statements, or supplementary materials included in this article.
Supplementary Materials
Materials and Methods
Fig. S1
Table S1
References