

Abstract
Diffusion tensor imaging (DTI) is a new technique that uses the microscopic motion of water molecules to probe tissue three-dimensional (3D) microstructures. In this study, high-resolution DTI was performed on rats bearing intracranial 9L gliosarcoma, F98 glioma, and human glioblastoma. It was found that the tumors consisted of central zones with low diffusion anisotropy and peripheral structures (rim) with high diffusion anisotropy. In the rims, water diffusion directionality formed a circular pattern for the 9L and F98 tumors, and a radial pattern for the human glioblastoma xenografts. These well-organized diffusion patterns appeared at an early stage post-implantation and continued to exist with tumor growth in all three models. High-resolution ex vivo imaging and histology confirmed the in vivo findings. These distinct patterns, undetectable with conventional MRI, may reflect tumor organization and growth patterns at the cellular level.
Keywords: diffusion tensor imaging, DTI, high-resolution, glioma, diffusion pattern, microstructure, growth pattern
Malignant gliomas are the most common primary brain tumors. They are highly infiltrative, with cores of solid tumor (often mixed with necrosis) surrounded by regions of edematous brain infiltrated by tumor cells (1–5). Malignant solid tumors may destroy the brain parenchyma and are often accompanied by endothelial proliferation and the formation of new microvessels. The diagnostic, histologic features of glioblastoma distinctly include tissue necrosis and angiogenesis. Isolated tumor cells can spread very far from the solid tumor mass. Previous studies (1,3,4) have shown that infiltrating brain tumors migrate preferentially along blood vessel and white matter fiber tract pathways. Isolated tumor cells do not destroy the brain parenchyma and are usually not associated with angiogenesis. It is widely recognized that residual tumor cells remain after resection and are the source of tumor recurrence, contributing to the dismal prognosis for primary brain cancers. The local invasion of malignant gliomas ultimately decides the survival time for these patients. Therefore, it is critical to accurately map the growth patterns of malignant gliomas in the brain to aid in the development of therapies that can effectively arrest recurrence and progression.
It is known that the motion of water molecules is anisotropic in several biological tissues, such as brain white matter (6) and muscles (7). The diffusion tensor imaging (DTI) technique (8,9) can characterize the three dimensional (3D) properties of water diffusion in tissue by providing several types of information, including the extent and anisotropy of diffusion, and its predominant orientation. This capability of DTI can be used to detect the existence of well-ordered tissue at the microscopic level. For example, in axonal tracts, where neuronal fibers are coherently arranged and traveling in the same direction, the measured diffusion anisotropy is high and the predominant diffusion orientation is along the direction of fiber trajectories. Because of this, DTI has been used to map white matter tracts in the living brain (10,11) and to detect possible changes within diseased brain (12–18). In recent years, several groups (12–18) have used DTI to study the influence of infiltrating brain tumors on surrounding axonal tracts and to characterize the possible migration of tumor cells along neuronal tracts. Rat brain tumor models have been widely used in experimental neuro-oncology studies. In this study, we demonstrate that the DTI technique, when used under conditions of high spatial resolution, can probe microstructures at the cellular level inside experimental brain tumors, which are not visible with conventional MRI.
MATERIALS AND METHODS
Brain Tumor Models
Three tumor cell lines were used in this study. The F98 and 9L cell lines, originally derived from nitrosourea induced malignancies of glial origin, were cultured as previously described (19). The human Mayo 22 glioblastoma cell line (kindly provided by C. David James, Mayo Clinic, randomly called #22) was established from resected tumor, passaged serially as tumor xenografts, and cultured briefly prior to implantation to rat brain as previously described (20).
All surgical procedures were performed using proper aseptic techniques in a sterile field using sterile equipment. Eleven Fisher 344 rats and six nude rats (male, 200–250 g) were anesthetized by an intraperitoneal (i.p.) injection of 0.2 ml/100 g body weight of 2.5 mg/ml of xylazine and 25 mg/ml of ketamine hydrochloride. Through a small burr hole, tumor cells (25,000 9L gliosarcoma cells or F98 glioma cells in 2 µl per Fisher rat, or 100,000 human glioblastoma cells in 2 µl per nude rat) were stereotactically implanted to right caudate-putamen (3 mm lateral to the bregma and 4.5 mm deep). The scalp was re-approximated and the wound was closed with wound clamps. After surgery, buprenorphine hydrochloride (0.04 mg/kg body weight, i.p.) was used for analgesia. Upon awakening from anesthesia, the animals were returned to the caging area for study at a later time.
Animal Preparation for Imaging
On each day of the MRI measurements, tumor-bearing animals were re-anesthetized with 5% isoflurane in a mixture of 75% air and 25% O2 in a box for about 5 minutes for induction, followed by 1.5–2% isoflurane through a mask during MR imaging. Rats were placed in a specially designed animal holder. To restrain head motions, the animals’ head and body were fixed to the cradle with tape and ear pins. Rats in the magnet were monitored visually online through a small-animal monitoring and gating system connected by fiber optics, and the breathing rate was maintained at 40 ± 5 breaths per minute by adjusting the concentration of isoflurane (1.5–2%). At the end of the MRI study, anesthetized rats were perfused with phosphate buffered saline (PBS) followed by 4% paraformaldehyde, and brains were removed from the skull and preserved in 4% paraformaldehyde at 4 °C for a week for proper tissue fixation. After ex vivo MRI was done, the brains were sectioned, and histological sections (20 microns thick) were stained with hematoxylin and eosin. All the experimental procedures were approved by the Animal Care and Use Committee of the Johns Hopkins University School of Medicine.
In Vivo MRI
Imaging experiments were performed on a 4.7T horizontal bore animal MR system (Bruker Biospin, Billerica, MA) with an actively decoupled cross-coil setup of a 70 mm body coil for radiofrequency (RF) transmission and a 25 mm surface coil for signal reception. In vivo multi-slice images of rat brains were acquired in the horizontal plane (5 slices, slice thickness 1.5 mm, field of view (FOV) = 42 mm × 32 mm). The central imaging slice was set at the center of the tumor using acquired T2-weighted (T2w) localizer images in the coronal plane, and the location of the imaging slices was kept the same (the same distance from the top of the brain) for the same animal in subsequent experiments. High-resolution T2W imaging with fast spin echo (FSE) acquisition was acquired (echo train length = 4, repetition time (TR) = 3 s, echo time (TE) = 64 ms, matrix = 256 × 192, resolution = 0.16 mm × 0.17 mm, number of average (NA) = 2). Diffusion tensor images were acquired using a multiple-slice, multiple-spin echo diffusion-weighted (DW) sequence (TR = 2 s, four echoes with TEs of 26.3/36.7/47.1/57.5 ms, matrix = 128 × 96, resolution = 0.33 mm × 0.33 mm, NA = 4). Trapezoidal diffusion gradients were used (Δ = 14 ms, δ = 5 ms, gradient rise time = 0.4 ms, gradient strength = 14 Gauss/cm). No eddy current compensation was employed, and the acquired images showed no apparent eddy current artifact. Seven DW images with different b values were acquired (one image with b value = 50 s/mm2 and the rest with b value = 1000 s/mm2). Diffusion sensitizing gradients were applied along six different orientations: [0.707, 0.707, 0], [0.707, 0, 0.707], [0, 0.707, 0.707], [−0.707, 0.707, 0], [0.707, 0, −0.707], [0, −0.707, 0.707]. The images with the different TE values were averaged to improve the signal-to-noise ratio. The total imaging time for each animal was approximately 2 hours. For each animal, the MRI study was performed 2–3 times on different post-implantation days.
Ex Vivo MRI
One week after in vivo MRI, the brain samples were transferred into phosphate-buffered saline. Ex vivo DW images were acquired on a 9.4T NMR spectrometer using a 3D multiple-spin echo DW sequence, with the following imaging parameters: TR = 700 ms; TE = 30 ms; echo train length = 6; FOV = 26 mm × 13 mm × 13 mm; matrix = 160 × 82 × 82; resolution = 0.16 mm × 0.16 mm × 0.16 mm; and NA = 2. Seven DW images were acquired with the same diffusion parameters as in vivo MRI. T2W images were acquired using a FSE sequence with the following imaging parameters: TR = 900 ms; TE = 50 ms; excitation pulse flip angle of 40°; NA = 4; and the same FOV and imaging matrix as the DW images. The total imaging time for each animal was about 20 hours.
Image Processing
The DTI data was processed in DTI Studio (developed by Dr. Hangyi Jiang and Dr. Susumu Mori; for more information, see http://mri.kennedykrieger.org). The diffusion tensors (D̿) were calculated using a log-linear fitting method. Three pairs of eigenvalues (λ1, λ2, and λ3) and eigenvectors (V1, V2, and V3) were calculated for each pixel (21). The eigenvector associated with the largest eigenvalue was referred to as the primary eigenvector (V1). Isotropic apparent diffusion coefficient (ADC) and fractional anisotropy (FA) (9) were calculated according to:
| [1] |
| [2] |
The orientation information was visualized through directionally encoded color (DEC) images (22), which were generated by combining the images of the primary eigenvector (V1) and FA into RGB images. In this study, red was assigned to the medial-lateral orientation, green to the rostral-caudal orientation, and blue to the superior-inferior orientation. In the DEC images, the ratios among the green, red, and blue components of each pixel were defined by the ratios of the x, y, and z components of the primary eigenvector, and the intensity was proportional to the FA. The orientation information was also visualized by vector images, in which the measured V1 at each pixel was visualized by a small line segment overlaid on DEC images, with the length of the line segment proportional to the FA value.
RESULTS
Water Diffusion Patterns in Tumors in Vivo
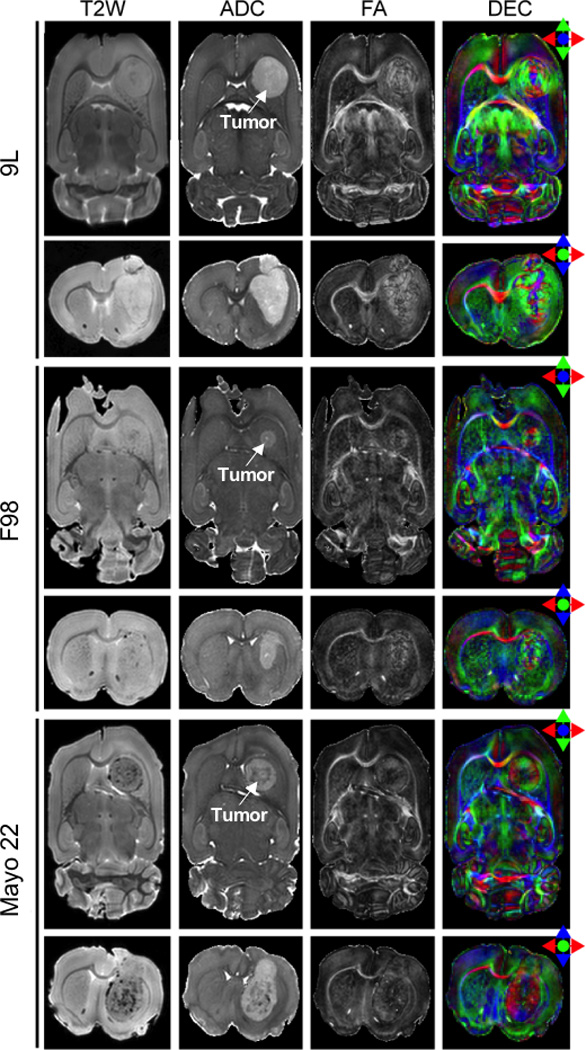
Figure 1 shows typical in vivo MR images from the three different brain tumor models, 9L, F98, and Mayo 22. In the T2W images and ADC maps, regions with tumors had higher signal intensities than the striatum on the contralateral side. These results are consistent with previous reports (23), which show increases in T2 and ADC values in tumors. Contrary to these conventional MR images, which render the tumor regions relatively homogeneous, the FA maps show high contrasts and interesting patterns within the tumors for all three models, which have not been previously reported. Inside the tumor regions defined by conventional MR images, there are small, dark central areas with a low or intermediate diffusion anisotropy, surrounded by structures (rim) with a high degree of diffusion anisotropy. The presence of a high diffusion anisotropy in the rims shows that water diffusion in certain regions is coherently, not randomly distributed, which clearly demonstrates the existence of a high level of organization at the cellular level inside these tumors.
FIG. 1.

In vivo MR images of 9L gliosarcoma, F98 glioma, and Mayo 22 glioblastoma brain tumor models. Post-implantation days were 11 (9L), 10 (F98), and 27 (Mayo 22). cc stands for corpus callosum; hc for hippocampal commissure. The tumor regions are hyperintense on the T2W and ADC images. The boundaries of T2W hyperintense tumor regions were manually defined and overlaid on other images. In FA maps, the tumors show high contrasts and various degrees of high-level diffusion anisotropy. In DEC and vector images, the tumor areas exhibit a circular orientation for 9L and F98, or a radial orientation for Mayo 22 tumors, as illustrated by the insert diagrams.
DTI can measure the predominant diffusion orientation (V1) at each pixel. In prominent white matter tracts, such as the corpus callosum and the hippocampal commissure (Fig. 1), the measured V1s were tangential to the trajectories of these axonal tracts. In the 9L tumor, the orientations in the rostral and caudal parts of the rim were along the medial-lateral orientation (red), while the orientations in the lateral parts were along the rostral-caudal orientation (green). This indicates that, water molecules in the rim primarily move in a circular fashion (surrounding the center of the tumor), as seen in the DEC or vector image. A similar pattern can be observed in the F98 tumor. On the other hand, the human Mayo 22 had different patterns of diffusion orientation compared to the 9L and F98 tumors. In the DEC image, the measured V1s in the rostral and caudal rims were along the rostral-caudal orientation (green), while the orientations in the lateral parts were along the medial-lateral orientation (red). In the vector image, the measured V1s in the rim region with high diffusion anisotropy formed a radial pattern, suggesting that water molecules in these regions mainly diffuse in radial orientations (moving between the tumor center and outside through the rim).
Quantitative comparisons of DTI parameters measured in the central regions, rim regions, and contralateral striatum from a single horizontal slice through the center of each tumor are shown in Fig. 2. The rim was manually defined as a ring-like region with an apparent circular or radial pattern in the DEC image, while the region surrounded by the rim was defined as the central region (Fig. 2, diagram). Consistent with the above qualitative observations, the rims of the tumors generally had higher FA values than the centers, which were significant in the F98 and Mayo 22 models (p < 0.001), but not in the 9L model (P > 0.05). In the F98 and Mayo 22 models, the FA values in the centers were significantly lower than those in the contralateral striatum (p < 0.001), while the rims had significantly higher FA values than the contralateral striatum (p < 0.001). The differences were not significant for the 9L tumor. In contrast, the differences in ADC between the centers and rims of the tumors were not significant. In the 9L and F98 tumors, as expected (23), the values of ADC in the centers and rims were significantly higher than those in the contralateral striatum (p < 0.01). In the Mayo 22 model, the differences were not significant (P > 0.05).
FIG. 2.
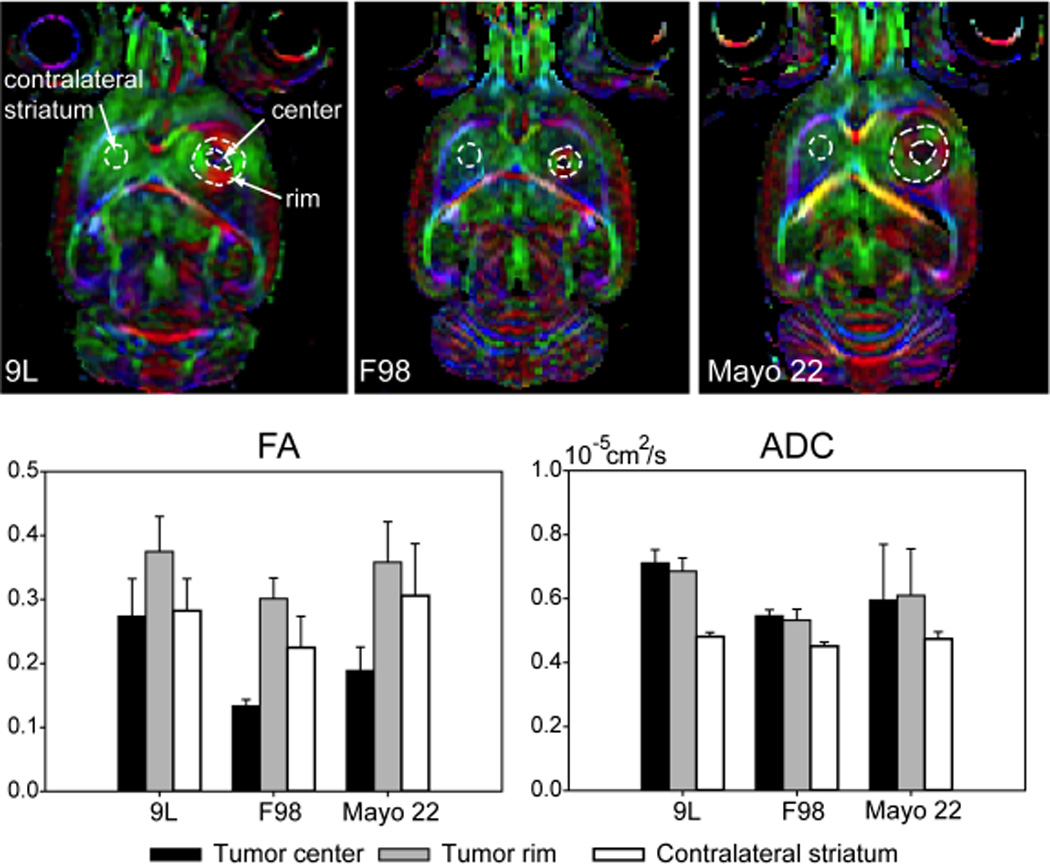
Quantitative comparison of DTI parameters measured in different brain regions of 9L gliosarcoma, F98 glioma, and Mayo 22 glioblastoma brain tumor models (n = 5 for each group). Post-implantation days were 11 (9L), 10 or 11 (F98), and 26–28 (Mayo 22).
Ex Vivo DTI
With ex vivo MRI, acquired with high spatial resolution in all three dimensions (~0.16 × 0.16 × 0.16 mm3), we were able to examine the brain tumors in the horizontal, coronal, sagittal, or arbitrary orientations. Figure 3 shows examples of horizontal and coronal MR images acquired from the three experimental brain tumor models. Contrary to the in vivo cases, the T2W images no longer provided good contrast between normal brain tissue and tumors. The tumor regions even showed T2 hypointensity in the Mayo 22 xenografts. Significantly, ex vivo DTI results with high signal-to-noise ratios and higher spatial resolution confirmed our in vivo findings about the uniqueness of the structural patterns of tumor water diffusion. The comparison between the horizontal and coronal images shows that the distinctive patterns of water diffusion observed in vivo are not limited to a particular horizontal slice.
FIG. 3.
Ex vivo MR images from perfused rat brain samples with 9L, F98, and Mayo 22 glioblastoma xenografts. Post-implantation days were 11 (9L), 10 (F98), and 26 (Mayo 22). Transverse sections and coronal sections are shown. The tumor regions are hyperintense on the ADC images. The contrast between the tumor and surrounding brain tissues on the T2W images is low. All three types of tumors show various degrees of high-level diffusion anisotropy and a unique arrangement of tissue diffusion orientation.
Histology
Hematoxylin and eosin-stained histology was performed to examine tumors directly for the presence of distinct cellular organizational patterns within tumors. Figure 4 shows the results for all three tumor models used in this study. For the 9L or F98 tumor models, no patterns similar to those revealed by DTI were visible in low magnification histology images (not shown). Examination under high magnification (20×) showed that the orientation of individual tumor cells and the adjacent interstitial spaces formed a circular pattern in the outer part of the tumors, corresponding to the rims observed by DTI. In the case of the Mayo 22 glioblastoma xenografts, high magnification histology clearly showed tumor cells elongated and seemingly “streaming” in a radial pattern with parallel interstitial spaces, most apparent in the rims of the tumors. It is interesting that in the case of Mayo 22 tumors, small collections of radially oriented tumor cells were readily seen invading into the surrounding brain. Thus, the diffusion patterns of water molecules observed by DTI may reflect the patterns of the interstitial fluid flow and cellular organization within these tumors.
FIG. 4.
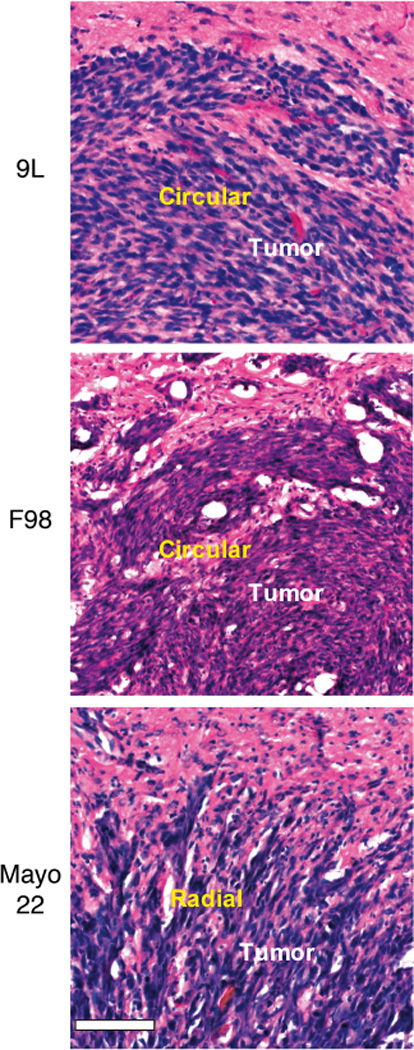
High magnification (20×) histology of 9L, F98, and Mayo 22 tumors. Post-implantation days were 11 (9L), 11 (F98), and 26 (Mayo 22). Bar was 0.1 mm. The morphology of individual tumor cells (blue) and the orientations of interstitial space (white) in the outer parts of the tumors (corresponding to the rims) form a circular pattern (9L and F98) or a radial pattern (Mayo 22). Note the collections of radially organized Mayo 22 tumor cells extending from tumor margins into surrounding brain.
Diffusion Patterns on Different Post-implantation Days
To investigate how these diffusion patterns develop with time, we performed in vivo MRI (both DTI and T2W) longitudinally on rats bearing intracranial 9L, F98, and Mayo 22 tumor models. Based on their relatively rapid growth properties, the 9L and F98 tumors were imaged at 7, 10 or 11 days post-implantation, while the Mayo 22 xenografts were scanned at 28, 34, and 42 days post-implantation. Figure 5 shows the in vivo experimental results from three typical rats. The size of all three types of tumors clearly increased with time, as shown in the T2W and ADC images. It is obvious that each type of tumor had the same diffusion pattern of water as those shown in Fig. 1. Even when the tumors were small (seven days for 9L and F98, and 28 days for Mayo 22), the 9L and F98 tumors had circular patterns of tissue diffusion orientation similar to those at a later stage (10 or 11 days), while the Mayo 22 tumors had radial patterns of tissue diffusion orientation similar to those at later stages (34 and 42 days). In the Mayo 22 model, even at a very late stage (42 days after implantation), when the tumor occupied the entire right striatum and deformed the surrounding tissue, the radial pattern was still well preserved in the tumors. These results show that the unique diffusion patterns (anisotropy and orientation) are formed at an early stage and are preserved throughout the tumor growth in all three models.
FIG. 5.
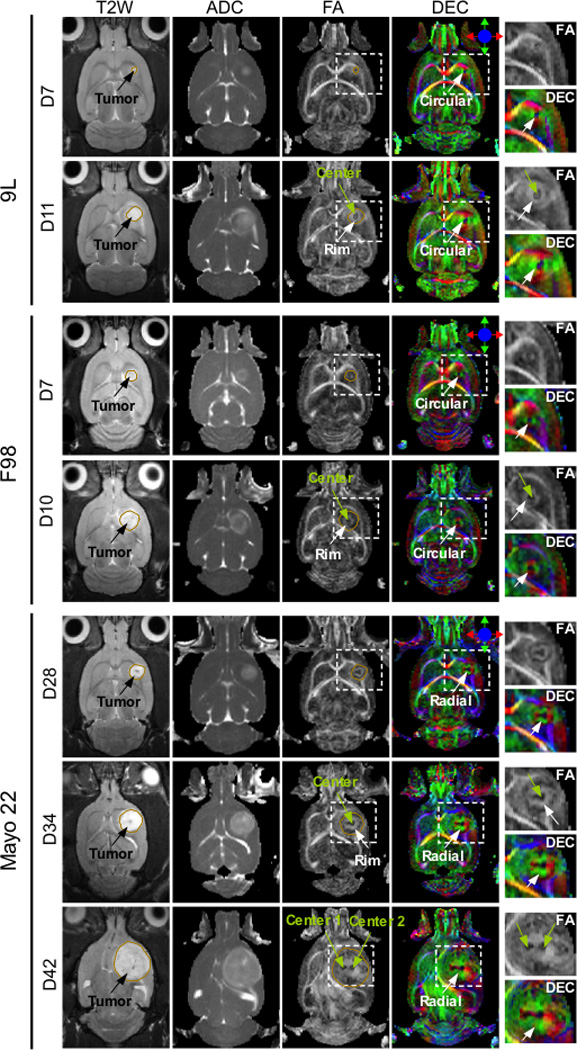
In vivo MR images of 9L, F98, and Mayo 22 xenografts at different stages of tumor growth. A 9L tumor at 7 and 11 days post-implantation, an F98 tumor at 7 and 10 days post-implantation, and a mayo 22 tumor at 28, 34, and 42 days post-implantation. The boundaries of T2W hyperintense tumor regions were manually defined and overlaid on FA images. In the FA and DEC images, tumor regions (inside the rectangular box) were enlarged and shown next to the DEC images. The tumors grow with post-implantation time, as observed within conventional T2W and ADC images. The diffusion patterns appear at an early stage and enlarge with tumor growth in all three models. DTI reveals the presence of two centers for Mayo 22 xenografts, which are not visible with conventional MR images.
For all three tumor models used in this study, most of the tumors had one center with low diffusion anisotropy, as observed in the FA and DEC images. However, we observed multiple centers in two of the six rats bearing 9L tumors (not shown) and one of the six rats bearing Mayo 22 xenografts (Fig. 5). In the cases of multiple centers, the tumors appeared to be composed of several small confluent tumor foci, each of which contained a dark center with low FA, and a rim with high FA surrounding the center. The orientation of water diffusion in the rim was circular for the 9L tumors or radial for the Mayo 22 tumor, exactly the same as with a single center. Although the FA map with multiple centers shows a striking contrast, the entire solid tumor appears as a relatively homogeneous region in T2W and ADC images.
DISCUSSION
Unique Contrasts from DTI
In this study, we have shown that the DTI technique, when used under conditions of high spatial resolution, provides useful information on tumor architecture for tumor detection and characterization. As shown in Fig. 1, all three tumors appear relatively homogeneous in conventional T2W and ADC images, while the FA images generated from DTI measurements reveal high contrasts in the tumor regions. Particularly interesting is the presence of rim regions with a high diffusion anisotropy within the tumor areas. In the FA images, the central region of tumor has a low diffusion anisotropy, surrounded by a rim region of a high diffusion anisotropy. Both conventional MRI and histology show that the central zones with low FA are not necrotic. Further examinations show that the combined center and rim regions are generally smaller than the tumor areas defined by T2W and ADC hyperintensity, which may be due to either the mass of solid tumor cells or to peritumoral vasogenic edema. Using diffusion anisotropy and orientation, DTI provides unique MRI contrasts for characterizing tumors.
Microstructures of Gliomas
It is commonly believed that the MRI contrasts generated by DTI reflect the arrangement of cells, membranes, and other structures inside a pixel. In axonal tracts, where neuronal fibers are coherently arranged and traveling in the same direction, the measured water diffusion anisotropy is high and the diffusion orientation is along the direction of fiber trajectories. However, the high diffusion anisotropy with the circular or radial pattern inside these solid tumors can not be explained by neuronal fibers that are distinctly absent from these tumor models that are mainly composed of tumor cells. Previous studies (24) have reported high diffusion anisotropy and coherently arranged diffusion orientations in the embryonic and neonatal cortex, probably due to the columnar structures of migrating neurons and radial glia. The experimental results in this study show that the tumors consist of centers with low FA, surrounded by rims with high FA. In the rims of the 9L and F98 tumors, it is easier for water molecules to diffuse in a circular direction (i.e., within the rims) than in a radial direction (i.e., crossing the rims), while for the human Mayo 22 model, it is easier for water molecules to move in a radial direction than in a circular direction. The organized directional diffusion of water molecules in these solid tumors was found to reflect the directional organization of cells within the rims unique for different tumor models. The tumor rims displaying circular water diffusion contained cells that were elongated and organized in a circumferential direction. In contrast, tumor rims with radial water diffusion contained cells that were elongated and organized radially. In the latter cases, thin aggregates of tumor cells could be found invading as an extension of this radial pattern from the tumor margin into surrounding brain.
Malignant tumor cells both proliferate and migrate in the extracellular matrix of the brain. Gliomas are often described as consisting of a central proliferation zone and a surrounding invasive zone of lower cellular density. Rates of proliferation and infiltration are not strictly correlated. Many efforts have been applied to investigate the dynamics of malignant tumor growth in vitro (25–27) and in vivo (28,29). It has been suggested (25) that a malignant brain tumor is an opportunistic, self-organizing, and adaptive dynamic biosystem rather than an unorganized cell mass. Both theoretical and experimental results clearly show that the dynamics and resulting patterns of tumor growth are quite different for different tumor cell lines. This is supported by the findings in this study. The 9L and F98 brain tumors grew rapidly. Generally, the tumor reached a size detectable by MRI at one week post-implantation and most animals implanted with tumors died within 2–3 weeks post-implantation. In comparison, the Mayo 22 xenografts grew slowly and tumor-bearing animals usually lived for 2–3 months post-implantation. Whether rapidly growing tumors form circular patterns, or tumors with circular patterns grow faster is not addressed in this study. The distinct patterns of directional diffusion of water molecules inside these solid tumors were correlated with their microstructures and growth patterns. The cellular, biochemical, and molecular determinants of the distinct organization of these tumors as revealed by DTI remain to be determined. Possibilities include specific cell surface and extracellular matrix determinants of tumor cell adhesion and shape, cytoskeletal determinants of cell shape, and potentially tumor proliferation and invasiveness.
Comparison with Human DTI
Using DTI, both brain tumors and adjacent brain tissues, including white matter tracts and the cerebral cortex, have been studied intensively in recent years (12–18). It was found that growing brain tumors have an influence on the fiber tracts in the brain, and abnormalities may be categorized by displaced, infiltrated, disrupted, and edematous patterns (13,18). To the best of our knowledge, these DTI studies were all performed on human patients harboring brain tumors, except for a recent conference abstract (30), in which the 9L tumor model was scanned. Compared to our results, these human studies generally noticed decreased, low FA values inside the tumors and no specific diffusion patterns were reported. The fact that the unique diffusion patterns seen in our DTI studies on the experimental brain tumors have not been observed in DTI of patients with brain tumors may be attributed to two factors. The first and foremost factor is possible different characteristics between human brain tumors and tumors in animal brains. Brain tumor growth is very chaotic and includes areas of necrosis, micro- or macro-hemorrhage, and cystic components. These features are typically noted in a human glioma and form the basis of a diagnosis of a high-grade tumor. If these physiological features do exist, as seen in most clinical studies, one would expect the FA to go down as the tumor grows. The second factor is the high spatial resolution that was used in animal studies. Similar to conventional MRI, what DTI detects in a voxel is an average of the entire voxel. In current, typical human DTI studies, the imaging resolution is about 2.5 mm in each dimension, much coarser than the resolution achieved in our animal studies (0.33 × 0.33 × 1.5 mm3). The voxel volume is about 100 times larger in human studies than in our animal studies. Increasing voxel size generally results in larger partial volume effects and may yield ambiguous DTI results (31).
It is possible that similar patterns of diffusion directionality may be associated with the location, size, time (e.g., at onset), and type of tumor in humans. The observation of these is currently hampered by spatial resolution limitations, but may become possible when spatial resolution for DTI improves to the sub-millimeter level in the future. It was reported recently (32) that the high signal-to-noise ratio achieved with the multi-channel array receivers at a 7T human MRI scanner enabled an unprecedented spatial resolution of up to 0.2 × 0.2 × 0.5 mm3 in a simple gradient echo approach. DTI experiments require much longer TE and even though spin echoes are used, signal loss at 7T may be substantial in view of the very short T2 of white matter tissue (on the order of 40 ms or less). Depending on available gradient strength, such fields may therefore require the use of stimulated echoes for diffusion imaging. For rapid imaging at high spatial resolution, the acquisition time and segmentation may be shortened by using a reduced FOV, for instance, through the use of a small surface coil and outer-volume suppression. Based on this zoomed imaging approach, a single-shot acquisition has been performed at sub-millimeter resolution in the human brain at 7T (33). We therefore expect that it is technically possible to achieve DTI experiments with sub-millimeter resolution in humans in clinically feasible times.
CONCLUSIONS
High-resolution DTI was applied to 9L, F98, and Mayo 22 tumor models. The FA and DEC maps clearly showed that the solid tumors consist of centers with low FA and peripheral structures with high FA, circular (9L and F98) or radial (Mayo 22) diffusion orientations. These unique water diffusion patterns within tumors, not observed on conventional T2W and ADC images, are formed at an early stage post-implantation and continue to exist with tumor growth in all three models. The organized directional diffusion of water molecules within solid malignancies has never before been imaged. DTI at the sub-millimeter scale can identify brain tumors with patterns of cellular organization, which are distinct among different tumor models. The new findings may provide a new approach to investigate tumor microstructures at the cellular level and to monitor the growth of malignant gliomas in vivo.
ACKNOWLEDGMENTS
The authors thank C. David James (Mayo Clinic) for providing the human glioblastoma xenograft model used in this study. The authors also thank Ms. Mary McAllister for her editorial assistance. This work was supported in part by grants from NIH (EB002666) and the Whitaker Foundation.
References
- 1.Scherer HJ. The forms of growth in gliomas and their practical significance. Brain. 1940;63:1–35. [Google Scholar]
- 2.Kelly PJ, Daumas-Duport C, Scheithauer BW, Kall BA, Kispert DB. Stereotactic histologic correlations of computed tomography- and magnetic resonance imaging-defined abnormalities in patients with glial neoplasms. Mayo Clin Proc. 1987;62:450–459. doi: 10.1016/s0025-6196(12)65470-6. [DOI] [PubMed] [Google Scholar]
- 3.Giese A, Kluwe L, Laube B, Meissner H, Berens ME, Westphal M. Migration of human glioma cells on myelin. Neurosurg. 1996;38:755–764. [PubMed] [Google Scholar]
- 4.Giese A, Westphal M. Glioma invasion in the central nervous system. Neurosurg. 1996;39:235–252. doi: 10.1097/00006123-199608000-00001. [DOI] [PubMed] [Google Scholar]
- 5.Daumas-Duport C, Varlet P, Tucker ML, Beuvon F, Cervera P, Chodkiewicz JP. Oligodendrogliomas .1 Patterns of growth, histological diagnosis, clinical and imaging correlations: A study of 153 cases. J Neurooncol. 1997;34:37–59. doi: 10.1023/a:1005707203596. [DOI] [PubMed] [Google Scholar]
- 6.Moseley ME, Cohen Y, Kucharczyk J, Mintorovitch J, Asgari HS, Wendland MF, Tsuruda J, Norman D. Diffusion-weighted MR imaging of anisotropic water diffusion in cat central nervous system. Radiology. 1990;176:439–445. doi: 10.1148/radiology.176.2.2367658. [DOI] [PubMed] [Google Scholar]
- 7.Cleveland GG, Chang DC, Hazlewood CF, Rorschach HE. Nuclear magnetic resonance measurement of skeletal muscle: anisotropy of the diffusion coefficient of the intracellular water. Biophys J. 1976;16:1043–1053. doi: 10.1016/S0006-3495(76)85754-2. [DOI] [PMC free article] [PubMed] [Google Scholar]
- 8.Basser PJ, Mattiello J, LeBihan D. MR diffusion tensor spectroscopy and imaging. Biophys J. 1994;66:259–267. doi: 10.1016/S0006-3495(94)80775-1. [DOI] [PMC free article] [PubMed] [Google Scholar]
- 9.Basser PJ, Pierpaoli C. Microstructural and physiological features of tissues elucidated by quantitative-diffusion-tensor MRI. J Magn Reson B. 1996;111:209–219. doi: 10.1006/jmrb.1996.0086. [DOI] [PubMed] [Google Scholar]
- 10.Xue R, van Zijl PCM, Crain BJ, Solaiyappan M, Mori S. In vivo three-dimensional reconstruction of rat brain axonal projections by diffusion tensor imaging. Magn Reson Med. 1999;42:1123–1127. doi: 10.1002/(sici)1522-2594(199912)42:6<1123::aid-mrm17>3.0.co;2-h. [DOI] [PubMed] [Google Scholar]
- 11.Conturo TE, Lori NF, Cull TS, Akbudak E, Snyder AZ, Shimony JS, Mckinstry RC, Burton H, Raichle ME. Tracking neuronal fiber pathways in the living human brain. Proc Natl Acad Sci (USA) 1999;96:10422–10427. doi: 10.1073/pnas.96.18.10422. [DOI] [PMC free article] [PubMed] [Google Scholar]
- 12.Sinha S, Bastin ME, Whittle IR, Wardlaw JM. Diffusion tensor MR imaging of high-grade cerebral gliomas. AJNR. 2002;23:520–527. [PMC free article] [PubMed] [Google Scholar]
- 13.Witwer BP, Moftakhar R, Hasan KM, Deshmukh P, Haughton V, Field A, Arfanakis K, Noyes J, Moritz CH, Meyerand ME, Rowley HA, Alexander AL, Badie B. Diffusion-tensor imaging of white matter tracts in patients with cerebral neoplasm. J Neurosurg. 2002;97:568–575. doi: 10.3171/jns.2002.97.3.0568. [DOI] [PubMed] [Google Scholar]
- 14.Mori S, Frederiksen K, van Zijl PC, Stieltjes B, Kraut MA, Solaiyappan M, Pomper MG. Brain white matter anatomy of tumor patients evaluated with diffusion tensor imaging. Ann Neurol. 2002;51:377–380. doi: 10.1002/ana.10137. [DOI] [PubMed] [Google Scholar]
- 15.Price SJ, Burnet NG, Donovan T, Green HAL, Pena A, Antoun NM, Pickard JD, Carpenter TA, Gillard JH. Diffusion tensor Imaging of brain tumours at 3 T: A potential tool for assessing white matter tract invasion? Clin Radiology. 2003;58:455–462. doi: 10.1016/s0009-9260(03)00115-6. [DOI] [PubMed] [Google Scholar]
- 16.Lu S, Ahn D, Johnson G, Cha S. Peritumoral diffusion tensor imaging of high-grade gliomas and metastatic brain tumors. AJNR. 2003;24:937–941. [PMC free article] [PubMed] [Google Scholar]
- 17.Provenzale JM, McGraw P, Mhatre P, Guo AC, Delong D. Peritumoral brain regions in gliomas and meningiomas: Investigation with isotropic diffusion-weighted MR imaging and diffusion-tensor MR. Radiology. 2004;232:451–460. doi: 10.1148/radiol.2322030959. [DOI] [PubMed] [Google Scholar]
- 18.Field AS, Alexander AL, Wu YC, Hasan KM, Witwer B, Badie B. Diffusion tensor eigenvector directional color imaging patterns in the evaluation of cerebral white matter tracts altered by tumor. J Magn Reson Imag. 2004;20:555–562. doi: 10.1002/jmri.20169. [DOI] [PubMed] [Google Scholar]
- 19.Guerin C, Laterra J, Drewes LR, Brem H, Goldstein GW. Vascular expression of glucose transporter in experimental brain neoplasms. Am J Pathol. 1992;140:417–425. [PMC free article] [PubMed] [Google Scholar]
- 20.Sarkaria JN, Carlson BL, Schroeder MA, Grogan P, Brown PD, Giannini C, Ballman KV, Kitange GJ, Guha A, Pandita A, James CD. Use of an orthotopic xenograft model for assessing the effect of epidermal growth factor receptor amplification on glioblastoma radiation response. Clin Cancer Res. 2006;12:2264–2271. doi: 10.1158/1078-0432.CCR-05-2510. [DOI] [PubMed] [Google Scholar]
- 21.Basser PJ, Mattiello J, LeBihan D. Estimation of the effective self-diffusion tensor from the NMR spin echo. J Magn Reson B. 1994;103:247–254. doi: 10.1006/jmrb.1994.1037. [DOI] [PubMed] [Google Scholar]
- 22.Pajevic S, Pierpaoli C. Color schemes to represent the orientation of anisotropic tissues from diffusion tensor data: application to white matter fiber tract mapping in the human brain. Magn Reson Med. 1999;42:526–540. [PubMed] [Google Scholar]
- 23.Eis M, Els T, Hoehn-Berlage M. High resolution quantitative relaxation and diffusion MRI of three different experimental brain tumors in rat. Magn Reson Med. 1995;34:835–844. doi: 10.1002/mrm.1910340608. [DOI] [PubMed] [Google Scholar]
- 24.Neil J, Shiran S, McKinstry R, Schefft G, Snyder A, Almli C, Akbudak E, Arnovitz J, Miller J, Lee B, Conturo T. Normal brain in human newborns: apparent diffusion coefficient and diffusion anisotropy measured by using diffusion tensor MR imaging. Radiology. 1998;209:57–66. doi: 10.1148/radiology.209.1.9769812. [DOI] [PubMed] [Google Scholar]
- 25.Deisboeck TS, Berens ME, Kansal AR, Torquato S, Stemmer-Rachamimov AO, EA C. Pattern of self-organization in tumour systems: complex growth dynamics in a novel brain tumour spheroid model. Cell Prolif. 2001;34:115–134. doi: 10.1046/j.1365-2184.2001.00202.x. [DOI] [PMC free article] [PubMed] [Google Scholar]
- 26.Sander LM, Deisboeck TS. Growth patterns of microscopic brain tumors. Phys Rev E. 2002;66 doi: 10.1103/PhysRevE.66.051901. 051901. [DOI] [PubMed] [Google Scholar]
- 27.Khain E, Sander LM. Dynamics and pattern formation in invasive tumor growth. Phys Rev Lett. 2006;96:188103. doi: 10.1103/PhysRevLett.96.188103. [DOI] [PubMed] [Google Scholar]
- 28.Bru A, Albertos S, Subiza JL, Garcia-Asenjo JL, Bru I. The universal dynamics of tumor growth. Biophys J. 2003;85:2948–2961. doi: 10.1016/S0006-3495(03)74715-8. [DOI] [PMC free article] [PubMed] [Google Scholar]
- 29.Jbabdi S, Mandonnet E, Duffau H, Capelle L, Swanson KR, Pelegrini-Issac M, Guillevin R, Benali H. Simulation of anisotropic growth of low-grade gliomas using diffusion tensor imaging. Magn Reson Med. 2005;54:616–624. doi: 10.1002/mrm.20625. [DOI] [PubMed] [Google Scholar]
- 30.Kim S, Pickup S, Hsu O, Poptani H. Proc 14th Annual Meeting ISMRM. Seattle: 2006. In Vivo DTI-Based Tractography of Intra-Cranial Rat Brain Tumors; p. 612. [Google Scholar]
- 31.Kim M, Ronen I, Ugurbil K, Kim DS. Spatial resolution dependence of DTI tractography in human occipito-callosal region. NeuroImage. 2006;32:1243–1249. doi: 10.1016/j.neuroimage.2006.06.006. [DOI] [PubMed] [Google Scholar]
- 32.Li T, van Gelderen P, Merkle H, Talagala L, Koretsky AP, Duyn J. Extensive heterogeneity in white matter intensity in high-resolution T2*-weighted MRI of the human brain at 7.0 T. NeuroImage. 2006;32:1032–1040. doi: 10.1016/j.neuroimage.2006.05.053. [DOI] [PubMed] [Google Scholar]
- 33.Pfeuffer J, van de Moortele PF, Yacoub E, Shmuel A, Adriany G, Andersen P, Merkle H, Garwood M, Ugurbil K, Hu XP. Zoomed functional imaging in the human brain at 7 Tesla with simultaneous high spatial and high temporal resolution. NeuroImage. 2002;17:272–286. doi: 10.1006/nimg.2002.1103. [DOI] [PubMed] [Google Scholar]