

Abstract
In the recent decade, in vivo μCT scanners have become available to monitor temporal changes in rodent bone in response to diseases and treatments. We investigated short-term and long-term precision of in vivo μCT measurements of trabecular bone density, microstructure and stiffness of rat tibiae and tested whether they can be improved by 3D image registration. Rats in the short-term precision group underwent baseline and follow-up scans within the same day (n=15) and those in the long-term precision group were scanned at day 0 and day 14 (n=16) at 10.5 μm voxel size. A 3D image-registration scheme was applied to register the trabecular bone compartments of baseline and follow-up scans. Prior to image registration, short-term precision ranged between 0.85% and 2.65% in bone volume fraction (BV/TV), trabecular number, thickness, and spacing (Tb.N*, Tb.Th*, Tb.Sp*), trabecular bone mineral density and tissue mineral density (Tb.BMD, and Tb.TMD), and was particularly high in structure model index (SMI), connectivity density (Conn.D), and stiffness (4.29%–8.83%). Image registration tended to improve the short-term precision, but the only statistically significant improvement was in Tb.N*, Tb.TMD, and stiffness. On the other hand, unregistered comparisons between day-0 and day-14 scans suggested significant increases in BV/TV, Tb.N*, Tb.Th*, Conn.D, and Tb.BMD and decrease in Tb.Sp* and SMI. However, the percent change in each parameter from registered comparisons was significantly different from unregistered comparisons. Registered results suggested a significant increase in BV/TV, Tb.BMD, and stiffness over 14 days, primarily caused by increased Tb.Th* and Tb.TMD. Due to the continuous growth of rodents, the direct comparisons between the unregistered baseline and follow-up scans were driven by changes due to global bone modeling instead of local remodeling. Our results suggested that 3D image registration is critical for detecting changes due to bone remodeling activities in rodent trabecular bone by in vivo μCT imaging.
Keywords: In vivo μCT, 3D image registration, trabecular bone microstructure, finite element analysis, animal models/rodent
Introduction
Micro computed tomography (μCT) has been widely used to study three-dimensional (3D) microstructure of bone specimens [1]. It provides 3D imaging with sufficient spatial resolution for the assessment of trabecular microstructure of both human bone biopsy specimens and rodent bone specimens. Moreover, in the recent decade, in vivo μCT scanners have become available to monitor longitudinal changes in the rat and mouse skeleton [2–11]. The current in vivo μCT scan can obtain images with an isotropic voxel size at a scale of 10 μm, which is high enough for direct, 3D bone microstructural analyses of rodent trabecular bone. Moreover, based on these high-resolution images, micro finite element (μFE) models can be generated to estimate the mechanical properties of bone [12, 13]. Therefore, by using in vivo μCT imaging and μFE analysis techniques, changes in geometry, microstructure, and mechanical properties of rodent bone, in response to either diseases or treatments, can be visualized and quantified over time. As rat and mouse models are among the most common models to study human bone diseases, the in vivo μCT imaging of rats and mice is an invaluable tool to study the skeletal responses to various diseases and treatments in a longitudinal manner.
In order to detect longitudinal changes in bone microstructure and mechanical properties, it is critical to understand the factors that may affect the precision of these measurements by in vivo μCT scans. Several factors need to be considered when designing in vivo μCT experiments. First, animal movement due to breathing and repositioning of animals at each follow-up scan affects the precision of in vivo measurements. These influences could be reduced by using customized animal holders during the scan. Such a holder can help to minimize the movement of the skeletal site of interest, such as the proximal tibia and lumbar vertebra, and can ensure that the skeletal site is positioned in a similar 3D orientation at each follow-up scan. 3D image registration has also been used to further reduce the reposition error of in vivo scans [2, 14, 15]. Nishiyama et al. reported that by 3D image registration, reproducibility can be significantly improved in bone density and microstructural measurements at 12.5 μm resolution (precision ~1–5% in rats) [15]. However, in this study, follow-up scans were within 2 days of baseline scans, when changes to the bone microstructure are minimal and negligible. A challenge of in vivo μCT image studies is to identify the same region of interest between baseline and follow-up scans where significant changes in bone geometry and microstructure have occurred between scans.
Although reproducibility of ex vivo μCT at various regions of interest and resolutions has been reported in a number of studies [1, 16–18], influences of factors, such as motion artifact, repositioning, and linear growth of experimental animals, that affect in vivo scans have not been extensively studied. The goal of the current study is to establish a feasible in vivo μCT scan and analysis regime that yields the highest precision in long-term longitudinal studies of responses in rat tibia trabecular bone to diseases and treatment. Therefore, the first objective of the current study was to investigate the short-term (scans within the same day) and long-term precision (scans 14 days apart) of bone microstructure, mineral density, and mechanical property measurements in rat tibia by in vivo μCT scans at the highest image resolution that is achievable in vivo (10.5 μm). The second objective was to test whether a 3D image registration technique can improve the short-term and long-term precision of in vivo measurements.
Materials and Methods
Animals
Twenty-six three-month-old female Sprague Dawley rats were purchased from Charles River Laboratories (Wilmington, MA). The short-term precision study was conducted in 15 rats and each rat was scanned twice within 12 hours. The long-term precision study was conducted in the other 11 rats: each rat was scanned at day 0 and day 14 and 5 rats were scanned additionally on day 28, making the total number of 14-day scan precision comparisons equal to 16 pairs. All experiments were approved by University of Pennsylvania’s Institutional Animal Care and Use Committee.
In vivo μCT Scan
Rats were anesthetized (4.0/1.75% isoflourane) and scanned at the right tibia by an in vivo μCT system (vivaCT 40, Scanco Medical AG, Brüttisellen, Switzerland) at 10.5 μm nominal voxel size. The scanner was used at 55 kVp energy, 109 μA intensity and 200 ms integration time. During the scan, the rat tibia was immobilized by a customized holder to ensure minimal motion effect (Figure 1). A 2D scout view was used to select the scan region. A reference line was placed at 0.2 mm distal to the growth plate of the proximal tibia. A 3.1 mm region, corresponding to 296 μCT slides extending away from the growth plate, was acquired. Average time for each scan was 20 minutes. Between short-term repeated scans, animals were taken out of the scanner and their tibiae were removed from the customized holder and then reassembled for the next scan.
Figure 1.

(A–B) Customized jig for holding the rat tibia to ensure minimal motion artifacts and similar positions over longitudinal scans. (C) in vivo μCT scan of a rat under anesthesia with the right tibia held by customized jig.
Image Registration of Trabecular Bone between Baseline and Follow-up Scans
A landmark-initialized mutual information based registration toolkit [19, 20] of an open source software (National Library of Medicine Insight Segmentation and Registration Toolkit, USA) [21] was used to register the baseline and follow-up scans. The registration toolkit used the mutual Information metric with an implementation method specified by Viola and Wells [19]. 1% of voxels in the volume of interest were randomly selected as the spatial samples. Cubic B-Spline interpolator and quaternion rigid transform gradient descent optimizer were applied. More detailed information about the registration approach can be found in the ITK Software Guide [21].
The grayscale μCT images were used in the registration and transformation process. During the registration, the baseline scan was fixed while the follow-up scan was transformed to match the fixed image. The image registration occurred via two steps. First, a transformation matrix T1 (including both a rotational matrix and a translation vector) was calculated to align the center of mass of the follow-up scan (3D image F) to the baseline scan. The center of mass of each image was calculated as the moments of the intensity gray levels divided by the total intensity. Then T1 was applied to transform the follow-up scan to obtain F1. In the second step, F1 was used as the moving image and four sets of landmarks were manually selected within 3D trabecular bone volume of F1 and the corresponding fixed image (baseline scan). Initialized by the alignment of four pairs of landmarks, a mutual information-based registration scheme was employed to minimize the joint entropy and marginal probabilities of the fixed and moving images, and a second transformation matrix, T2 was derived. It should be noted that only a cubic sub-volume of trabecular bone from the original fixed and moving images were entered for the second registration. Then, T1 and T2 were combined to derive the final transformation matrix, T3. T3 represents the rigid-body transformation, including a 3D rotation and translation, between image coordinates of the baseline and follow-up scans.
To evaluate the trabecular bone microstructure of the registered baseline and follow-up scans, the trabecular bone compartment of each follow-up scan was semi-automatically contoured and saved as a volume of interest (VOI) mask (gobj file). Then, the transformation matrix T3 was applied to rotate and translate the VOI mask of the follow-up scan (Figure 2C). The transformed VOI mask from the follow-up scan corresponded to the same VOI of the baseline scan. Subsequently, the registered, thresholded trabecular VOIs in both the baseline and follow-up scans were subjected to microstructural analysis (Figure 2D). A different image transformation strategy was used for assessing bone stiffness of registered μCT images (Figure 3). Due to the difficulty to place boundary conditions on rotated image slabs, the transformation matrix T3 was applied to rotate and translate the greyscale image of the follow-up scan so that it aligned with that of the baseline scan (Figure 3B). Then, the trabecular bone VOIs were semi-automatically contoured based on the follow-up scan and applied to the baseline scan to obtain the registered VOIs for further μFE analysis (Figure 3C).
Figure 2.

Schematics of the image registration and microstructural analysis of trabecular bone: (A) Image registration was performed on greyscale images of a trabecular subregion (shown in light blue) to obtain the translation matrix T3 to transform follow-up scan to the baseline scan. (B) Image thresholding was performed to distinguish bone matrix from bone marrow and background. (C) A trabecular VOI mask was generated based on the thresholded follow-up scan to separate trabecular from cortical compartment. Then the T3 was applied to transform the VOI mask of the follow-up scan to the corresponding VOI of the baseline scan. (D) Trabecular microstructural analysis was then performed on the trabecular bone within the correponding VOIs (highlighted red region) of both baseline and follow-up scans.
Figure 3.

Schematics of the image registration and finite element analysis of trabecular bone: (A) Image registration was performed on greyscale images of a trabecular subregion (shown in light blue) to obtain the translation matrix T3 to transform follow-up scan to the baseline scan. (B) Then T3 was applied to transform the greyscale follow-up scan to baseline scan. Highlighted yellow regions represent the registered bone volume in the baseline and follow-up scans. (C) Image thresholding was performed to distinguish bone matrix from bone marrow and background. A trabecular VOI mask was generated and applied to thresholded images of both the baseline and transformed follow-up scans to obtain the registered images of trabecular bone compartment (D) The images of the registered trabecular bone compartments were converted to finite element models and subjected to compression tests.
Microstructural Analysis of Unregistered and Registered Trabecular Bone
Bone voxels of each image were segmented from bone marrow and background using Gaussian filtering (sigma=1.2 and support=2.0) and a global threshold corresponding to 495 mmHA/cm3. For the unregistered images, a 2.5 mm section of trabecular bone, beginning 0.8 to 3.3 mm distal to the growth plate was contoured and analyzed for the baseline and follow-up bone scans. For the unregistered image pairs, there was no significant difference in the selected volume of trabecular bone at the baseline and follow-up scans in either the short-term or long-term precision study. Bone microstructural parameters including bone volume fraction (BV/TV), trabecular thickness (Tb.Th*), trabecular spacing (Tb.Sp*), trabecular number (Tb.N*), structure model index (SMI), connectivity density (Conn.D), and bone density parameters: trabecular volumetric bone mineral density (Tb.BMD), and tissue mineral density (Tb.TMD) were evaluated by 3D standard microstructural analysis provided by the μCT manufacturer for each scan. Next, a second set of the bone morphological and bone density analyses were performed for the 238 registered trabecular bone image slides of the baseline and follow-up scans. There was no significant difference in the selected volume of trabecular bone at the baseline and registered follow-up scans in either the short-term or long-term precision study.
Trabecular Bone Stiffness by μFEA
Based on the μCT images of the trabecular bone compartments of the proximal tibia, each bone voxel was converted to an eight-node brick element to construct μFE models for bone stiffness measurements [22]. Bone tissue was modeled as an isotropic, linear elastic material with a Young’s modulus (Es) of 15 GPa and a Poisson’s ratio of 0.3 [23]. A uniaxial displacement of 0.01 mm was applied perpendicularly to the distal surface of the tibia while the proximal surface was imposed with zero displacement along the same direction. Both ends of the tibia were allowed to expand freely in the transverse plane. a linear μFE analysis was applied to determine the apparent Young’s modulus E* using a customized element-by-element pre-conditioned conjugate gradient solver [24]. The total reaction force was calculated from the linear μFE analysis, and the trabecular bone stiffness was calculated as the reaction force divided by the imposed displacement. Trabecular bone stiffness characterizes the mechanical competence of trabecular compartments and is closely related to bone strength [25] and fracture risk [26–28].
Statistical Analysis
To evaluate the short-term precision of each measurement, the individual coefficient of variance (CV) was evaluated, and the root mean square average of the %CV (RMSCV) was derived for each parameter for both the unregistered and registered image pairs.
For each image pair i, i=1, 2, …, N (N=15 in the short-term study and N=16 in the long-term study)
| (1) |
| (2) |
| (3) |
Paired Student’s t-tests were performed to compare the CV of repeat scans before and after image registration. To evaluate the long-term precision, percent change between the baseline and 14-day follow-up scan was evaluated for both registered and unregistered image pairs for each microstructure, density, and mechanical measurement. Paired Student’s t-tests were performed to compare the percent changes calculated based on registered and unregistered image pairs. Two-sided p values <0.05 were considered to indicate statistical significance. Analyses were conducted using Microsoft Excel.
Results
Short Term Precision Group
Prior to image registration, reasonable reproducibility was found for most parameters (Table 1). The precision errors associated with BV/TV, Tb.N*, Tb.Th*, Tb.Sp*, Tb.BMD, and Tb.TMD ranged between 0.85% and 2.65%. The precision error was particularly high for SMI, Conn.D, and stiffness measurements (4.29%~8.83%). After image registration, precision errors of all measurements went down. However, only the improvement in precision of Tb.N*, Tb.TMD, and stiffness reached statistical significance.
Table 1.
Short-term reproducibility parameters: mean and standard deviation of baseline measures, root mean square of standard deviation (RMSSD), and root mean square of percent coefficient of variance (RMS%CV) of trabecular bone density, microstructure, and stiffness measurements based on registered and unregistered scans.
| BV/TV | Tb.N* (1/mm) | Tb.Th* (mm) | Tb.Sp* (mm) | SMI | Conn.D (1/mm3) | Tb.BMD (mgHg/cm3) | Tb.TMD (mgHg/cm3) | Stiffness (kN/mm) | |
|---|---|---|---|---|---|---|---|---|---|
| Baseline scan measurements | |||||||||
| Mean ±SD | 0.300 ±0.077 | 5.33 ±0.51 | 0.0754 ±0.0093 | 0.167 ±0.020 | 1.30±0.69 | 141±28 | 393±63 | 923±15 | 82±30 |
| Unregistered baseline and follow-up scans | |||||||||
| RMSSD | 0.00718 | 0.141 | 0.000897 | 0.00297 | 0.144 | 10.255 | 4.462 | 7.850 | 7.853 |
| RMS%CV | 2.65% | 2.49% | 1.20% | 1.76% | 4.29% | 7.49% | 1.14% | 0.85% | 8.83% |
| Registered baseline and follow-up scans | |||||||||
| RMSSD | 0.00609 | 0.113 | 0.000687 | 0.00225 | 0.129 | 9.304 | 3.848 | 6.901 | 6.109 |
| RMS%CV | 2.37% | 2.01% a | 0.97% | 1.33% | 4.01% | 7.01% | 1.01% | 0.75% a | 6.48% b |
Significant improvement from the unregistered comparison was indicated by
p<0.05;
p<0.005
Long Term Precision Group
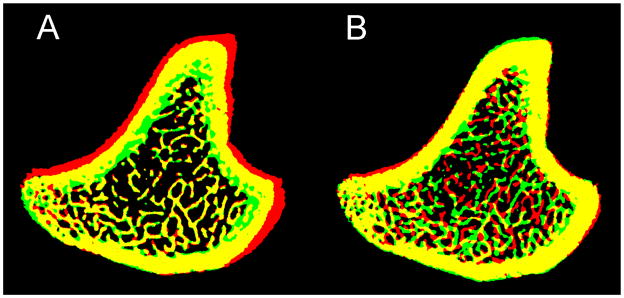
Through visual inspection, the local trabecular microstructure of scans performed 14 days apart was precisely registered as shown in Figure 4. When the 14-day follow-up scan was overlaid onto the baseline scan, significant changes in cortical bone surfaces were observed. As shown in Figure 5, red represents bone tissue scanned at day 0 and green day 14; yellow indicates the common bone tissue of both day 0 and day 14. In the trabecular bone compartment, local trabecular structure patterns remained similar in scans 14-days apart. However, a significant amount of cortical bone tissue that was present at day 0 (red) at the periosteum disappeared from the scan of day 14, suggesting that periosteal bone resorption occurred due to bone modeling. In contrast, a significant amount of bone tissue (green) appeared at the endocortical surface in the 14-day follow-up scan, indicating endosteal apposition of new bone tissue. By applying image registration we illustrates a physiological process that occurs during bone growth due to a variety of unknown regulators of skeletal modeling. This process pushed the existing bone tissues in the primary and secondary spongiosa regions away from the growth plate distally, toward the mid-shaft region.
Figure 4.

Registered 3D whole bone images (Top) and trabecular bone compartment (Bottom) of rat proximal tibia at day 0 and day 14. A common region was highlighted in yellow and enlarged in inset, showing a similar local trabecular structure in bones that were scanned 14 days apart.
Figure 5.

Overlaid registered bone structure of day 0 (Red) and day 14 (Green). Yellow indicates common bone tissue at day 0 and day 14. Significant bone growth occurred in 14 days. Due to new bone generated from the growth plate in 14 days, trabecular bone moved away from growth plate toward the diaphysis. This process was associated with periosteal resorption (red) and endocortical formation (green).
Prior to image registration, by using the growth plate as the reference line, comparisons between VOIs at day 0 and day 14 suggested significant increases in BV/TV (10.5%), Tb.N* (7.7%), Tb.Th* (4.2%), Conn.D (10.1%), Tb.BMD (7.9%), and trabecular stiffness (29.5%) and decreases in Tb.Sp* (−8.0%) and SMI (−6.1%, Figure 6). After 3D image registration (Figure 7), % change in each parameter became significantly different from that calculated based on unregistered scans (Figure 6). Registered analysis results suggested that in 14 days there was a 6.3% increase in BV/TV, 5.5% increase in Tb.BMD, and 15.2% increase in trabecular bone stiffness, primarily caused by increased Tb.Th* (10.1%) and Tb.TMD (3.2%). In addition, there was a 12.5% decrease in Conn.D, as opposed to an increase reported based on unregistered results. No changes were found in Tb.N*, Tb.Sp* or SMI as opposed to those reported based on unregistered results (Figure 6).
Figure 6.

Comparisons of the % difference in trabecular measurements between day 0 and day 14 based on registered and unregistered image pairs. *p<0.05, **p<0.01, ***p<0.001 for comparisons between day 0 and day 14. +p<0.05, ++p<0.01, +++p<0.001 for comparisons between registered and unregistered results.
Figure 7.
Overlaid bone structure of day 0 (Red) and day 14 (Green). Yellow indicates overlapped bone tissue. Registration was conducted to (A) maximize the common trabecular bone structure and (B) maximize the common whole bone area between day 0 and day 14.
Discussion
In this study, we tested both short-term and long-term precision of trabecular microstructure, density, and stiffness measurements of an in vivo μCT scan protocol of rat tibia with the highest in vivo image resolution (10.5 μm). For the short-term study, reasonable precision can be achieved by the standard scan and analysis procedure for most morphology and density measurements. 3D image registration tended to reduce short-term precision errors in each measurement but only the improvements in trabecular number, tissue mineral density, and stiffness reached statistical significance. This result is different from that reported by Nishiyama et al. [15] which demonstrated improved short-term precision in most microstructural measurements by 3D image registration. However, by using a customized jig to minimize the motion artifact and reposition error during in vivo scans, the precision of most trabecular microstructure and density measurements without image registration in our study were within 3%, a similar level compared to the registered precision in Nishiyama et al. [15]. This may explain the minimal improvement by adding 3D image registration in our study.
In the 14-day comparison, 3D registration had a significant impact on accuracy in all morphology and density measurements. Due to continuous growth in rodents within the 14-day period, without image registration, the longitudinal differences between the baseline and follow-up scans were found to be driven by changes due to bone growth instead of local bone remodeling. In the current study, results from the unregistered comparisons overestimated increases in bone volume fraction, bone mineral density, and stiffness over 14 days, and wrongly attributed these improvements to significant changes in each microstructural parameter. Image registration of trabecular bone more correctly quantifies the local trabecular change and reduces the misleading interpretations. After image registration, the results indicated thickened and more mineralized trabeculae caused by local bone remodeling over 14 days; in contrast, unregistered results wrongly suggested that increases in the number, connectivity and plate-likeness of trabeculae and a decrease in the spacing of trabeculae were main causes of increased bone mass. Moreover, registered and unregistered comparisons indicated changes of connectivity density in opposite directions. As shown in the short-term results, Conn.D yielded the highest coefficient of variance and was the most sensitive parameter to the conditions of the in vivo μCT scan. Therefore, in the long-term comparisons, 3D image registration had greatest impact on Conn.D so that the wrongful indication of direction of change based on unregistered comparisons was successfully corrected.
An intriguing pattern of bone growth was observed in the 14-day comparison (Figure 5). It was unexpected that the bone modeling and remodeling processes could have changed bone structure and geometry to such an extent. The registration procedure works by maximizing the agreement of structural patterns of the baseline and a transformed follow-up scan. Therefore it is important to identify a region that experiences the least structural change over time and to maximize the structural agreement of this region between the baseline and follow-up scans. In adult rats, both bone modeling and remodeling affect bone structure and geometry. We hypothesized that the trabecular bone structure is influenced by local bone remodeling activities predominantly while the cortical bone geometry is most affected by bone modeling activities. As shown in Figure 7A, maximizing the structural pattern agreement in the trabecular region yielded the finest registered trabecular structure patterns between the baseline and follow-up scan and indicated a significant effect of bone modeling on the cortical bone. In contrast, Figure 7B shows the registration results by maximizing whole bone geometry agreement between two scans (applied transformation matrix T1 only). Although cortical bone shape is nicely registered, the trabecular pattern did not match between scans. Therefore, we conclude that the image registration based on an agreement in trabecular bone structure is critical for detecting changes on the trabecular bone surface due to remodeling activities. In contrast, the registration based on an agreement in cortical bone geometry would provide insight into the development of trabecular bone structure due to modeling activities. A similar finding was also reported by Waarsing et al. [2], who for the first time tracked the local changes of bone microstructure in a longitudinal manner by in vivo μCT. The observed endosteal deposition and periosteal resorption over 14 days in 3 month-old rats in our study is consistent with the observation over 14 weeks in 9 month-old rats reported in Waarsing et al. [2]. Moreover, in both studies, the periosteal resorption and endosteal apposition appeared on the lateral side of the tibial cortex.
Our study has several limitations. Three-month-old female rats were used in the study. Although rats at this age are considered adults, active bone modeling still occurs in the skeleton. In studies of the aged skeleton, rats older than 9 months are considered a more reliable model to use. In that case, the growth rate of the skeleton of the aged rat is expected to be slower than that of the rat used in the current study. However, unlike humans, the growth plates of rodents do not close after their skeletons become mature. Trabecular bone of the primary and secondary spongiosa is constantly moved down toward the diaphysis due to new bone generated from the growth plate, even at an advanced age [2]. Therefore, 3D image registration is critical to ensure accurate evaluations of changes due to bone remodeling in both young and aged skeletons, especially those based on scans spanning longer term. A second limitation of this study is the use of the same rats for obtaining an additional set of 14-day comparisons for the long-term precision study. It should be noted that the two sets of comparisons may be correlated.
In this study, a mutual information based image registration scheme was used to register the unaltered bone structure. Such a registration method is suitable for both monomodal and multimodal registration [19, 29, 30]. For the monomodal registration using mutual information, concerns have been raised regarding misregistration caused by many local maxima in the mutual information function [31, 32]. However, a recent study has shown that the misregistration error by mutual information is minimal in the 3D monomodal registration case [30]. In our application, we were able to obtain successful registration in all our image pairs by using 1% of total voxels as sample points. Visual inspection was also performed for each registration to avoid local maxima during the optimization procedure. It should be noted that image registration is still an open area of research; therefore practitioners will find a variety of tools to perform registration with many options. Additional caution should be taken to ensure the appropriate settings of metric, sampling, interpolation, and optimization schemes to avoid misregistration.
Despite the limitations, our study has several notable strengths. The short-term precision results of this study pointed to the effectiveness of using the customized jig at minimizing motion artifacts and ensuring similar position of the tibia. Tightly affixing the rat foot at the base of the customized jig with a four-screw system that can extend according to the length of the rat’s tibia (Figure 1) greatly reduced image noise due to motion artifacts. To our knowledge, this is the first study that addresses the precision of in vivo μCT image-based μFEA for assessing trabecular bone stiffness. Moreover, a specialized image registration and processing scheme was proposed and implemented to ensure the best precision of in vivo μFEA results. In addition, the importance of the 3D image registration to ensure accurate evaluation of changes in trabecular bone structure in a long-term study design was quantitatively demonstrated. The results of this work show the strength of a longitudinal in vivo study design for measuring bone changes due to drug treatments, injury, or other clinical problems. In this manner it may help to reduce the number of animals required and optimize our use of laboratory animals in the future. Furthermore, using image registration for the analysis of different clinical treatment strategies is imperative to determine the treatment effect on local bone remodeling activities.
In summary, this study investigated the precision of trabecular density, structure and stiffness measurements of in vivo μCT images. By applying additional fixation to the scanned site, in vivo μCT measurements yielded reasonable short-term precision even without image registration. However, in longitudinal scans over a longer time, our results suggested that 3D image registration is a critical step to delineate bone modeling and remodeling activities and to ensure accurate detection of longitudinal changes in rodent trabecular bone due to bone remodeling activities. Potentially, the effect of bone modeling, namely the rate of longitudinal bone growth, can be quantified over time and be used to adjust each follow-up scan region to eliminate such an effect. However, a previous paper has reported that changes in the bone growth rate are significantly influenced by hormones such as estrogen [9], and that the rate of bone growth varies at different stages of life span. Therefore, 3D image registration may be the best approach to ensure that bone changes that are longitudinally tracked by in vivo μCT actually result from local bone remodeling instead of global bone modeling.
Highlights.
3D image registration of in vivo μCT images improves short-term precision in trabecular number, tissue mineral density, and stiffness.
Unregistered longitudinal comparisons of in vivo μCT images overestimated increases in bone volume fraction, bone mineral density, and stiffness.
3D registration of in vivo μCT scans 14 days apart significantly improved the precision in morphology and density measurements.
Acknowledgments
We would like to thank Dr. Michael Hast for building the customized rat tibia jig for this study. This study was partially supported by McCabe pilot award and the Penn Center for Musculoskeletal Disorders (NIH/NIAMS P30AR050950).
Footnotes
Conflict of Interest:
All the authors have no conflicts of interest.
Publisher's Disclaimer: This is a PDF file of an unedited manuscript that has been accepted for publication. As a service to our customers we are providing this early version of the manuscript. The manuscript will undergo copyediting, typesetting, and review of the resulting proof before it is published in its final citable form. Please note that during the production process errors may be discovered which could affect the content, and all legal disclaimers that apply to the journal pertain.
Contributor Information
Shenghui Lan, Email: shenghuilan@gmail.com.
Shiming Luo, Email: shiming@sas.upenn.edu.
Beom Kang Huh, Email: bhuh@seas.upenn.edu.
Abhishek Chandra, Email: abhic@mail.med.upenn.edu.
Allison R. Altman, Email: alaltman@mail.med.upenn.edu.
Ling Qin, Email: qinling@mail.med.upenn.edu.
X. Sherry Liu, Email: xiaoweil@mail.med.upenn.edu.
References
- 1.Bouxsein ML, Boyd SK, Christiansen BA, Guldberg RE, Jepsen KJ, Muller R. Guidelines for assessment of bone microstructure in rodents using micro-computed tomography. J Bone Miner Res. 2010;25:1468–86. doi: 10.1002/jbmr.141. [DOI] [PubMed] [Google Scholar]
- 2.Waarsing JH, Day JS, van der Linden JC, Ederveen AG, Spanjers C, De Clerck N, Sasov A, Verhaar JA, Weinans H. Detecting and tracking local changes in the tibiae of individual rats: a novel method to analyse longitudinal in vivo micro-CT data. Bone. 2004;34:163–9. doi: 10.1016/j.bone.2003.08.012. [DOI] [PubMed] [Google Scholar]
- 3.Brouwers JE, Lambers FM, Gasser JA, van Rietbergen B, Huiskes R. Bone degeneration and recovery after early and late bisphosphonate treatment of ovariectomized wistar rats assessed by in vivo micro-computed tomography. Calcif Tissue Int. 2008;82:202–11. doi: 10.1007/s00223-007-9084-3. [DOI] [PMC free article] [PubMed] [Google Scholar]
- 4.Brouwers JE, Lambers FM, van Rietbergen B, Ito K, Huiskes R. Comparison of bone loss induced by ovariectomy and neurectomy in rats analyzed by in vivo micro-CT. J Orthop Res. 2009;27:1521–7. doi: 10.1002/jor.20913. [DOI] [PubMed] [Google Scholar]
- 5.Brouwers JE, van Rietbergen B, Huiskes R. No effects of in vivo micro-CT radiation on structural parameters and bone marrow cells in proximal tibia of wistar rats detected after eight weekly scans. J Orthop Res. 2007;25:1325–32. doi: 10.1002/jor.20439. [DOI] [PubMed] [Google Scholar]
- 6.Boyd SK, Davison P, Muller R, Gasser JA. Monitoring individual morphological changes over time in ovariectomized rats by in vivo micro-computed tomography. Bone. 2006;39:854–62. doi: 10.1016/j.bone.2006.04.017. [DOI] [PubMed] [Google Scholar]
- 7.Campbell GM, Buie HR, Boyd SK. Signs of irreversible architectural changes occur early in the development of experimental osteoporosis as assessed by in vivo micro-CT. Osteoporos Int. 2008 doi: 10.1007/s00198-008-0581-7. [DOI] [PubMed] [Google Scholar]
- 8.Buie HR, Moore CP, Boyd SK. Postpubertal architectural developmental patterns differ between the L3 vertebra and proximal tibia in three inbred strains of mice. J Bone Miner Res. 2008;23:2048–59. doi: 10.1359/jbmr.080808. [DOI] [PubMed] [Google Scholar]
- 9.Waarsing JH, Day JS, Verhaar JA, Ederveen AG, Weinans H. Bone loss dynamics result in trabecular alignment in aging and ovariectomized rats. J Orthop Res. 2006;24:926–35. doi: 10.1002/jor.20063. [DOI] [PubMed] [Google Scholar]
- 10.Lambers FM, Schulte FA, Kuhn G, Webster DJ, Muller R. Mouse tail vertebrae adapt to cyclic mechanical loading by increasing bone formation rate and decreasing bone resorption rate as shown by time-lapsed in vivo imaging of dynamic bone morphometry. Bone. 2011;49:1340–50. doi: 10.1016/j.bone.2011.08.035. [DOI] [PubMed] [Google Scholar]
- 11.Schulte FA, Lambers FM, Kuhn G, Muller R. In vivo micro-computed tomography allows direct three-dimensional quantification of both bone formation and bone resorption parameters using time-lapsed imaging. Bone. 2011;48:433–42. doi: 10.1016/j.bone.2010.10.007. [DOI] [PubMed] [Google Scholar]
- 12.van Rietbergen B, Majumdar S, Pistoia W, Newitt DC, Kothari M, Laib A, Ruegsegger P. Assessment of cancellous bone mechanical properties from micro-FE models based on micro-CT, pQCT and MR images. Technol Health Care. 1998;6:413–20. [PubMed] [Google Scholar]
- 13.Keaveny TM, Morgan EF, Niebur GL, Yeh OC. Biomechanics of trabecular bone. Annu Rev Biomed Eng. 2001;3:307–33. doi: 10.1146/annurev.bioeng.3.1.307. [DOI] [PubMed] [Google Scholar]
- 14.Boyd SK, Moser S, Kuhn M, Klinck RJ, Krauze PL, Muller R, Gasser JA. Evaluation of three-dimensional image registration methodologies for in vivo microcomputed tomography. Ann Biomed Eng. 2006;34:1587–99. doi: 10.1007/s10439-006-9168-7. [DOI] [PubMed] [Google Scholar]
- 15.Nishiyama KK, Campbell GM, Klinck RJ, Boyd SK. Reproducibility of bone micro-architecture measurements in rodents by in vivo micro-computed tomography is maximized with three-dimensional image registration. Bone. 2010;46:155–61. doi: 10.1016/j.bone.2009.09.023. [DOI] [PubMed] [Google Scholar]
- 16.Verdelis K, Lukashova L, Atti E, Mayer-Kuckuk P, Peterson MG, Tetradis S, Boskey AL, van der Meulen MC. MicroCT morphometry analysis of mouse cancellous bone: intra- and inter-system reproducibility. Bone. 2011;49:580–7. doi: 10.1016/j.bone.2011.05.013. [DOI] [PMC free article] [PubMed] [Google Scholar]
- 17.Bonnet N, Laroche N, Vico L, Dolleans E, Courteix D, Benhamou CL. Assessment of trabecular bone microarchitecture by two different x-ray microcomputed tomographs: a comparative study of the rat distal tibia using Skyscan and Scanco devices. Med Phys. 2009;36:1286–97. doi: 10.1118/1.3096605. [DOI] [PubMed] [Google Scholar]
- 18.Kim DG, Christopherson GT, Dong XN, Fyhrie DP, Yeni YN. The effect of microcomputed tomography scanning and reconstruction voxel size on the accuracy of stereological measurements in human cancellous bone. Bone. 2004;35:1375–82. doi: 10.1016/j.bone.2004.09.007. [DOI] [PubMed] [Google Scholar]
- 19.Viola P, Wells WM., III Alignment by maximization of mutual information. Int J Comput Vis. 1997;24:137–54. [Google Scholar]
- 20.Collignon A, Maes F, Delaere D, Vandermeulen D, Suetens P, Marchal G. Automated multi-modality image registration based on information theory. In: Bizais Y, Barillot C, di Paola R, editors. Information Processing in Medical Imaging. Kluwer Academic Publishers; Dordrecht, The Netherlands: 1995. pp. 263–274. [Google Scholar]
- 21.lbanez L, Schroeder W, Ng L, Cates J. Consortium tIS. [Accessed December 5, 2008];The ITK Software Guide. (2). 2005 Available at http://www.itk.org/ItkSoftwareGuide.pdf.
- 22.Liu XS, Zhang XH, Sekhon KK, Adams MF, McMahon DJ, Bilezikian JP, Shane E, Guo XE. High-resolution peripheral quantitative computed tomography can assess microstructural and mechanical properties of human distal tibial bone. J Bone Miner Res. 2010;25:746–56. doi: 10.1359/jbmr.090822. [DOI] [PMC free article] [PubMed] [Google Scholar]
- 23.Guo XE, Goldstein SA. Is trabecular bone tissue different from cortical bone tissue? Forma. 1997;12:185–96. [Google Scholar]
- 24.Hollister SJ, Brennan JM, Kikuchi N. A homogenization sampling procedure for calculating trabecular bone effective stiffness and tissue level stress. J Biomech. 1994;27:433–44. doi: 10.1016/0021-9290(94)90019-1. [DOI] [PubMed] [Google Scholar]
- 25.Macneil JA, Boyd SK. Bone strength at the distal radius can be estimated from high-resolution peripheral quantitative computed tomography and the finite element method. Bone. 2008;42:1203–13. doi: 10.1016/j.bone.2008.01.017. [DOI] [PubMed] [Google Scholar]
- 26.Stein EM, Liu XS, Nickolas TL, Cohen A, Thomas V, McMahon DJ, Zhang C, Yin PT, Cosman F, Nieves J, Guo XE, Shane E. Abnormal microarchitecture and reduced stiffness at the radius and tibia in postmenopausal women with fractures. J Bone Miner Res. 2010;25:2296–305. doi: 10.1002/jbmr.152. [DOI] [PMC free article] [PubMed] [Google Scholar]
- 27.Melton LJ, 3rd, Christen D, Riggs BL, Achenbach SJ, Muller R, van Lenthe GH, Amin S, Atkinson EJ, Khosla S. Assessing forearm fracture risk in postmenopausal women. Osteoporos Int. 2010;21:1161–9. doi: 10.1007/s00198-009-1047-2. [DOI] [PMC free article] [PubMed] [Google Scholar]
- 28.Vilayphiou N, Boutroy S, Sornay-Rendu E, Van Rietbergen B, Munoz F, Delmas PD, Chapurlat R. Finite element analysis performed on radius and tibia HR-pQCT images and fragility fractures at all sites in postmenopausal women. Bone. 2010;46:1030–7. doi: 10.1016/j.bone.2009.12.015. [DOI] [PubMed] [Google Scholar]
- 29.West J, Fitzpatrick JM, Wang MY, Dawant BM, Maurer CR, Jr, Kessler RM, Maciunas RJ, Barillot C, Lemoine D, Collignon A, Maes F, Suetens P, Vandermeulen D, van den Elsen PA, Napel S, Sumanaweera TS, Harkness B, Hemler PF, Hill DL, Hawkes DJ, Studholme C, Maintz JB, Viergever MA, Malandain G, Woods RP, et al. Comparison and evaluation of retrospective intermodality brain image registration techniques. J Comput Assist Tomogr. 1997;21:554–66. doi: 10.1097/00004728-199707000-00007. [DOI] [PubMed] [Google Scholar]
- 30.Gao Z, Gu B, Lin J. Monomodal image registration using mutual information based methods. Image Vis Comput. 2008;26:164–73. [Google Scholar]
- 31.Ritter N, Owens R, Cooper J, Eikelboom RH, van Saarloos PP. Registration of stereo and temporal images of the retina. IEEE Trans Med Imaging. 1999;18:404–18. doi: 10.1109/42.774168. [DOI] [PubMed] [Google Scholar]
- 32.Carrillo A, Duerk JL, Lewin JS, Wilson DL. Semiautomatic 3-D image registration as applied to interventional MRI liver cancer treatment. IEEE Trans Med Imaging. 2000;19:175–85. doi: 10.1109/42.845176. [DOI] [PubMed] [Google Scholar]