

Abstract
Activation of N-SMase (neutral sphingomyelinase) is an established part of the response of cytokines such as TNF (tumour necrosis factor)-α. However, it remains unclear which of the currently cloned N-SMase isoforms (nSMase1, nSMase2 and nSMase3) are responsible for this activity. In MCF-7 cells, we found that TNF-α induces late, but not early, increases in N-SMase activity, and that nSMase2 is the primary isoform activated, most likely through post-transcriptional mechanisms. Surprisingly, overexpression of tagged or untagged nSMase3 in multiple cell lines had no significant effect on in vitro N-SMase activity. Moreover, only overexpression of nSMase2, but not nSMase1 or nSMase3, had significant effects on cellular sphingolipid levels, increasing ceramide and decreasing sphingomyelin. Additionally, only siRNA (small interfering RNA) knockdown of nSMase1 significantly decreased basal in vitro N-SMase activity of MCF-7 cells, whereas nSMase2 but not nSMase3 siRNA inhibited TNF-α-induced activity. Taken together, these results identify nSMase2 as the major TNF-α-responsive N-SMase in MCF-7 cells. Moreover, the results suggest that nSMase3 may not possess in vitro N-SMase activity and does not affect cellular sphingolipid levels in the cell lines evaluated. On the other hand, nSMase1 contributes to in vitro N-SMase activity, but does not affect cellular sphingolipids much.
Keywords: ceramide, cytokine, neutral sphingomyelinase 2 (nSMase2), neutral sphingomyelinase 3 (nSMase3), sphingo-myelinase, tumour necrosis factor-α (TNF-α)
INTRODUCTION
Ceramide, a bioactive sphingolipid, has been implicated in a variety of physiological processes and can be produced by a number of pathways [1]. Of these, SM (sphingomyelin) hydrolysis catalysed by SMases (sphingomyelinases) is considered a major pathway for stress-induced ceramide production, and the Mg2+-dependent N-SMases (neutral SMases) are considered strong candidates for mediating cytokine effects on ceramide. Notably, although there is considerable literature into the roles and regulation of endogenous N-SMase activities [2], the physiological roles of the cloned N-SMase proteins have yet to be fully elucidated.
Currently, four mammalian N-SMases have been identified and are termed nSMase1, nSMase2, nSMase3 and MA-nSMase (mitochondria-associated nSMase) [3–6]. Although all four proteins were reported to possess in vitro N-SMase activity, only nSMase2, nSMase3 and MA-nSMase appear to possess in vivo activity, i.e. increasing ceramide and decreasing SM levels when overexpressed [4–6]. In contrast, nSMase1 was found to act as a lyso-platelet-activating factor phospholipase C when overexpressed in cells, but had no effects on sphingolipid metabolism [7]. Nonetheless, more recent work has suggested that nSMase1 may function as an in vivo N-SMase in some circumstances [8]. Notably, the existence of multiple cloned N-SMases correlates well with previous reports of multiple N-SMase activities [9]. Of the four proteins, MA-nSMase, nS-Mase1 and nSMase2 belong to an extended family of N-SMases, a subset of the DNase superfamily, comprising bacterial SMases and the yeast SMases ISC1 (Saccharomyces cerevisiae) and CSS1 (Schizosaccharomyces pombe; reviewed in [10]). All family members possess a common catalytic core indicated by conserved residues in their catalytic regions. On the other hand, nSMase3 possesses very little homology with nSMase1, nSMase2 or MA-nSMase, and lacks the conserved catalytic core residues of the N-SMase family [5]. Moreover, as there appears to be a high degree of evolutionary conservation of nSMase3 from lower to higher mammals, there is the possibility that nSMase3 may comprise a distinct N-SMase family with specific functions. On the other hand, a double-knockout mouse of nSMase1 and nSMase2 possessed no in vitro N-SMase activity in brain, liver or bone extract [11]. Thus nSMase3 may have limited tissue-specific functions; indeed, nSMase3 was most highly expressed in cardiac and skeletal muscle tissue [5].
TNF (tumour necrosis factor)-α is a pleiotropic cytokine important for inflammation and cell death [12]. Considerable research over the last 20 years has implicated N-SMases as an important part of the TNF-α response [2]. Indeed, both nSMase2 and nSMase3 are reported to be activated by TNF-α [4,5,13–16], and nSMase2 has been implicated in acute TNF-α-induced inflammation [13,14], TNF-α-induced mitogenic responses [15] and TNF-α-induced modulation of the synapse [16]. In contrast, although reported to be regulated by TNF-α in MCF-7 cells and HT-29 cells, the role of nSMase3 in TNF-α responses is not fully clear [5,17]. As nSMase3 was reported to be downstream of FAN (factor associated with N-SMase activity) [5], it may be of relevance in associated physiologies such as the innate immune response and lysosome biogenesis [18,19]. However, nSMase2 was also reported to be downstream of FAN [20]. This suggests that nSMase2 and nSMase3 could play complementary roles in the TNF-α response or, alternatively, could compete with each other for the same signalling pathways. However, as yet, the relative contributions of nSMase2 and nSMase3 to TNF-α-induced N-SMase activity have not been investigated.
In the present study, we sought to determine the major TNF-α-activated N-SMase in MCF-7 cells. We present evidence, both by overexpression and siRNA (small interfering RNA) approaches, that nSMase2 is the primary TNF-α-responsive isoform in this cell line. Further to this, we were unable to demonstrate either in vitro or in vivo N-SMase activity on transient or stable overexpression of nSMase3 in multiple cell lines. In addition, siRNA knockdown of nSMase3 in MCF-7 cells did not significantly affect basal or TNF-α-induced in vitro N-SMase activity. Taken together, these results indicate that nSMase2 is the primary TNF-α-activated N-SMase in MCF-7 cells and suggest that nSMase3 may not primarily function as an N-SMase.
MATERIALS AND METHODS
Materials
MCF-7, HEK (human embryonic kidney)-293 and A549 cells were all obtained from A.T.C.C. RPMI 1640, MEM (minimal essential medium) and DMEM (Dulbecco’s modified Eagle’s medium) culture media, FBS (fetal bovine serum), blasticidin S HCl, superscript reverse transcriptase and the V5 monoclonal antibody were obtained from Invitrogen. HRP (horseradish peroxidase)-labelled secondary antibodies were from Santa Cruz Biotechnology. The ECL (enhanced chemiluminescence) kit was from ThermoScientific. Porcine brain SM and phosphatidylserine were from Avanti Polar Lipids. [choline-methyl-14C]SM was obtained from Dr A. Bielawska at the Lipidomics Core of the Medical University of South Carolina, Charleston, SC, U.S.A. Human TNF-α was from Peprotech. Unless indicated otherwise, all other chemicals were obtained from Sigma.
Plasmids
pRK–nSMase3, described previously [5], was generously provided by Dr M. Kronke and Dr K. Wiegmann (Institute for Medical Microbiology, Immunology and Hygiene, Medical Center, University of Cologne, Cologne, Germany). To produce a tagged construct, nSMase3 was amplified by PCR (forward primer, 5′-ATGACGACTTTCGGCGCCGTG-3′; reverse primer, 5′-GGGCTGGTGCAGCTTCCCCCG-3′) and subcloned into the pEF6/V5/TOPO vector (Invitrogen) placing the V5 tag at the C-terminus. The construct was sequenced prior to use. The nSMase1 and nSMase2 constructs have been described previously [7,13] and were also in the pEF6/V5/TOPO vector.
Cell culture and transfection
All cells were grown in medium with 10 % FBS at 37 °C in 5 %CO2 and a humidified atmosphere. A549 cells were cultured in high-glucose DMEM, HEK-293 cells were maintained in MEM, and MCF-7 cells were maintained in RPMI 1640. For transfection, cells were seeded in either 60-mm (2×10⁵) or 100-mm (4×10⁵) dishes. After 24 h (MCF-7 and A549 cells) or 48 h (HEK-293 cells), cells were transfected using Effectene reagents according to the manufacturer’s instructions (Qiagen). Cells were transfected for 24 h prior to collection for activity assays or for 40 h prior to collection for lipid analysis. To generate stable cell lines, 24 h after transfection, cells were passaged at a 1:5 ratio into medium containing 10 μg/ml blasticidin. Following selection for approx. 2–3 weeks, expression efficiency was assessed by confocal microscopy against the V5 tag. Stable cells were maintained in medium containing 7 μg/ml blasticidin. For siRNA experiments, cells were seeded in 60-mm (1.5×10⁵) dishes. After 24 h, cells were transfected with 20 nM negative control (AllStar; Qiagen), nSMase1, nSMase2 or nSMase3 siRNA (Qiagen) using oligofectamine according to the manufacturer’s protocol (Invitrogen). After 30 h, cells were incubated in fresh medium for 1–2 h prior to stimulation. The siRNA for nSMase2 has been described previously [13], whereas siRNA for nSMase1 was designed against the target sequence 5′-CAGCAGAGAGGTCGCCGTTGA-3′and nSMase3 against the target sequence 5′-CCCACAGTGGTTTGCTAAGAA-3′.
Real-time PCR
Following stimulation, mRNA from MCF-7 cells was extracted using the RNeasy kit (Qiagen). A portion (0.5–1 μg) of RNA was used to synthesize cDNA with the Superscript II Kit for first-strand synthesis (Invitrogen). Real-time RT (reverse transcription)–PCR was performed on a Bio-Rad iCycler detection system using iQ SYBR Green supermix (Bio-Rad). The standard reaction volume was 25 μl containing 12.5 μl of supermix, 6.5 μl of distilled water (Sigma), 100–500 nM oligonucleotide primers (IDT) and 5 μl of cDNA template (diluted ×12 in molecular biology grade distilled water). Initial steps of RT–PCR were 2 min at 50 °C for UNG erase activation, followed by a 3 min hold at 95 °C for enzyme activation. For all primers, cycles (n = 40) consisted of a 10 s melt at 98 °C, followed by a 45 s annealing at 55 °C and 45 s extension at 68 °C. The final step was 55 °C incubation for 1 min. All reactions were performed in triplicate and the threshold for cycle of threshold (Ct) analysis of all samples was set at 0.15 relative fluorescence unit. Data were normalized to an internal control gene, actin, to control for RNA preparation. Analysis of a single PCR product was confirmed by melt-curve analysis. Primers used were: nSMase1-sense, 5′-GGTGCTCAACGCCTATGTG-3′; nSMase1-antisense, 5′-CGTCTGCCTTCTTGGATGTG-3′; nSMase3-sense, 5′-GCCAACGACCTGGACGAGATC-3′; nSMase3-antisense, 5′-GCGAGTGTGAACTGCCTGAG-3′; actin-sense, 5′-ATTGGCAATGAGCGGTTCC-3′; actin-antisense, 5′-GGTA-GTTTCGTGGATGCCACA-3′.
In vitro N-SMase assay
Two protocols were utilized to assess in vitro N-SMase activity, both micelle-based assays using [choline-methyl-14C]SM The first protocol is in routine use in our laboratory and has been described previously [4,13]. The second protocol is as described by Krut et al. [5]. Although the assay principle is similar, different lysis and assay buffer compositions are utilized. These are outlined in the Supplementary Materials and methods section (at http://www.BiochemJ.org/bj/435/bj4350381add.htm).
Immunoblotting
Protein samples were prepared and analysed by PAGE utilizing the Criterion gel system (Bio-Rad), as described previously [13].
Immunofluorescence and confocal microscopy
Transfection of HEK-293 cells by nSMase1, nSMase2 and nSMase3 was analysed by indirect immunofluorescence and confocal microscopy, as described previously [13].
Analysis of sphingolipids by LC-MS/MS (liquid chromatography tandem MS)
For lipid analysis, cells were incubated in serum-free medium containing 0.1 % BSA for 3–4 h. Following starvation, cells were washed and scraped in ice-cold PBS, pelleted and stored at −80 °C. Lipids were extracted from cell pellets and analysed for ceramides, SMs and dihydroceramides as indicated by LC-MS/MS as described previously [21]. Lipid measurements were normalized to total lipid phosphate, measured as described in [21].
Statistical analysis
Values are represented as means ± S.E.M., unless otherwise indicated. For comparison of two groups, an unpaired Student’s t test was utilized with P < 0.05 being considered statistically significant and the number (n) of experiments as indicated. For comparison of multiple groups, one-way ANOVA with Dunnet’s post-hoc test was utilized with P < 0.05 being considered statistically significant and number (n) of experiments as indicated.
RESULTS
TNF-α increases N-SMase activity, but not nSMase1, nSMase2 or nSMase3 expression, in MCF-7 cells
Previous studies have reported both early and late activation of N-SMases in different cell types [4,5,13–16,22]. To clarify this in MCF-7 cells, both short and long time courses of stimulation were performed and endogenous N-SMase activity was assessed. Acute stimulation of MCF-7 cells with TNF-α (50 ng/ml) had no significant effect on N-SMase activity (Figure 1A). Similarly, a more acute stimulation of TNF-α (0–5 min) also had no significant effect on N-SMase activity (Figure 1B). In contrast, longer TNF-α stimulation (14 h) significantly increased endogenous N-SMase activity (33 ± 4 %; Figure 1C), consistent with previous studies [4,22]. To determine whether this was due to transcriptional regulation, the effect of TNF-α on nSMase1, nSMase2 and nSMase3 expression was investigated (Figure 1D). Results indicated no significant effect of TNF-α on nSMase2 or nSMase3 expression. In addition, TNF-α induced a small increase in nSMase1 expression. However, two-way ANOVA analysis with a Bonferroni post-hoc test indicated that this was not statistically significant (P > 0.05). Taken together, this suggests that prolonged but not acute TNF-α stimulation increases N-SMase activity in MCF-7 cells and this is probably through post-transcriptional mechanisms.
Figure 1. TNF-α stimulates late N-SMase activity in MCF-7 cells through post-transcriptional mechanisms.

(A–C) MCF-7 cells were plated and 24 h later were stimulated with TNF-α (50 ng/ml) as indicated (A, B) or for 14 h (C). N-SMase activity was assayed in vitro as described in the Materials and methods section. Results are mean ± S.E.M. N-SMase activity (*P < 0.05, n = 4). (D) MCF-7 cells were plated and stimulated with TNF-α (50 ng/ml) for 14 h. Expression of nSMase1, nSMase2 and nSMase3 was assessed by real-time PCR as described in the Materials and methods section. Results are mean ± S.E.M. normalized expression. For (D), results were analysed by a two-way ANOVA with Bonferroni post-hoc test (ns = not significant, n = 5).
TNF-α increases activity of overexpressed nSMase2 but not nSMase1 or nSMase3
As regulation of N-SMase activity by TNF-α appears to be post-translational, an overexpression approach was utilized to probe which of the cloned nSMases were responsible. Accordingly, MCF-7 cells were transiently transfected with empty vector, nSMase1, nSMase2 or nSMase3 for 10–12 h, stimulated with TNF-α for 14 h and assessed for in vitro N-SMase activity (Figure 2). Consistent with earlier studies [3,4], nSMase1 and nSMase2 overexpression significantly increased N-SMase activity in the absence of stimulation. Surprisingly, nSMase3 overexpression had little to no effect on basal N-SMase activity (Figure 2A). As expected, TNF-α significantly increased the activity of vector-transfected cells (30 ± 6 %; Figure 2B), consistent with the results above, but decreased nSMase1 activity (15 ± 10 %), although this was not statistically significant. In contrast, activity of overexpressed nSMase2 was significantly increased by TNF-α (66 ± 20 %). Additionally, activation of nSMase2 by TNF-α tended to be higher than observed in vector control cells, although this was not quite statistically significant. On the other hand, in nSMase3-transfected cells, TNF-α also increased N-SMase activity. However, given that overexpression of nSMase3 alone did not seem to affect basal activity and the fact that the increase observed was comparable with that seen in vector-transfected cells (20 ± 6 %, n = 4; P > 0.15), this probably reflects endogenous N-SMase activity (as also observed in Figure 1B). Taken together, these results suggest that nSMase2 is the major TNF-α-activated N-SMase in MCF-7 cells.
Figure 2. TNF-α increases the activity of overexpressed nSMase2 in MCF-7 cells.

MCF-7 cells were transfected with empty vector, nSMase1, nSMase2 or nSMase3 for 12 h prior to stimulation with vehicle (PBS) or TNF-α (50 ng/ml) for 14 h. N-SMase activity was assayed in vitro as described in the Materials and methods section. (A) Effect of nSMase1, nSMase2 and nSMase3 overexpression on N-SMase activity. Results are mean ± S.E.M. N-SMase activity (*P < 0.05, n = 4). (B) Effect of TNF-α on N-SMase activity in vector, nSMase1-, nSMase2-or nSMase3-overexpressing cells. (*P < 0.05, n = 3) Results, expressed as the fold change of TNF-α over vehicle, are means ± S.E.M. (*P < 0.05, n = 4).
Overexpression of V5–nSMase3 or pRK–nSMase3 in A549, HEK-293 and MCF-7 cells has no effect on N-SMase activity
In our previous experiments, nSMase3 overexpression had little effect on in vitro N-SMase activity in MCF-7 cells. However, immunoblot analysis indicated that V5–nSMase3 expression in MCF-7 cells was markedly lower than that of nSMase1 and nSMase2 (results not shown). Thus, to further explore nSMase3 effects on N-SMase activity, we performed graded transfections of 0, 1, 2, 3 and 5 μg of V5–nSMase3 to ensure that optimal transfection was achieved. Additionally, to be certain that the poor expression was not merely a consequence of the MCF-7 cells, similar transfections were performed in HEK-293 and A549 cells. The presence of V5–nSMase3 was clearly observed in all three cell lines (Figure 3), although there were notable differences in V5–nSMase3 protein at the various transfection concentrations. Nevertheless, despite the clear presence of nSMase3, no significant change in N-SMase activity in HEK-293, MCF-7 or A549 cells was observed (Table 1; P > 0.1). Taken together, this suggests that V5-tagged nSMase3 does not possess in vitro N-SMase activity when expressed in these cell lines.
Figure 3. Graded transfections of V5–nSMase3 in HEK-293, MCF-7 and A549 cells.
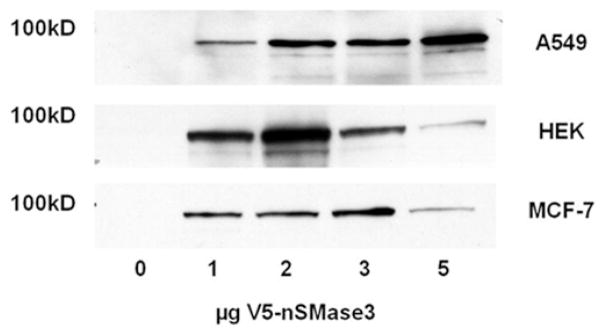
HEK-293, MCF-7 and A549 cells were transfected as indicated with V5–nSMase3 for 24 h. Cell lysates were analysed for V5–nSMase3 expression by immunoblotting. Blots shown are representative of at least four immunoblots for each cell line.
Table 1. Effect of graded V5–nSMase3 transfections on N-SMase activity of HEK-293, A549 and MCF-7 cells.
Cells were transfected with the amount of plasmid indicated or were mock-transfected. N-SMase activity was assayed in vitro. Results are mean ± S.E.M. N-SMase activity (pmol of ceramide/mg of protein per h). n = number of experiments.
| Transfection | HEK-293 cells (n = 5) | A549 cells (n = 4) | MCF-7 cells (n = 4) |
|---|---|---|---|
| Mock | 6.61 ± 1.31 | 7.59 ± 1.51 | 7.23 ± 1.46 |
| V5–nSMase3 (μg) | |||
| 1 | 7.26 ± 1.29 | 7.71 ± 1.63 | 6.83 ± 1.11 |
| 2 | 7.36 ± 1.26 | 6.61 ± 1.28 | 7.00 ± 1.19 |
| 3 | 8.19 ± 0.71 | 6.33 ± 0.80 | 7.05 ± 1.14 |
| 5 | 7.15 ± 1.35 | 6.99 ± 0.66 | 7.14 ± 1.31 |
To corroborate these findings and to be sure that the V5 tag was not adversely affecting activity of the enzyme, similar graded transfections of an untagged nSMase3 (pRK–nSMase3; [5]) in the same three cell lines were performed and in vitro N-SMase activity was assessed. As with V5–nSMase3, transfection of pRK–nSMase3 had no significant effect on in vitro N-SMase activity at any of the transfection concentrations used in any of the three cell lines (Table 2; P > 0.1). Taken together, this suggests that transient nSMase3 expression does not increase in vitro N-SMase activity.
Table 2. Effect of graded pRK–nSMase3 transfections on N-SMase activity of HEK-293, A549 and MCF-7 cells.
Cells were transfected with the amount of plasmid indicated or were mock-transfected. N-SMase activity was assayed in vitro. Results are mean ± S.E.M. N-SMase activity (pmol of ceramide/mg of protein per h). n = number of experiments.
| Transfection | HEK-293 cells (n = 5) | A549 cells (n = 4) | MCF-7 cells (n = 4) |
|---|---|---|---|
| Mock | 6.61 ± 1.31 | 8.64 ± 1.44 | 10.33 ± 1.00 |
| pRK–nSMase3 (μg) | |||
| 1 | 6.64 ± 1.16 | 8.47 ± 0.85 | 10.67 ± 1.03 |
| 3 | 6.80 ± 1.56 | 8.52 ± 1.14 | 10.54 ± 0.74 |
| 5 | 6.92 ± 1.66 | 8.36 ± 1.11 | 10.14 ± 0.82 |
Stable overexpression of nSMase1 and nSMase2, but not nSMase3, increases in vitro N-SMase activity in HEK-293 cells
Experiments with transient transfection suggested that nSMase3 may not possess in vitro N-SMase activity. However, as observed above, the degree of transient transfection of nSMase3 was highly variable. In order to get around this, HEK-293 cells stably expressing V5-tagged nSMase1 (HEK-nSMase1), nSMase2 (HEK-nSMase2), nSMase3 (HEK-nSMase3) or empty vector (HEK-vector) were generated; moreover, to avoid the possibility of clone-specific effects, polyclonal populations were generated. Validation of expression by confocal microscopy confirmed good stable transfection of all constructs (results not shown). Accordingly, in vitro N-SMase activity was assessed. As expected, HEK-nSMase1 and HEK-nSMase2 cells had significantly higher N-SMase activity compared with HEK-vector (Figure 4A). In contrast, stable nSMase3 expression did not increase in vitro N-SMase activity above endogenous activity. Together with the results above, this suggests further that nSMase3 does not possess in vitro N-SMase activity.
Figure 4. Stable overexpression of nSMase1 and nSMase2, but not nSMase3, increases in vitro activity of HEK-293 cells independently of assay conditions.

HEK-293 cells stably expressing vector (Vec), nSMase1 (NSM1 or N1), nSMase2 (NSM2 or N2) or nSMase3 (NSM3 or N3) were plated for 24 h. (A) N-SMase activity was assayed by the standard assay in vitro as described in the Materials and methods section. Results are mean ± S.E.M. N-SMase activity (*P < 0.05, n = 4). (B) N-SMase activity was assayed according to the method described by Krut et al. [5] utilizing either labelled SM (hot; light-grey bars) or both labelled and unlabeled SM (hot and cold; dark-grey bars). Results are mean ± S.E.M. N-SMase activity (*P < 0.05, n = 4). (C) Cell lysates were analysed for nSMase1, nSMase2 or nSMase3 expression by immunoblotting (IB) for V5. Blots shown are representative of at least five immunoblots. Molecular-mass markers (in kDa) are shown on the right.
To be certain that the assay conditions were not having adverse effects on nSMase3 and ‘masking’ its activity, experiments with stable cell lines were repeated under assay conditions identical with those used in the study characterizing the enzyme [5]. For these experiments, only labelled SM was added to the assay. However, as we were concerned that SM levels may be at too low a concentration for optimal detection of enzyme activity, experiments were also repeated with both labelled and unlabelled SM (total concentration, 10 μM; equivalent to 6.7 mol%, which is close to the Km of the substrate). Notably, in experiments with HEK-nSMase2 cells significantly more than 10 % of the substrate given in vitro was hydrolysed; thus reaction kinetics were probably altered. This is probably due to the high level of expression in HEK-293 cells as seen by immunoblotting (Figure 4C); nonetheless, this confirms that the assay works effectively. Importantly, N-SMase activity was also significantly higher in HEK-nSMase1 cells compared with HEK-vector (Figure 4B; P < 0.05). However, again, HEK-nSMase3 cells showed no significant difference in N-SMase activity compared with HEK-vector (Figure 4B). As observed above, immunoblot analysis demonstrated that stable HEK-nSMase2 cells had considerably higher protein expression than either stable HEK-nSMase1 or HEK-nSMase3 cells. However, results also indicated that nSMase1 and nSMase3 had very comparable expression in these experiments (Figure 4C). Indeed, if anything, nSMase1 expression was lower than that of nSMase3. Despite this, only nSMase1 was able to significantly increase N-SMase activity. This confirms sensitivity of the SMase assay at lower expression levels and, taken together, suggests further that, unlike nSMase1 and nSMase2, nSMase3 does not possess in vitro N-SMase activity.
Transient and stable nSMase3 transfection had no effect on sphingolipid levels in MCF-7 cells
Although nSMase3 did not possess in vitro activity, studies have suggested that nSMase3 can regulate sphingolipid levels in cells [17]. This suggested the possibility that nSMase3 may indirectly affect sphingolipid levels by an alternate mechanism. To probe this, we utilized both transient and stable overexpression approaches. Initially, MCF-7 cells were transiently transfected with vector, nSMase2 or nSMase3 for 40 h, and the levels of SM and ceramides were then analysed by MS and normalized to total lipid phosphate levels. As expected, nSMase2 overexpression significantly increased total ceramide levels (Figure 5A) with a concomitant decrease in SM levels, although the latter was not quite statistically significant owing to the large cellular SM mass (Figure 5B). In contrast, nSMase3 did not significantly alter the levels of either ceramide or SM (Figure 5). Taken together, these results match the in vitro results described above and suggest that nSMase2, but not nSMase3, possesses SMase activity.
Figure 5. Transient overexpression of V5–nSMase2, but not V5–nSMase3, in MCF-7 cells alters cellular sphingolipid levels.

MCF-7 cells were transiently transfected with vector, V5–nSMase2 or V5–nSMase3 for 40 h. Total SM (A) and ceramide (B) levels were analysed by LC-MS/MS as described in the Materials and methods section. Lipid levels were normalized to total lipid phosphate. Results, expressed as pmol of lipid/nmol of phosphate, are means ± S.E.M. (*P < 0.05, n = 4).
To consolidate these findings using stable transfection, SM and ceramide levels in HEK-nSMase1, HEK-nSMase2 and HEK-nSMase3 stable cell lines were analysed utilizing HEK-vector as the control. Results showed that ceramide levels were greatly increased in HEK-nSMase2 cells and were slightly increased in HEK-nSMase1 cells. In contrast, ceramide levels were unchanged in HEK-nSMase3 cells compared with the HEK-vector (Figure 6B). Consistent with these results, HEK-nSMase2 cells displayed significantly lower SM levels compared with vector controls. In contrast, neither HEK-nSMase1 nor HEK-nSMase3 cells had statistically significant changes in SM (Figure 6A). Further analysis of these findings by calculating the ceramide/SM ratio of the various cell lines indicated that only HEK-nSMase2 cells displayed a significantly altered profile compared with vector control (Supplementary Figure S1 at http://www.BiochemJ.org/bj/435/bj4350381add.htm). In contrast, HEK-nSMase1 cells possessed a slightly higher ratio but this was not statistically significant. Similarly, the ceramide/SM ratio in HEK-nSMase3 cells was also not significantly different.
Figure 6. Overexpression of nSMase2, but not nSMase1 or nSMase3, in HEK-293 cells alters cellular sphingolipid levels.

HEK-293 cells stably expressing vector, nSMase1 (NSM1), nSMase2 (NSM2) or nSMase3 (NSM3) were plated for 48 h. Total SM (A) and ceramide (B) levels were analysed by LC-MS/MS as described in the Materials and methods section. Lipid levels were normalized to total lipid phosphate. Results, expressed as pmol of lipid/nmol of phosphate, are means ± S.E.M. (**P < 0.01, n = 3). (C) HEK-293 cells were transiently transfected with nSMase1, nSMase2 or nSMase3 for 24 h. Transfection efficiency was determined by indirect immunofluorescence and confocal microscopy, and protein expression was determined by immunoblotting as described in the Materials and methods section. Confocal images are representative of at least five fields taken from each of four independent experiments; immunoblotting is representative of four independent experiments. Molecular-mass markers (in kDa) are shown on the left. (D) HEK-293 cells were transiently transfected with nSMase1, nSMase2 or nSMase3 for 48 h. Cellular ceramide levels were analysed by LC-MS/MS. Results are mean ± S.E.M. total ceramide levels normalized to total lipid phosphate. (**P < 0.01, one-way ANOVA with Dunnet’s post-hoc test, n = 4).
Although these results suggest that nSMase3 cannot regulate cellular sphingolipids, one drawback of these experiments was the obvious differential expression of the three isoforms in the respective cell lines, with nSMase2 showing significantly higher expression than either nSMase1 or nSMase3. To circumvent this problem, experiments in HEK-293 cells were repeated utilizing transient transfection, as in MCF-7 cells above (Figure 5). However, various amounts of DNA for each construct were transfected in order to obtain comparable expression of all isoforms. Indirect immunofluorescence and confocal microscopy confirmed that all three constructs transfected with similar efficiency (Figure 6C) and demonstrated much closer expression of the three isoforms than observed in the stable transfectants (Figure 6C). Importantly, despite equal expression, only nSMase2 overexpression significantly increased ceramide levels compared with control (Figure 6D). Additionally, SM levels were not significantly different following transfection of any of the N-SMases, although they tended to be lower in nSMase2-overexpressing cells (results not shown). These results closely match what was observed in transiently transfected MCF-7 cells and, taken together, indicate that nSMase2 overexpression is sufficient to modulate SM and ceramide levels, but that nSMase3 is unable to regulate sphingolipid levels either directly or indirectly.
Overexpression of nSMase2 modulates multiple ceramide/SM species in HEK-293 cells
The results described above on total ceramide and SM levels demonstrated differential effects of nSMase1, nSMase2 and nSMase3 overexpression. However, although there can be no net change in total ceramide or SM levels, this could be a consequence of opposing regulation of individual ceramide/SM species, i.e. increases in some species are ‘cancelled out’ by decreases in other species. Accordingly, SM and ceramide species were analysed in the stable HEK-293 cell lines and ceramide species were analysed following transient transfection of HEK-293 cells with vector, nSMase1, nSMase2 or nSMase3 (Figure 7). Overexpression of nSMase2 increased many ceramide species including long-chain (C14, C16, C18 and C18:1) and very-long-chain (C24 and C24:1) ceramide, although these effects were clearly more pronounced with stable overexpression (Figure 7A) compared with transient overexpression (Figure 7B). Consistent with this, the corresponding SM species were decreased following stable nSMase2 overexpression (Figure 7C). In contrast with this, nSMase1 overexpression induced considerably smaller but consistent increases in C16, C18 and C24:1 ceramide, but had no major effects on SM levels. Finally, nSMase3 overexpression had no significant effect on any of the ceramide or SM species analysed.
Figure 7. Overexpression of nSMase2, but not nSMase1 or nSMase3, in HEK-293 cells alters the levels of multiple SM and ceramide species.

(A) HEK-293 cells were transiently transfected with nSMase1, nSMase2 or nSMase3 for 48 h and the levels of multiple ceramide species were analysed by LC-MS/MS as described in the Materials and methods section. Results are mean ± S.E.M. ceramide levels normalized to total lipid phosphate (n = 4). (B and C) HEK-293 cells stably expressing vector, nSMase1 (NSM1), nSMase2 (NSM2) or nSMase3 (NSM3) were plated for 48 h. The levels of multiple ceramide (B) and SM (C) species were analysed by LC-MS/MS. Lipid levels were normalized to total lipid phosphate. Results, expressed as pmol of lipid/nmol of phosphate, are means ± S.E.M. (n = 3).
siRNA knockdown of nSMase3 has no effect on endogenous N-SMase activity of MCF-7 cells
Thus far, both in the literature and in the present study, only nSMase3 overexpression has been utilized as a tool to study the enzyme. In contrast, the effect of siRNA knockdown of endogenous nSMase3 expression on N-SMase activity has not been examined. To consolidate our overexpression results above, the effects of nSMase1, nSMase2 and nSMase3 siRNA on N-SMase activity in MCF-7 cells were examined. The efficacy of nSMase1, nSMase2 and nSMase3 siRNA was established and all were found to significantly decrease the mRNA levels of their respective targets by at least 50 % (Figure 8A). Notably, nSMase1 siRNA significantly decreased basal N-SMase activity of MCF-7 cells by approx. 60 ± 5 %. (Figure 8B). However, neither nSMase2 nor nSMase3 siRNA had significant effects on basal N-SMase activity, thus suggesting that the majority of endogenous N-SMase activity of subconfluent MCF-7 cells when measured in vitro is due to nSMase1.
Figure 8. Effects of nSMase1, nSMase2 and nSMase 3 siRNA on basal and TNF-α -stimulated activity in MCF-7 cells.
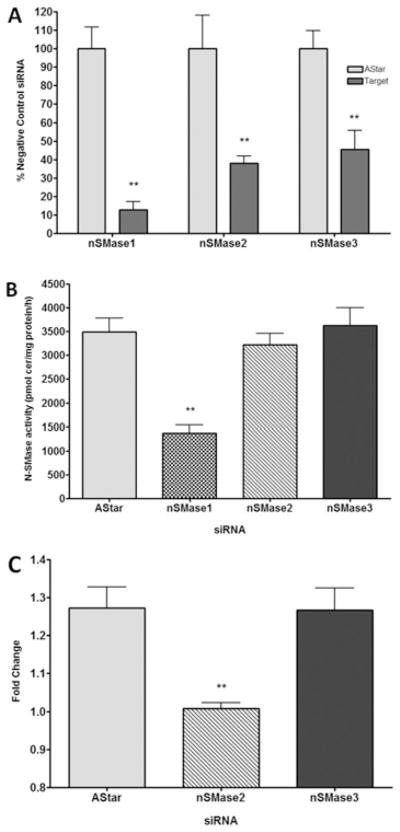
(A) MCF7 cells were transfected with negative control (AllStar), nSMase1, nSMase2 or nSMase3 siRNA for 72 h. Expression of nSMase1, nSMase2 and nSMase3 was assessed by real-time PCR as described in the Materials and methods section. Results, expressed as a percentage of the negative control (AStar), are means ± S.E.M. (**P < 0.01, n = 3)(B) MCF-7 cells were transfected with negative control (AllStar), nSMase1, nSMase2 or nSMase3 siRNA for 72 h. N-SMase activity was assayed in vitro as described in the Materials and methods section. Results are mean ± S.E.M. N-SMase activity (**P < 0.01, n = 4). (C) MCF-7 cells were transfected with negative control (AStar), nSMase2 or nSMase3 siRNA for 60 h and stimulated with vehicle (PBS) or TNF-α (50 ng/ml) for 14 h. N-SMase activity was assayed in vitro. Results, expressed as the fold change of TNF-α over vehicle, are means ± S.E.M. (**P < 0.01, at least three independent experiments).
Knockdown of nSMase2, but not nSMase1 or nSMase3, decreases TNF-α -induced N-SMase activity in MCF-7 cells
To identify which N-SMase(s) contribute to TNF-α-induced activity, an RNAi (RNA interference) approach was again utilized (Figure 8C). Cells were pre-treated with negative control, nSMase2 or nSMase3 siRNA, stimulated with vehicle or TNF-α for 14 h and assessed for in vitro N-SMase activity. TNF-α significantly increased N-SMase activity in negative-control siRNA cells (26 ± 6 %), although the responses were somewhat blunted compared with non-siRNA-transfected cells (Figure 1). Importantly, pre-treatment with nSMase2 siRNA significantly inhibited the TNF-α-induced increase compared with negative-control cells (1 ± 1 %; P < 0.01). In contrast, nSMase3 siRNA had no significant effect on TNF-α activation of N-SMase activity compared with negative-control siRNA-treated cells (26 ± 7 %). Taken together, these results confirm that nSMase2, but not nSMase3, is activated by TNF-α in MCF-7 cells and indicate that nSMase2 is the primary TNF-responsive N-SMase in this cell line.
DISCUSSION
Activation of N-SMases has been reported in response to a number of stimuli, including cytokines, chemotherapeutic drugs and oxidative stress [2]. However, with the identification of multiple cloned N-SMase proteins, the identity of those responsible for these activities is not always clear. In the present study, we investigated the contribution of nSMase1, nSMase2 and nSMase3 to TNF-α-induced N-SMase activity in MCF-7 cells. We found that stimuli induce late, but not early, increases in N-SMase activity in this cell line and that this is primarily due to nSMase2. Notably, TNF-α activation of nSMase2 is likely to occur through post-transcriptional mechanisms. Finally, we also present evidence that manipulation of nSMase3 levels either by transient or stable overexpression, or by siRNA knockdown has no significant effect on either in vitro N-SMase activity or sphingolipid levels. Taken together, this leads us to conclude that nSMase3 may not primarily function as an SMase.
The regulation of endogenous N-SMase activity by TNF-α in many cell lines is well-established [4,5,13–16,22] and, since the cloning of mammalian nSMase isoforms, studies have begun to address their physiological roles. For example, nSMase2 has been implicated in induction of adhesion proteins in A549 cells [13], mitogenic responses in smooth muscle cells [15], eNOS (endothelial NO synthase) activation in HUVECs (human umbilical vein endothelial cells) [14], and modulation of the synapse in neuronal cells [16]. More recent findings have found that nSMase2 directly interacted with the TNFR (TNF receptor)-binding protein FAN through the protein EED (embryonic ectodermal development) [20], thereby confirming a direct link between nSMase2 and the TNFR. In contrast with nSMase2, comparatively little is known about the role of nSMase3 in TNF responses, although it was reported to be transcriptionally induced by TNF-α in HT-29 cells [17]. In addition, nSMase3 was also reported to be downstream of FAN when expressed in MCF-7 cells [5], although it is unclear whether this occurs through similar mechanisms as described above for nSMase2. Taken together, these studies suggest that both nSMase2 and nSMase3 could have complementary, overlapping, or, indeed, opposing roles in the TNF response. However, their relative contributions to the TNF-α-induced N-SMase activity had yet to be addressed. In the present study, we have found that TNF-α induces a late increase in N-SMase activity and this is probably through post-translational mechanisms. More importantly, by utilizing overexpression and siRNA, nSMase2 was identified as the primary TNF-α-activated N-SMase in this system. Consistent with post-translational activation, TNF-α was able to activate overexpressed nSMase2, but tended to suppress activity of overexpressed nSMase1, although this was not statistically significant. Overall, these results agree with an earlier report from our laboratory [4]. This also correlates with GW4869 inhibition of TNF-α-induced N-SMase activity in MCF-7 cells [22], as GW4869 was also found to inhibit nSMase2 in vitro [4]. As TNF-α did not induce early increases in endogenous N-SMase activity in MCF-7 cells, the identity of the early activated N-SMase was not addressed in the present study. However, it should be noted that a number of other studies have reported that this is also attributable to nSMase2 in A549 cells, HUVECs, mouse embryonic fibroblasts, smooth muscle cells and Jurkat cells among others [13–16,20,23]. Taken together, this is strong evidence that nSMase2 is the major early TNF-α-activated N-SMase isoform in a variety of cell types.
During the course of the present study, we were surprised to find that we could not detect in vitro N-SMase activity when overexpressing nSMase3. This was in complete contrast with the large increase in in vitro N-SMase activity observed with nSMase2 and the modest increases in in vitro N-SMase activity of nSMase1. Although transient transfection of nSMase3 was not as efficient as that of nSMase1 or nSMase2, further assessment by various transfection ‘doses’ of nSMase3 plasmid again demonstrated no significant effects on in vitro N-SMase activity despite clear alterations in V5–nSMase3 protein levels. Importantly, this was not due to the cell type and was also observed with an untagged pRK–nSMase3 construct, ruling out the possibility that the V5 tag had interfered with the enzymatic activity in some way. Moreover, even stable expression of nSMase3 in HEK-293 cells also had no effect on in vitro N-SMase activity, despite clearer expression of nSMase3. Certainly, a comparable stable expression of nSMase1 in HEK-293 cells was sufficient to increase N-SMase activity, suggesting that this was not an issue of sensitivity of the assay. Furthermore, the lack of N-SMase activity of nSMase3 was not dependent on experimental conditions, as assays were performed utilizing both the standard assay in our laboratory as well as the distinct conditions used by other laboratories. Overall, we consider this to be very strong evidence that nSMase3 does not possess in vitro N-SMase activity.
Despite the lack of in vitro N-SMase activity, we considered the possibility that nSMase3 may still regulate sphingolipid levels in vivo but may do so indirectly by alternative mechanisms. Thus ceramide and SM levels in transient and stable overexpressing cells were measured. Consistent with previous results from our laboratory [4], nSMase2 overexpression (stable and transient) significantly increased ceramide levels and decreased SM levels. In contrast, stable nSMase1 overexpression had no significant effect on cellular SM levels and induced a small, albeit insignificant, increase in cellular ceramide levels. Notably, nSMase3 overexpression (stable or transient) had no significant effect on ceramide or SM levels. One potential drawback of these experiments was the differential expression of the three N-SMase isoforms. Consequently, transient transfection experiments were repeated in HEK-293 cells utilizing different amounts of DNA for each N-SMase to produce more comparable expression. Analysis of protein expression by immunofluorescence and immunoblotting confirmed that all N-SMases were present at similar levels and efficiency. More importantly, as observed in MCF-7 cells, neither nSMase1 nor nSMase3 were able to increase ceramide levels. In contrast, ceramide was significantly increased by nSMase2. Notably, SM levels were not significantly affected by transient transfection of any isoforms, although levels had a trend to be lower in nSMase2 cells compared with controls (results not shown). The lack of effect of nSMase3 on cellular sphingolipids disagrees with a previous study [17], although this could be due to the cell type used (MCF-7 and HEK-293 cells in the present study compared with HT-29 cells). However, Corcoran et al. [17] reported decreases in SM in stable nSMase3 cells, but no increases in ceramide. Moreover, there was no correlation between nSMase3 expression and decrease in SM: one cell line had significantly greater expression of nSMase3, but a smaller decrease in SM. Crucially, in the previous study [17], in vitro N-SMase activity was not assessed in either cell line. Thus we speculate that the effects on SM seen are probably not due to overexpression of nSMase3.
As noted above, both previous studies with nSMase3 utilized overexpression as a tool to study the enzyme and its downstream effects. However, the effects of nSMase3 siRNA on N-SMase activity were not assessed. To determine further whether nSMase3 is indeed a bona fide SMase, we undertook siRNA experiments in the present study. Crucially, down-regulation of nSMase1 significantly reduced basal N-SMase activity. In contrast, nSMase2 siRNA had little effect on basal N-SMase activity, but inhibited TNF-α-induced N-SMase activity. Notably, a previous study from our laboratory found that nSMase2 is more important for N-SMase activity as cells approach confluence [24]. In addition, nSMase3 down-regulation had no effect on basal activity, despite a significant suppression of nSMase3 mRNA (>50 %). Moreover, nSMase3 was not important for TNF-α-induced N-SMase activity in MCF-7 cells. Although this is not evidence alone that nSMase3 does not function as an N-SMase, when taken together with the considerable results utilizing transient and stable nSMase3 overexpression, this provides strong evidence that nSMase3 may not primarily function as an N-SMase.
The lack of in vitro and in vivo SMase activity of nSMase3 is perhaps unsurprising. Indeed, the amino acid sequence of nSMase3 bears little homology with any members of the extended N-SMase family [10], which includes both bacterial and yeast SMase isoforms. More importantly, nSMase3 does not seem to possess the core catalytic residues that are present in N-SMase family members that are critical for SMase activity [10]. The fact that nSMase3 shows high conservation from lower to higher organisms [6] suggests it may play an alternative distinct role; however, the present study now raises a major question. If nS-Mase3 does not primarily function as a SMase, what is its primary function? Given the reported tissue distribution, noting particularly high expression in cardiac tissue, this may be a more useful system to study further the function of the protein. Moreover, although our results suggest that nSMase3 does not regulate sphingolipid levels, or possess in vitro SMase activity, we did observe increased nSMase3 expression in response to doxorubicin in MDA-MB-231 cells (C.J. Clarke, unpublished work), suggesting that it may play a role in cell stress responses in some cell types, as was noted previously [17]. Overall, the true function of nSMase3 requires further study. Although we have been unable to identify its function, BLAST analysis indicated that nSMase3 displayed close homology with a hypothetical rat nucleotide trisphosphate hydrolase (P.L. Roddy and Y.A. Hannun, unpublished work). This may be a good starting point for future study. Moreover, it should also be noted that, although nSMase1 was reported not to function as an in vivo N-SMase, more recent studies have suggested that it may act as an N-SMase in some circumstances [8]. Although this may not be the case with nSMase3, owing to a lack of in vitro activity, the possibility remains that nSMase3 may influence cellular sphingolipids in some circumstances, particularly given the proposed role of nSMase3 and the well-established role of sphingolipids in the cell stress response [1,17].
The results in the present study also confirm that nSMase1 possesses in vitro N-SMase activity but lacks the capacity to modulate cellular sphingolipids in vivo. This is very consistent with previous results from both our laboratory and others [3,7]. Nonetheless, nSMase1 has been reported to be important for stress-induced ceramide generation in some instances [9,25]. This raises the possibility that nSMase1 may normally be sequestered from SM and can only function as an N-SMase when it is able to gain access to its substrate; indeed, nSMase1 could function to remove any ‘stray’ SM that finds its way to the ER (endoplasmic reticulum) where the enzyme is localized. Importantly, results of the present study demonstrate that a large majority of the basal N-SMase activity of MCF-7 cells can be attributed to nSMase1. As nSMase1 appears to be ubiquitously expressed [3], this should be taken into account when interpreting experimental data on N-SMase activation. Indeed, a high basal activity could effectively ‘mask’ significant activation of other N-SMase isoforms.
Finally, although we have investigated the role of nSMase1, nSMase2 and nSMase3 in TNF responses, it should also be noted that a fourth mammalian N-SMase, termed MA-nSMase, was recently identified by our laboratory [6]. MA-nSMase is homologous with a previously identified zebrafish mitochondrial SMase [26]. However, as yet, only a murine MA-nSMase has been identified and a human homologue has yet to be found. Thus the contribution of MA-nSMase to the TNF-α response in this cell line was not assessed. However, as MA-nSMase is preferentially expressed in testes and skin [6], these may be the best systems to investigate the regulation and roles of MA-nSMase. Indeed, this is currently the subject of further study in our laboratory.
In conclusion, by utilizing gain-of-function and loss-of-function approaches, the present study has found that nSMase2 is the primary TNF-α-activated N-SMase in MCF-7 cells. Moreover, we report further that nSMase3 does not possess in vitro and in vivo N-SMase activity, suggesting that it may not primarily function as a SMase.
Supplementary Material
Acknowledgments
We thank the Medical University of South Carolina Lipidomics Core for the analysis of cellular sphingolipids, and the Molecular Imaging Core for the use of the confocal microscope. We are also grateful to Dr Nabil Matmati, Dr David Montefusco and Dr Russell Jenkins for helpful discussion.
FUNDING
This work was supported by the National Institutes of Health (NIH) [grant number GM 43825 (to Y.A.H.)]. Work conducted in the Lipidomics Core was supported by the NIH [grant number C06 RR01882] from the extramural research programme of the National Center for Research Resources. The Molecular Imaging Core is supported by the NIH [grant number P30 CA138313].
Abbreviations used
- DMEM
Dulbecco’s modified Eagle’s medium
- FBS
fetal bovine serum
- HEK
human embryonic kidney
- HEK-vector
HEK-293 cells stably expressing V5-tagged empty vector
- HUVEC
human umbilical vein endothelial cell
- LC-MS/MS
liquid chromatography tandem MS
- MEM
minimal essential medium
- RT
reverse transcription
- siRNA
small interfering RNA
- SM
sphingomyelin
- SMase
sphingomyelinase
- N-SMase
neutral SMase
- FAN
factor associated with N-SMase activity
- MA-nSMase
mitochondria-associated nSMase
- HEK-nSMase1 etc
HEK-293 cells stably expressing V5-tagged nSMase1 etc
- TNF
tumour necrosis factor
- TNFR
TNF receptor
Footnotes
AUTHOR CONTRIBUTION
Christopher Clarke and Emily Cloessner designed and performed the experiments. Christopher Clarke analysed the data. Patrick Roddy generated the constructs used. Yusuf Hannun supervised the project and provided funding support. The manuscript was written by Christopher Clarke and Yusuf Hannun.
References
- 1.Hannun YA, Obeid LM. Principles of bioactive lipid signaling: lessons from sphingolipids. Nat Rev Mol Cell Biol. 2008;9:139–150. doi: 10.1038/nrm2329. [DOI] [PubMed] [Google Scholar]
- 2.Wu BX, Clarke CJ, Hannun YA. Mammalian neutral sphingomyelinases: regulation and roles in cell signaling responses. Neuromolecular Med. 2010;12:320–330. doi: 10.1007/s12017-010-8120-z. [DOI] [PMC free article] [PubMed] [Google Scholar]
- 3.Tomiuk S, Hofmann K, Nix M, Zumbansen M, Stoffel W. Cloned mammalian neutral sphingomyelinase: functions in sphingolipid signaling? Proc Nat Acad Sci USA. 1998;95:3638–3643. doi: 10.1073/pnas.95.7.3638. [DOI] [PMC free article] [PubMed] [Google Scholar]
- 4.Marchesini N, Luberto C, Hannun YA. Biochemical properties of mammalian neutral sphingomyelinase 2 and its role in sphingolipid metabolism. J Biol Chem. 2003;278:13775–13783. doi: 10.1074/jbc.M212262200. [DOI] [PubMed] [Google Scholar]
- 5.Krut O, Wiegmann K, Kashkar H, Yazdanpanah B, Kronke M. Novel TNF-responsive mammalian neutral sphingomyelinase-3 is a C-tail-anchored protein. J Biol Chem. 2006;281:13784–13793. doi: 10.1074/jbc.M511306200. [DOI] [PubMed] [Google Scholar]
- 6.Wu BX, Rajagopalan V, Roddy PL, Clarke CJ, Hannun YA. Identification and characterization of murine mitochondrial-associated sphingomyelinase (MA-nSMase), the mammalian sphingomyelin phosphodiesterase 5. J Biol Chem. 2010;285:17993–18002. doi: 10.1074/jbc.M110.102988. [DOI] [PMC free article] [PubMed] [Google Scholar]
- 7.Sawai H, Domae N, Nagan N, Hannun YA. Function of the cloned putative neutral sphingomyelinase as lyso-platelet activating factor-phospholipase C. J Biol Chem. 1999;274:38131–38139. doi: 10.1074/jbc.274.53.38131. [DOI] [PubMed] [Google Scholar]
- 8.Tonnetti L, Veri MC, Bonvini E, D’Adamio L. A role for neutral sphingomyelinase-mediated ceramide production in T cell receptor-induced apoptosis and mitogen-activated protein kinase-mediated signal transduction. J Exp Med. 1999;189:1581–1589. doi: 10.1084/jem.189.10.1581. [DOI] [PMC free article] [PubMed] [Google Scholar]
- 9.Jung SY, Suh JH, Park HJ, Jung KM, Kim MY, Na DS, Kim DK. Identification of multiple forms of membrane-associated neutral sphingomyelinase in bovine brain. J Neurochem. 2000;75:1004–1014. doi: 10.1046/j.1471-4159.2000.0751004.x. [DOI] [PubMed] [Google Scholar]
- 10.Clarke CJ, Snook CF, Tani M, Matmati N, Marchesini N, Hannun YA. The extended family of neutral sphingomyelinases. Biochemistry. 2006;45:11247–11256. doi: 10.1021/bi061307z. [DOI] [PubMed] [Google Scholar]
- 11.Stoffel W, Jenke B, Block B, Zumbansen M, Koebke J. Neutral sphingomyelinase 2 (smpd3) in the control of postnatal growth and development. Proc Natl Acad Sci USA. 2005;102:4554–4559. doi: 10.1073/pnas.0406380102. [DOI] [PMC free article] [PubMed] [Google Scholar]
- 12.Aggarwal BB. Signalling pathways of the TNF superfamily: a double-edged sword. Nat Rev Immunol. 2003;3:745–756. doi: 10.1038/nri1184. [DOI] [PubMed] [Google Scholar]
- 13.Clarke CJ, Truong TG, Hannun YA. Role for neutral sphingomyelinase-2 in tumor necrosis factor α-stimulated expression of vascular cell adhesion molecule-1 (VCAM) and intercellular adhesion molecule-1 (ICAM) in lung epithelial cells: p38 MAPK is an upstream regulator of nSMase2. J Biol Chem. 2007;282:1384–1396. doi: 10.1074/jbc.M609216200. [DOI] [PubMed] [Google Scholar]
- 14.De Palma C, Meacci E, Perrotta C, Bruni P, Clementi E. Endothelial nitric oxide synthase activation by tumor necrosis factor α through neutral sphingomyelinase 2, sphingosine kinase 1, and sphingosine 1 phosphate receptors: a novel pathway relevant to the pathophysiology of endothelium. Arterioscler Thromb Vasc Biol. 2006;26:99–105. doi: 10.1161/01.ATV.0000194074.59584.42. [DOI] [PubMed] [Google Scholar]
- 15.Tellier E, Negre-Salvayre A, Bocquet B, Itohara S, Hannun YA, Salvayre R, Auge N. Role for furin in tumor necrosis factor α-induced activation of the matrix metalloproteinase/sphingolipid mitogenic pathway. Mol Cell Biol. 2007;27:2997–3007. doi: 10.1128/MCB.01485-06. [DOI] [PMC free article] [PubMed] [Google Scholar]
- 16.Wheeler D, Knapp E, Bandaru VV, Wang Y, Knorr D, Poirier C, Mattson MP, Geiger JD, Haughey NJ. Tumor necrosis factor-α-induced neutral sphingomyelinase-2 modulates synaptic plasticity by controlling the membrane insertion of NMDA receptors. J Neurochem. 2009;109:1237–1249. doi: 10.1111/j.1471-4159.2009.06038.x. [DOI] [PMC free article] [PubMed] [Google Scholar]
- 17.Corcoran CA, He Q, Ponnusamy S, Ogretmen B, Huang Y, Sheikh MS. Neutral sphingomyelinase-3 is a DNA damage and nongenotoxic stress-regulated gene that is deregulated in human malignancies. Mol Cancer Res. 2008;6:795–807. doi: 10.1158/1541-7786.MCR-07-2097. [DOI] [PMC free article] [PubMed] [Google Scholar]
- 18.Montfort A, de Badts B, Douin-Echinard V, Martin PG, Iacovoni J, Nevoit C, Therville N, Garcia V, Bertrand MA, Bessières MH, et al. FAN stimulates TNFα-induced gene expression, leukocyte recruitment, and humoral response. J Immunol. 2009;183:5369–5378. doi: 10.4049/jimmunol.0803384. [DOI] [PubMed] [Google Scholar]
- 19.Möhlig H, Mathieu S, Thon L, Frederiksen MC, Ward DM, Kaplan J, Schütze S, Kabelitz D, Adam D. The WD repeat protein FAN regulates lysosome size independent from abnormal downregulation/membrane recruitment of protein kinase C. Exp Cell Res. 2007;313:2703–2718. doi: 10.1016/j.yexcr.2007.04.020. [DOI] [PMC free article] [PubMed] [Google Scholar]
- 20.Phillipp S, Puchert M, Adam-Klages S, Tchikov V, Winoto-Morbach S, Mathieu S, Deerberg A, Kolker L, Marchesini N, Kabelitz D, et al. The polycomb group protein EED couples TNF receptor 1 to neutral sphingomyelinase. Proc Nat Acad Sci USA. 2010;107:1112–1117. doi: 10.1073/pnas.0908486107. [DOI] [PMC free article] [PubMed] [Google Scholar]
- 21.Bielawski J, Pierce JS, Snider J, Rembiesa B, Szulc ZM, Bielawska A. Sphingolipid analysis by high performance liquid chromatography-tandem mass spectrometry (HPLC-MS/MS) Adv Exp Med Biol. 2010;688:46–59. doi: 10.1007/978-1-4419-6741-1_3. [DOI] [PubMed] [Google Scholar]
- 22.Luberto C, Hassler DF, Signorelli P, Okamoto Y, Sawai H, Boros E, Hazen-Martin DJ, Obeid LM, Hannun YA, Smith GK. Inhibition of tumor necrosis factor-induced cell death in MCF7 by a novel inhibitor of neutral sphingomyelinase. J Biol Chem. 2002;277:41128–41139. doi: 10.1074/jbc.M206747200. [DOI] [PubMed] [Google Scholar]
- 23.Devillard R, Galvani S, Thiers JC, Guenet JL, Hannun Y, Bielawski J, Nègre-Salvayre A, Salvayre R, Augé N. Stress-induced sphingolipid signaling: role of type-2 neutral sphingomyelinase in murine cell apoptosis and proliferation. PLoS ONE. 2010;5:e9826. doi: 10.1371/journal.pone.0009826. [DOI] [PMC free article] [PubMed] [Google Scholar]
- 24.Marchesini N, Osta W, Bielawski J, Luberto C, Obeid LM, Hannun YA. Role for mammalian neutral sphingomyelinase 2 in confluence-induced growth arrest of MCF7 cells. J Biol Chem. 2004;279:25101–25111. doi: 10.1074/jbc.M313662200. [DOI] [PubMed] [Google Scholar]
- 25.Yabu T, Imamura S, Yamashita M, Okazaki T. Identification of Mg2+-dependent neutral sphingomyelinase 1 as a mediator of heat stress-induced ceramide generation and apoptosis. J Biol Chem. 2008;283:29971–29982. doi: 10.1074/jbc.M805402200. [DOI] [PMC free article] [PubMed] [Google Scholar]
- 26.Yabu T, Shimuzu A, Yamashita M. A novel mitochondrial sphingomyelinase in zebrafish cells. J Biol Chem. 2009;284:20349–20363. doi: 10.1074/jbc.M109.004580. [DOI] [PMC free article] [PubMed] [Google Scholar]
Associated Data
This section collects any data citations, data availability statements, or supplementary materials included in this article.