

Abstract
Gamma-aminobutyric acid (GABA) is the primary inhibitory neurotransmitter in the brain. Although measurements of GABA levels in vivo in the human brain using edited proton magnetic resonance spectroscopy (1H-MRS) have been established for some time, it is has not been established how regional GABA levels vary with age in the normal human brain. In this study, 49 healthy men and 51 healthy women aged between 20 and 76 years were recruited and J-difference edited spectra were recorded at 3 Tesla to determine the effect of age on GABA levels, and to investigate whether there are regional and gender differences in GABA in mesial frontal and parietal regions.
Because the signal detected at 3.02 ppm using these experimental parameters is also expected to contain contributions from both macromolecules (MM) and homocarnosine, in this study the signal is labeled GABA+ rather than GABA. Significant negative correlations were observed between age and GABA+ in both regions studied (GABA+/Cr: frontal region, r = -0.68, p< 0.001, parietal region, r = -0.54, p< 0.001; GABA+/NAA: frontal region, r = -0.58, p< 0.001, parietal region, r = -0.49, p< 0.001). The decrease in GABA+ with age in the frontal region was more rapid in women than men. Evidence of a measureable decline in GABA is important in considering the neurochemical basis of the cognitive decline that is associated with normal aging.
Keywords: Proton MRS, GABA, Normal brain, Aging
Introduction
The adult brain changes throughout adult life, with frontal development extending well beyond childhood (Giedd et al., 2010; Jernigan et al., 1991; Lovden et al., 2010), and growing evidence of a gradual decline in some aspects of function with age (Betts et al., 2007; Wilson et al., 2011; Zhang et al., 2011).
Gamma-aminobutyric acid (GABA) is the main inhibitory neurotransmitter in the human brain (McCormick, 1989), and GABAergic inhibition plays a key role in shaping and controlling cortical glutamatergic excitation (Brunel and Wang, 2003; Buzsaki et al., 2007; Kohn and Whitsel, 2002). Several recent studies (Hua et al., 2008; Leventhal et al., 2003; Stanley et al., 2012) have suggested a decline in GABAergic function with age and that is associated with a loss of function (Betts et al., 2007; Lenz et al., 2012; Leventhal et al., 2003; Wilson et al., 2011; Zhang et al., 2011). While GABA levels can be measured non-invasively in the human brain using magnetic resonance spectroscopy (MRS) (Puts and Edden, 2012), to date there has been a paucity of studies exploring the normal age-related variations in regional GABA levels
The purpose of this study, therefore, was to characterize the age-dependence of MRS measures of GABA, a metric that has recently been closely associated with cognitive function (Northoff et al., 2007; Boy et al., 2011a; Boy et al., 2011b; Edden et al., 2009; Muthukumaraswamy et al., 2009; Muthukumaraswamy et al., 2012; Puts et al., 2011; Sumner et al., 2010). Measurement of intra-cerebral GABA using MRS is hindered because resonances of GABA overlap with other metabolites such as glutamate (Glu), N-acetylaspartate (NAA), total creatine (Cr) and macromolecules (MM), and the concentration of GABA is relatively low (0.5–1.9 mmol/dm3) (Govindaraju et al., 2000). Measurements of GABA largely free from overlap with more abundant molecules have been established using spectral-editing techniques (Mescher et al., 1998; Rothman et al., 1993), and this has been applied successfully to measure GABA in a number of neurologic, psychiatric and developmental disorders (Edden et al., 2012; Goddard et al., 2004; Kaufman et al., 2009; Petroff et al., 2001; Pollack et al., 2008; Sanacora et al., 1999; Tayoshi et al., 2010) and in healthy control subjects (Boy et al., 2011a; Edden et al., 2009; Evans et al., 2010; Puts and Edden, 2012; Puts et al., 2011; Stagg et al., 2009; Sumner et al., 2010).
In this study, J-difference edited MRS was used to investigate effects of age on GABA levels in frontal and parietal regions, and to investigate whether these effects are gender-specific.
Material and methods
Subjects
One hundred healthy volunteers (49 men and 51 women) were recruited from the local community. The study was approved by the local institutional review board and each participant provided informed consent. The study participants were between 20 and 76 years old (men: range 24-76, mean= 46.1±14.5 years; women: range 20-70, mean= 45.0±14.7 years) and were recruited to represent an even distribution of ages: 20 participants (9 male, 11 female) aged 20 - 30 years; 20 participants (10 male, 10 female) aged 31- 40 years; 20 participants (10 male, 10 female) aged 41 - 50 years; 20 participants (11 male, 9 female) aged 51 - 60 years; and 20 participants (9 male, 11 female) aged 61 - 76 years. All subjects were in good health, and had no history of neurological or psychiatric disease, or use of psychotropic medication. Smoking, drinking alcohol and taking caffeine were prohibited for 12 hours prior to MR measurement.
MRI and voxel localization
All subjects were scanned on a 3T scanner (Philips ‘Achieva’ TX, Best, The Netherlands) using an eight-channel phased-array head coil for receive. T1-weighted three-dimensional TFE images were used as a localizer, acquired with the following parameters: TR = 8.2 ms; TE = 3.7 ms; slice thickness = 1 mm; matrix 256 × 256; field of view = 24 × 24 cm2; and flip angle = 8°. Images were reconstructed with 1 × 1 × 1 mm3 isotropic voxels. The volume of interest (VOI) with a size of 3 × 3 × 3 cm3 was chosen in the two areas: (a) frontal and (b) parietal regions (see Fig. 1a and b). The median sagittal plane was chosen as a reference slice for voxel localization: the voxel in frontal region was prescribed superior to the genu of the corpus callosum, aligned with the shape of the corpus callosum, and positioned on the medial aspect of the axial plane; the voxel in parietal region was prescribed posterior and superior to the splenium of the corpus callosum, aligned with the shape of the corpus callosum, and positioned again on the medial aspect of the axial plane. All of the VOIs were placed in a manner that enabled avoidance of the lateral ventricle and skull.
Fig.1.
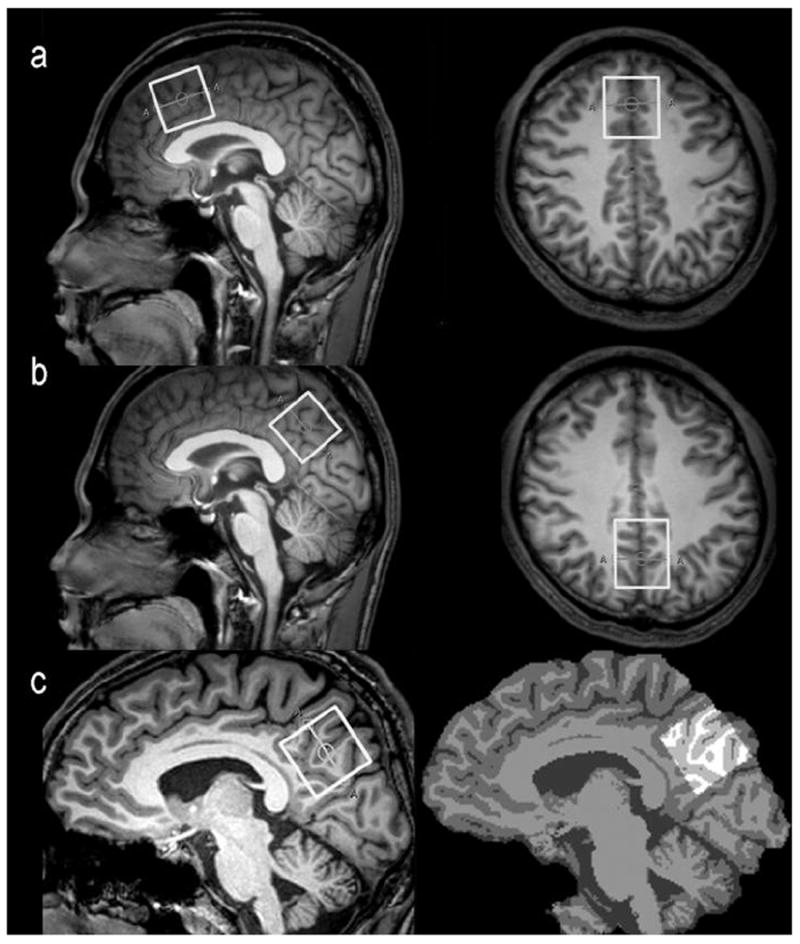
The VOIs position in the frontal region (a) and parietal region (b) for spectroscopic measurement using a MEGA-PRESS sequence. The white box represents the location of the VOI (3 × 3 × 3 cm3) in the sagittal and axial images. (c) The 3D T1-weighted brain images (left) were segmented as gray matter (GM), white matter (WM), or cerebrospinal fluid (CSF) using the FAST (FMRIB’s automated segmentation tool) of the “FSL” software package (right) and the VOIs were re-created using the “Re-creation of VOI” Matlab tool.
1H-MRS spectroscopy, editing, and VOI segmentation
The 3 ppm resonance of GABA was measured using a MEGA-PRESS sequence (Mescher et al., 1998), using the following parameters: TR 2000 ms; TE 68 ms; 320 averages; acquisition bandwidth 1000 Hz; and total acquisition time 11 minutes. During odd-numbered acquisitions, a frequency-selective, Gaussian inversion pulse was applied to the 3CH2 resonance of GABA at 1.9 ppm, affecting the weakly J-coupled triplet peak at 3.02 ppm (EDIT-ON). During even-numbered acquisitions, the same pulse was applied symmetrically to the other side of the water peak, at 7.5 ppm (EDIT-OFF), in order to minimize the residual water signal upon subtraction. The resulting edited spectrum is derived from the difference between the ON and OFF spectra. Chemical Shift Selective Suppression (CHESS) was used for water suppression. FASTMAP shimming of the VOI was performed automatically prior to each acquisition.
Because the signal detected at 3.02 ppm using these experimental parameters is also expected to contain contributions from both macromolecules (MM) and homocarnosine (Rothman et al., 1997), in the rest of this manuscript this signal is labeled GABA+ rather than GABA, to indicate the potential presence of these other compounds. All the metabolite quantitation was performed with time-domain fitting algorithm AMARES, within jMRUI v.4.0 software (Stefan et al., 2009). A 3 Hz exponential line broadening was applied. GABA+ levels were evaluated as both GABA+/Cr and GABA+/NAA in order to demonstrate that observed effects are driven by GABA+. The internal reference of Cr and NAA methyl singlet signals were obtained from the ‘OFF’ MEGA-PRESS spectra. Additionally, the co-edited Glx (glutamate+glutamine) signal at 3.7 ppm was evaluated in the difference spectra. The AMARES fitting algorithm within jMRUI provides the standard deviation of the amplitude (the Cramer-Rao standard deviation [CRSD]), which can be used as a measure of the accuracy of the calculation of the amplitude of a certain component, reflecting the signal-to-noise ratio (Lamb et al., 1996). The CRSD of the GABA+ signal was divided by the GABA+ signal amplitude, yielding a relative CRSD, which is inversely related to the signal-to-noise ratio (van der Meer et al., 2007). Only spectra with a relative CRSD of GABA+ below 10% were included in the final analysis
Each pixel in the 3D T1-weighted brain images was segmented as gray matter (GM), white matter (WM), or cerebrospinal fluid (CSF) using an automatic brain segmentation program, FAST (FMRIB’s automated segmentation tool) in the FSL package (Oxford University, Oxford, UK) (Zhang et al., 2001). VOIs were co-registered to the anatomical images using the “Re-creation of VOI” Matlab tool (Montelius et al., 2008) (Fig. 1c). Tissue GM fractions were obtained by calculating the ratio of GM volume to the GM+WM volumes in the VOIs. The concentrations of GABA, Cr and NAA in CSF were considered to be negligible.
Statistical analysis
The values are presented as mean ± standard deviation (S.D.). To determine regional effects on GABA+ levels, analysis of covariance was used with age as a covariate. No correction of p values for multiple comparisons was made to account for making measurements in two regions. Linear regression was used to examine the association between age and the GABA+/Cr or GABA+/NAA ratios. In each region, analysis of variance was performed in order to assess the interaction effect between age and gender on GABA+/Cr or GABA+/NAA ratios. Effects of gender on GABA+ levels in each region were tested using two-tailed t-tests. Secondary analyses were also performed for the Glx/Cr signal. Analysis of variance was used to compare the relative CRSD of GABA+ among all the age groups, and linear regression was used to examine the association between age and the relative CRSD of GABA+ in each region. All statistical tests were two-sided and P-values of less than 0.05 were accepted as significant. Statistical analyses were carried out using the statistical package SPSS 13.0.
Results
Edited spectra from the frontal and parietal regions were successfully collected in all 100 participants and the CRSD of GABA+ in all spectra was below 10%, indicating that the MEGA-PRESS technique is robust, even though it relies on subtraction of two scans to detect GABA+. The mean (plus/minus standard deviation) GABA-edited spectra for each decade in each region are shown in Fig. 2, indicating comparable spectral quality across the full age range.
Fig.2.
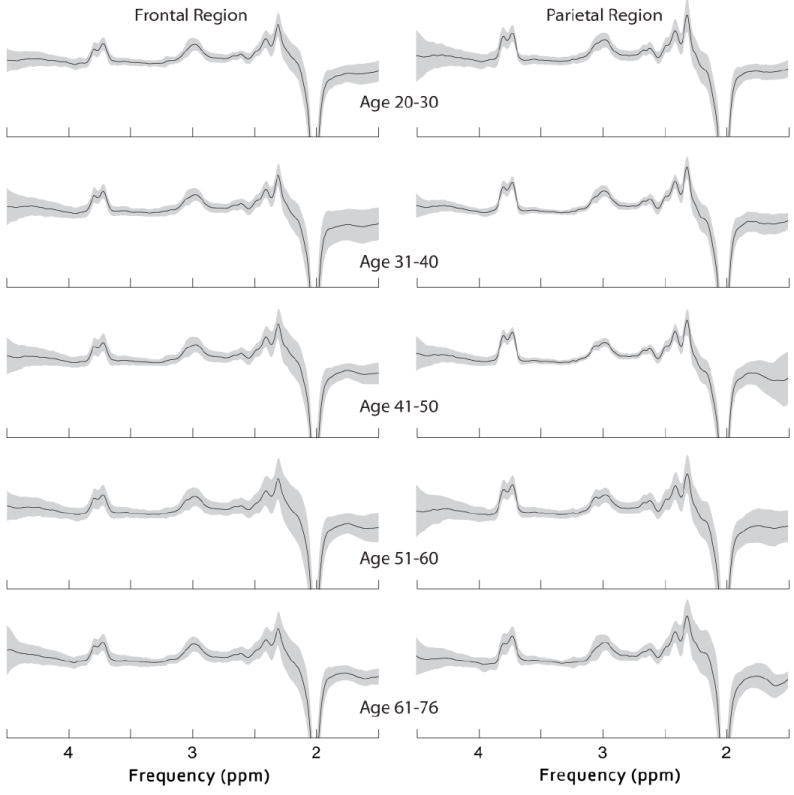
The mean (plus/minus standard deviation) GABA-edited spectra from the MEGA-PRESS sequence for each decade in the frontal region and parietal region.
Effect of age on GABA+
There were significant negative correlations between age and GABA+/Cr or GABA+/NAA in both regions studied (GABA+/Cr: frontal region, r = -0.68, p< 0.001, parietal region, r = -0.54, p< 0.001; GABA+/NAA: frontal region, r = -0.58, p< 0.001, parietal region, r = -0.49, p< 0.001) when data from both men and women are combined, as seen in Fig. 3a and b. Linear regression analysis indicates that there is approximately 5% reduction in GABA+/Cr and 4% reduction in GABA+/NAA occurs per decade of life. There were also significant negative correlations between age and Glx/Cr in both regions studied (Glx/Cr: frontal region, r = -0.47, p< 0.001, parietal region, r = -0.37, p< 0.001) when data from both men and women are combined.
Fig.3.
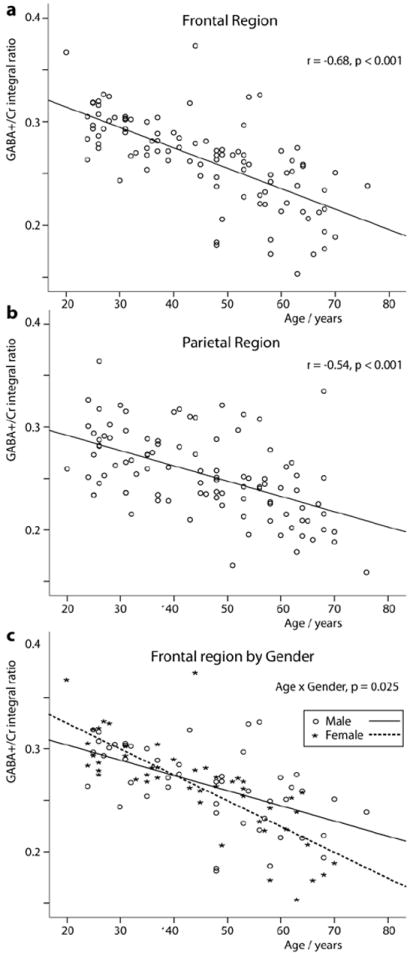
Age-related decreases in GABA+/Cr ratio in the frontal region (a) and parietal region (b) from all the subjects. (c) Age-related decreases in GABA+/Cr ratio in the men and women in the frontal region (men: r = -0.56, p < 0.001; women: r = -0.78, p < 0.001). P value of interaction in gender-by-age is 0.025.
Effect of gender on age-related changes in GABA+
Separating the results by gender, significant age-related decreases in GABA+ were observed in men and women in both regions as described in Table 1. Interestingly, an analysis of variance showed a significant gender difference in the age-related reduction in GABA+ in the frontal region (GABA+/Cr: age × sex, p=0.03; GABA+/NAA: age × sex, p=0.001). As shown in Fig. 3c, there was a greater age-related decline in women than in men. There was no significant gender difference in the age-related reduction in Glx in both regions (frontal region: age × sex, p=0.25; parietal region: age × sex, p=0.29).
Table 1.
Age-related effect of the GABA+/Cr, GABA+/NAA and Glx/Cr ratios in the frontal region and parietal region
| Region of interest | Age Effect Men + Women | Age Effect Men | Age Effect Women | Age × Sex Effect | ||||
|---|---|---|---|---|---|---|---|---|
| r | P | r | P | r | P | P | ||
| Frontal region (GABA+/Cr) | -0.68 | <0.001 | -0.56 | <0.001 | -0.78 | <0.001 | 0.03 | |
| Parietal region (GABA+/Cr) | -0.54 | <0.001 | -0.51 | <0.001 | -0.56 | <0.001 | 0.35 | |
| Frontal region (GABA+/NAA) | -0.58 | <0.001 | -0.35 | =0.01 | -0.75 | <0.001 | 0.001 | |
| Parietal region (GABA+/NAA) | -0.49 | <0.001 | -0.34 | =0.02 | -0.64 | <0.001 | 0.11 | |
| Frontal region (Glx/Cr) | -0.47 | <0.001 | -0.37 | =0.01 | -0.58 | <0.001 | 0.25 | |
| Parietal region (Glx/Cr) | -0.37 | <0.001 | -0.31 | =0.03 | -0.42 | =0.002 | 0.29 | |
GABA = gamma-aminobutyric acid, Cr = total creatine, NAA = N-acetylaspartate, GABA+ = GABA plus co-edited macromolecules, Glx = glutamate+glutamine.
Regional and gender variations of GABA+
The regional GABA+ and Glx/Cr measurements among all subjects are summarized in Table 2. GABA+ is significantly higher in the frontal region than in the parietal region (GABA+/Cr: p = 0.04; GABA+/NAA: p = 0.03). There was no significant difference between frontal region and parietal region for the Glx/Cr ratios, although a trend-level difference was observed (p = 0.05). There was no significant difference between men and women for the GABA+ ratios in either the frontal region (GABA+/Cr: p = 0.80; GABA+/NAA: p = 0.56) or the parietal region (GABA+/Cr: p = 0.48; GABA+/NAA: p = 0.65), or for Glx/Cr ratios in either the frontal region (p = 0.55) or the parietal region (p = 0.73).
Table 2.
GABA+/Cr, GABA+/NAA and Glx/Cr ratios in the frontal region and parietal region among all subjects
| Region of interest | Men + Women (n = 100) | Men (n = 49) | Women (n = 51) | P value |
|---|---|---|---|---|
| Frontal region (GABA+/Cr) | 0.264±0.042 | 0.265±0.038 | 0.263±0.046 | 0.80a |
| Parietal region (GABA+/Cr) | 0.254±0.040 | 0.251±0.035 | 0.257±0.045 | 0.48a |
| P value (GABA+/Cr) | 0.04b | |||
| Frontal region (GABA+/NAA) | 0.228±0.035 | 0.231±0.030 | 0.226±0.039 | 0.56a |
| Parietal region (GABA+/NAA) | 0.219±0.032 | 0.221±0.032 | 0.218±0.032 | 0.65a |
| P value (GABA+/NAA) | 0.03b | |||
| Frontal region (Glx/Cr) | 0.203±0.043 | 0.206±0.044 | 0.201±0.043 | 0.55a |
| Parietal region (Glx/Cr) | 0.215±0.047 | 0.213±0.040 | 0.216±0.053 | 0.73a |
| P value (Glx/Cr) | 0.05b |
Comparison of metabolite ratios between men and women.
Comparison of the metabolite ratios between frontal region and parietal region of all subjects
The values are mean ± standard deviation, GABA = gamma-aminobutyric acid, Cr = total creatine, NAA = N-acetylaspartate, GABA+ = GABA plus co-edited macromolecules, Glx = glutamate+glutamine.
The ratio of gray matter and white matter in each ROI
The mean gray matter tissue fraction GM/(GM+WM) was 57.85% and 57.95% in the frontal region and parietal region, and did not change significantly with age, although a trend-level association was seen (p = 0.14, p = 0.11) (Fig. 4a and b), and did not correlate with GABA+/Cr ratios (p = 0.30, p = 0.32) (Fig. 4c and d) or GABA+/NAA ratios (p = 0.39, p = 0.45) or Glx/Cr ratios (p = 0.26, p = 0.73) There were no significant gender-related and region-related difference in the fraction of GM in the VOIs (p = 0.37 and p = 0.82, respectively).
Fig.4.
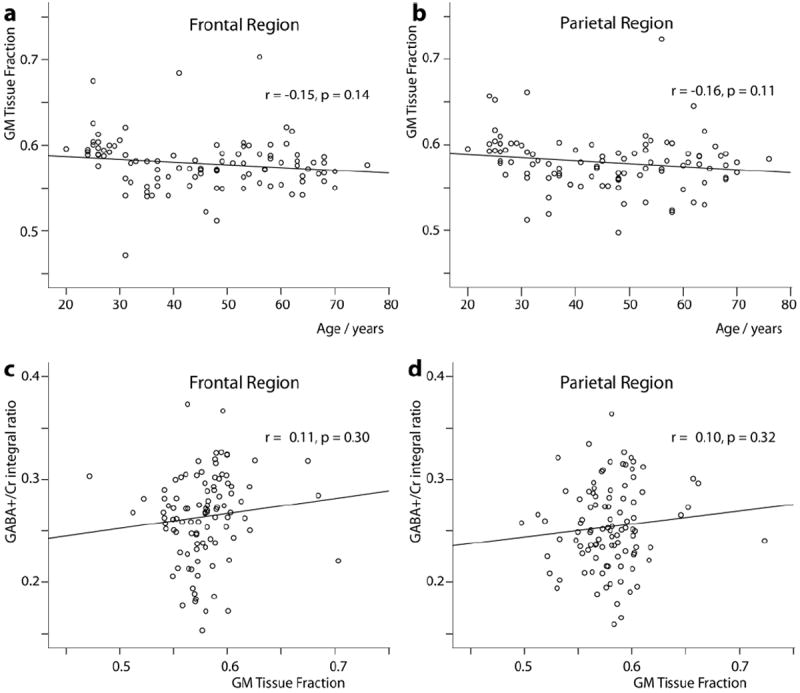
Relationship between GM fraction and age in the frontal region (a) and parietal region (b) from all the subjects. Relationship between GABA+/Cr ratio and GM fraction in the frontal region (c) and parietal region (d) from all the subjects.
Relative CRSD of GABA+ in each region
The mean relative CRSD of GABA+ was 5.33% and 5.12% in the frontal region and parietal region. The relative CRSD of GABA+ for each decade of all subjects in each region are summarized in Table 3. There were no significant difference among all the age groups for the relative CRSD of GABA+ in the frontal region (p = 0.82) and parietal region (p = 0.76); there were no correlation between age and the relative CRSD of GABA+ in the frontal region (p = 0.98) and parietal region (p = 0.15).
Table 3.
Relative CRSD of GABA+ for each decade of all subjects in the frontal region and parietal region
| Age groups (years) | Relative CRSD (%) | |
|---|---|---|
| Frontal region | Parietal region | |
| 21-30 | 5.26 ± 1.04 | 5.02 ± 0.90 |
| 31-40 | 5.37 ± 0.87 | 5.03 ± 1.03 |
| 41-50 | 5.36 ± 0.76 | 5.00 ± 0.85 |
| 51-60 | 5.49 ± 0.84 | 5.30 ± 1.11 |
| 61-76 | 5.17 ± 0.84 | 5.26 ± 0.85 |
| P value | 0.82a | 0.76a |
Comparison of the relative CRSD of GABA+ among all the age groups in each region.
The values are mean ± standard deviation, GABA = gamma-aminobutyric acid, GABA+ = GABA plus co-edited macromolecules, CRSD = Cramer-Rao standard deviation.
Discussion
The most important finding of this study was a decrease of GABA+ levels with increasing age in both the frontal region and parietal regions in normal subjects ranging from 20 to 76 years of age.
GABA is primarily localized to inhibitory interneurons, therefore, the observed reduction in GABA concentration with age could be indicative of GABAergic neuronal loss during normal aging. This is consistent with a number of animal studies that have shown a decline in GABAergic neurons with age (Hua et al., 2008; Stanley et al., 2012). However, there was no correlation of gray matter tissue fraction with age, which may either indicate that there is indeed no decline in overall neuron number, but that the ratio of GABAergic neurons to total neurons decreased with age (Hua et al., 2008), or that such an effect is not detectable at the macroscopic level. Another study (Marenco et al., 2010) has shown a relationship between MRS GABA levels and genes coding for glutamic acid decarboxylase (GAD), a transaminase involved in the production of GABA. It is therefore also possible that the current finding of reduced GABA+ levels with increasing age may reflect a decline in the efficacy of production in GABA (Caspary et al., 1995; Leventhal et al., 2003; Raza et al., 1994).
A number of behavioral studies have suggested that a decline in GABAergic inhibition underlies many of the cognitive declines seen with age (Caspary et al., 1995; Yang et al., 2009; Zhang et al., 2008). Moreover, another study showed that GABA and GABAergic agonists improved visual performance in senescent monkeys (Leventhal et al., 2003). However, few MRS studies have investigated age-related changes in GABA concentrations, and those that have analyzed non-edited short-TE spectra at field strengths of 1.5 or 3.0T (Grachev and Apkarian, 2000), which have limited ability to resolve GABA from Glutamate (Glu) and Glutamine. Several prior MRS studies have found no relationship between GABA levels and age (e.g. in the frontal region (Goto et al., 2010) and occipital cortex (Goddard et al., 2001)); however, these studies were not primarily focused on detecting age-related changes, and had a limited age range which diminished their power to detect such an effect.
In our study, two internal references (Cr and NAA) were used to express relative GABA+ levels. The literature on age-related Cr changes is mixed - some studies have shown no significant change with age (Brooks et al., 2001; Christiansen et al., 1993) and others have shown a slow increase with age (Maudsley et al., 2009; Reyngoudt et al., 2012; Robertson et al., 2001; Saunders et al., 1999). Thus, it is possible that the observed age-related decrease in GABA/Cr ratio could be driven by an age-related increase in creatine. However, this is unlikely as our results also indicate there was a decrease of GABA+/NAA ratio with age, and many studies have shown that the NAA signal either has no significant change with age (Saunders et al., 1999), or decreases with age (Brooks et al., 2001; Christiansen et al., 1993), but does not increase. Therefore the most consistent interpretation of this data is that GABA+ levels is decreasing with age.
Secondary analyses also revealed significant (but weaker) age-related reductions in Glx. The co-edited Glx signal arises in the edited difference spectra from the alpha proton of both glutamate and glutamine. Due the mixed nature of the signal, and the extensive metabolic role of glutamate, it is not clear how to interpret these results.
Despite a gender-specific decline of GABA+ levels with age, no significant effect of gender itself on GABA+ levels in the frontal region and parietal region were found. One study found that female rats had higher GABA levels than male rats in the frontal cortex (Davis et al., 1999). A number of MRS studies have investigated the role of gender in GABA levels in humans: reduced levels of GABA in the occipital region in the luteal menstrual phase were found in one study (Epperson et al., 2002), and in the postpartum period in another (Epperson et al., 2006). It has been previously shown that the menstrual cycle affects GABA-A receptor expression (Lovick, 2006). GABA levels were also reported to be significantly higher in men than women in dorsolateral prefrontal cortex (O’Gorman et al., 2011). Collectively, these studies suggest that GABA levels may be affected both by gender and hormonal effects. One limitation of the current study was that menstrual or contraceptive status of female subjects in this study were not recorded.
Several MRS studies have shown regional variations in GABA concentration (Evans et al., 2010; Goto et al., 2010; Northoff et al., 2007, Zhu and Barker, 2011). In the current study, GABA+ levels were significantly higher in the frontal region than those in the parietal region, but the underlying cellular or biochemical cause of this difference is unclear.
It is also difficult to compare GABA+/Cr ratios betweeen this and previous studies, as different acquisition techniques and parameters, as well as analysis methods, are often used. However, one study (Waddell et al 2011) shared a number of methodological similarities to the current study, and measured ratios of GABA+/Cr in anterior cingulate cortex (ACC) and the cerebellar vermis. For the ACC and cerebellum, the reported GABA+/Cr ratios of 0.313±0.08 and 0.229±0.06 respectively, are in a similar range to the values reported here in the frontal and parietal regions (Table 2).
In this study, no significant difference among all the age groups for the relative CRSD of GABA+ in each region was found and there were no correlation between age and the relative CRSD of GABA+ in the frontal region and parietal region. Thus, it is likely that our spectral quality is relatively consistent for each decade in each region, as suggested by Figure 2.
It has been reported that the frontal region is preferentially affected by aging (Brooks et al., 2001) and the parietal region is a commonly used control region. Moreover, as the technical limitations of this method required the use of relatively large VOIs (3 × 3 × 3 cm3), it is difficult to totally place the VOI in the occipital or temporal region, especially for the older subjects. Thus, the VOI was chosen in the frontal and parietal regions in our study. In terms of the particular location of the VOIs, the genu and splenium of the corpus callosum are excellent anatomical landmarks to assist with voxel placement; the VOIs were prescribed on the medial aspect of the frontal and parietal regions in order to obtain a higher percentage GM fraction and avoid the skull.
The data acquisition strategy for this study has several limitations. First, the relatively low amplitude of the GABA signal of this method required the use of relatively large VOIs (3 × 3 × 3 cm3). An approach enabling the use of smaller VOIs may prove more efficient for region-specific analyses of brain GABA changes. Secondly, the edited GABA signal that was detected contains a significant contribution from co-edited macromolecules, and homocarnosine. Although the decrease in GABA+ could potentially be explained by a decrease in the MM contribution to the GABA+ signal, this is unlikely to be the driving factor as two recent studies have shown that the 3 ppm MM signal increases with age (Hofmann et al., 2001; Mader et al., 2002). Further studies that remove the MM contribution are required in order to investigate the role of co-edited MM signal in the observed gender differences. In vivo concentration of homocarnosine is much lower than GABA concentration (Govindaraju et al., 2000), so it is unlikely that isolated changes in homocarnosine are the main factor driving the observed changes. Thirdly, the study acquisition protocol did not include acquisitions of non-suppressed water scans, meaning that we were only able to present metabolite ratios rather than concentrations relative to water as an internal standard.
In conclusion, brain both GABA+/Cr and GABA+/NAA ratios decrease with age in the frontal region and parietal region, with more rapid frontal decline in women. Both GABA+/Cr and GABA+/NAA ratios are significantly higher in the frontal region than the parietal region. Given the increasing use of MRS of GABA to study both normal brain function and pathologies, normative studies of age-related and regional differences in GABA are an important undertaking.
Highlights.
Levels of the inhibitory neurotransmitter GABA are shown to reduce with age throughout adulthood
This decline is more rapid in the frontal region of female than male subjects
Edited magnetic resonance spectroscopy of GABA was applied in an exceptionally large cohort of 100 subjects
Acknowledgments
Project supported by the National Natural Science Foundation of China (Grant No. 81171380/H1807) and NIH grant (P41 EB015909). The authors are grateful to the technical assistance provided by Weibo Chen and Queenie Chan.
Footnotes
Publisher's Disclaimer: This is a PDF file of an unedited manuscript that has been accepted for publication. As a service to our customers we are providing this early version of the manuscript. The manuscript will undergo copyediting, typesetting, and review of the resulting proof before it is published in its final citable form. Please note that during the production process errors may be discovered which could affect the content, and all legal disclaimers that apply to the journal pertain.
References
- Betts LR, Sekuler AB, Bennett PJ. The effects of aging on orientation discrimination. Vision Res. 2007;47:1769–1780. doi: 10.1016/j.visres.2007.02.016. [DOI] [PubMed] [Google Scholar]
- Boy F, Evans CJ, Edden RA, Lawrence AD, Singh KD, Husain M, Sumner P. Dorsolateral prefrontal gamma-aminobutyric acid in men predicts individual differences in rash impulsivity. Biol Psychiatry. 2011a;70:866–872. doi: 10.1016/j.biopsych.2011.05.030. [DOI] [PMC free article] [PubMed] [Google Scholar]
- Boy F, Evans CJ, Edden RA, Singh KD, Husain M, Sumner P. Individual differences in subconscious motor control predicted by GABA concentration in SMA. Curr Biol. 2011b;20:1779–1785. doi: 10.1016/j.cub.2010.09.003. [DOI] [PMC free article] [PubMed] [Google Scholar]
- Brooks JC, Roberts N, Kemp GJ, Gosney MA, Lye M, Whitehouse GH. A proton magnetic resonance spectroscopy study of age-related changes in frontal lobe metabolite concentrations. Cereb Cortex. 2001;11:598–605. doi: 10.1093/cercor/11.7.598. [DOI] [PubMed] [Google Scholar]
- Brunel N, Wang XJ. What determines the frequency of fast network oscillations with irregular neural discharges? I. Synaptic dynamics and excitation-inhibition balance. J Neurophysiol. 2003;90:415–430. doi: 10.1152/jn.01095.2002. [DOI] [PubMed] [Google Scholar]
- Buzsaki G, Kaila K, Raichle M. Inhibition and brain work. Neuron. 2007;56:771–783. doi: 10.1016/j.neuron.2007.11.008. [DOI] [PMC free article] [PubMed] [Google Scholar]
- Caspary DM, Milbrandt JC, Helfert RH. Central auditory aging: GABA changes in the inferior colliculus. Exp Gerontol. 1995;30:349–360. doi: 10.1016/0531-5565(94)00052-5. [DOI] [PubMed] [Google Scholar]
- Christiansen P, Toft P, Larsson HB, Stubgaard M, Henriksen O. The concentration of N-acetyl aspartate, creatine + phosphocreatine, and choline in different parts of the brain in adulthood and senium. Magn Reson Imaging. 1993;11:799–806. doi: 10.1016/0730-725x(93)90197-l. [DOI] [PubMed] [Google Scholar]
- Davis AM, Ward SC, Selmanoff M, Herbison AE, McCarthy MM. Developmental sex differences in amino acid neurotransmitter levels in hypothalamic and limbic areas of rat brain. Neuroscience. 1999;90:1471–1482. doi: 10.1016/s0306-4522(98)00511-9. [DOI] [PubMed] [Google Scholar]
- Edden RA, Crocetti D, Zhu H, Gilbert D, Mostofsky S. Reduced GABA Concentration in Attention-deficit Hyperactivity Disorder. Arch Gen Psychiatry. 2012 doi: 10.1001/archgenpsychiatry.2011.2280. [DOI] [PMC free article] [PubMed] [Google Scholar]
- Edden RA, Muthukumaraswamy SD, Freeman TC, Singh KD. Orientation discrimination performance is predicted by GABA concentration and gamma oscillation frequency in human primary visual cortex. J Neurosci. 2009;29:15721–15726. doi: 10.1523/JNEUROSCI.4426-09.2009. [DOI] [PMC free article] [PubMed] [Google Scholar]
- Epperson CN, Gueorguieva R, Czarkowski KA, Stiklus S, Sellers E, Krystal JH, Rothman DL, Mason GF. Preliminary evidence of reduced occipital GABA concentrations in puerperal women: a 1H-MRS study. Psychopharmacology (Berl) 2006;186:425–433. doi: 10.1007/s00213-006-0313-7. [DOI] [PubMed] [Google Scholar]
- Epperson CN, Haga K, Mason GF, Sellers E, Gueorguieva R, Zhang W, Weiss E, Rothman DL, Krystal JH. Cortical gamma-aminobutyric acid levels across the menstrual cycle in healthy women and those with premenstrual dysphoric disorder: a proton magnetic resonance spectroscopy study. Arch Gen Psychiatry. 2002;59:851–858. doi: 10.1001/archpsyc.59.9.851. [DOI] [PubMed] [Google Scholar]
- Evans CJ, McGonigle DJ, Edden RA. Diurnal stability of gamma-aminobutyric acid concentration in visual and sensorimotor cortex. J Magn Reson Imaging. 2010;31:204–209. doi: 10.1002/jmri.21996. [DOI] [PubMed] [Google Scholar]
- Giedd JN, Stockman M, Weddle C, Liverpool M, Alexander-Bloch A, Wallace GL, Lee NR, Lalonde F, Lenroot RK. Anatomic magnetic resonance imaging of the developing child and adolescent brain and effects of genetic variation. Neuropsychol Rev. 2010;20:349–361. doi: 10.1007/s11065-010-9151-9. [DOI] [PMC free article] [PubMed] [Google Scholar]
- Goddard AW, Mason GF, Almai A, Rothman DL, Behar KL, Petroff OA, Charney DS, Krystal JH. Reductions in occipital cortex GABA levels in panic disorder detected with 1h-magnetic resonance spectroscopy. Arch Gen Psychiatry. 2001;58:556–561. doi: 10.1001/archpsyc.58.6.556. [DOI] [PubMed] [Google Scholar]
- Goddard AW, Mason GF, Appel M, Rothman DL, Gueorguieva R, Behar KL, Krystal JH. Impaired GABA neuronal response to acute benzodiazepine administration in panic disorder. Am J Psychiatry. 2004;161:2186–2193. doi: 10.1176/appi.ajp.161.12.2186. [DOI] [PubMed] [Google Scholar]
- Goto N, Yoshimura R, Moriya J, Kakeda S, Hayashi K, Ueda N, Ikenouchi-Sugita A, Umene-Nakano W, Oonari N, Korogi Y, Nakamura J. Critical examination of a correlation between brain gamma-aminobutyric acid (GABA) concentrations and a personality trait of extroversion in healthy volunteers as measured by a 3 Tesla proton magnetic resonance spectroscopy study. Psychiatry Res. 2010;182:53–57. doi: 10.1016/j.pscychresns.2009.11.002. [DOI] [PubMed] [Google Scholar]
- Govindaraju V, Young K, Maudsley AA. Proton NMR chemical shifts and coupling constants for brain metabolites. NMR Biomed. 2000;13:129–153. doi: 10.1002/1099-1492(200005)13:3<129::aid-nbm619>3.0.co;2-v. [DOI] [PubMed] [Google Scholar]
- Grachev ID, Apkarian AV. Chemical heterogeneity of the living human brain: a proton MR spectroscopy study on the effects of sex, age, and brain region. Neuroimage. 2000;11:554–563. doi: 10.1006/nimg.2000.0557. [DOI] [PubMed] [Google Scholar]
- Hofmann L, Slotboom J, Boesch C, Kreis R. Characterization of the macromolecule baseline in localized (1)H-MR spectra of human brain. Magn Reson Med. 2001;46:855–863. doi: 10.1002/mrm.1269. [DOI] [PubMed] [Google Scholar]
- Hua T, Kao C, Sun Q, Li X, Zhou Y. Decreased proportion of GABA neurons accompanies age-related degradation of neuronal function in cat striate cortex. Brain Res Bull. 2008;75:119–125. doi: 10.1016/j.brainresbull.2007.08.001. [DOI] [PubMed] [Google Scholar]
- Jernigan TL, Trauner DA, Hesselink JR, Tallal PA. Maturation of human cerebrum observed in vivo during adolescence. Brain. 1991;114(Pt 5):2037–2049. doi: 10.1093/brain/114.5.2037. [DOI] [PubMed] [Google Scholar]
- Kaufman RE, Ostacher MJ, Marks EH, Simon NM, Sachs GS, Jensen JE, Renshaw PF, Pollack MH. Brain GABA levels in patients with bipolar disorder. Prog Neuropsychopharmacol Biol Psychiatry. 2009;33:427–434. doi: 10.1016/j.pnpbp.2008.12.025. [DOI] [PubMed] [Google Scholar]
- Kohn A, Whitsel BL. Sensory cortical dynamics. Behav Brain Res. 2002;135:119–126. doi: 10.1016/s0166-4328(02)00139-0. [DOI] [PubMed] [Google Scholar]
- Lamb HJ, Doornbos J, den Hollander JA, Luyten PR, Beyerbacht HP, van der Wall EE, de Roos A. Reproducibility of human cardiac 31P-NMR spectroscopy. NMR Biomed. 1996;9:217–227. doi: 10.1002/(SICI)1099-1492(199608)9:5<217::AID-NBM419>3.0.CO;2-G. [DOI] [PubMed] [Google Scholar]
- Lenz M, Tegenthoff M, Kohlhaas K, Stude P, Hoffken O, Gatica Tossi MA, Kalisch T, Kowalewski R, Dinse HR. Increased excitability of somatosensory cortex in aged humans is associated with impaired tactile acuity. J Neurosci. 2012;32:1811–1816. doi: 10.1523/JNEUROSCI.2722-11.2012. [DOI] [PMC free article] [PubMed] [Google Scholar]
- Leventhal AG, Wang Y, Pu M, Zhou Y, Ma Y. GABA and its agonists improved visual cortical function in senescent monkeys. Science. 2003;300:812–815. doi: 10.1126/science.1082874. [DOI] [PubMed] [Google Scholar]
- Lovden M, Bodammer NC, Kuhn S, Kaufmann J, Schutze H, Tempelmann C, Heinze HJ, Duzel E, Schmiedek F, Lindenberger U. Experience-dependent plasticity of white-matter microstructure extends into old age. Neuropsychologia. 2010;48:3878–3883. doi: 10.1016/j.neuropsychologia.2010.08.026. [DOI] [PubMed] [Google Scholar]
- Lovick TA. Plasticity of GABAA receptor subunit expression during the oestrous cycle of the rat: implications for premenstrual syndrome in women. Exp Physiol. 2006;91:655–660. doi: 10.1113/expphysiol.2005.032342. [DOI] [PubMed] [Google Scholar]
- Mader I, Seeger U, Karitzky J, Erb M, Schick F, Klose U. Proton magnetic resonance spectroscopy with metabolite nulling reveals regional differences of macromolecules in normal human brain. J Magn Reson Imaging. 2002;16:538–546. doi: 10.1002/jmri.10190. [DOI] [PubMed] [Google Scholar]
- Marenco S, Savostyanova AA, van der Veen JW, Geramita M, Stern A, Barnett AS, Kolachana B, Radulescu E, Zhang F, Callicott JH, Straub RE, Shen J, Weinberger DR. Genetic modulation of GABA levels in the anterior cingulate cortex by GAD1 and COMT. Neuropsychopharmacology. 2010;35:1708–1717. doi: 10.1038/npp.2010.35. [DOI] [PMC free article] [PubMed] [Google Scholar]
- Maudsley AA, Domenig C, Govind V, Darkazanli A, Studholme C, Arheart K, Bloomer C. Mapping of brain metabolite distributions by volumetric proton MR spectroscopic imaging (MRSI) Magn Reson Med. 2009;61:548–559. doi: 10.1002/mrm.21875. [DOI] [PMC free article] [PubMed] [Google Scholar]
- McCormick D. GABA as an inhibitory neurotransmitter in human cerebral cortex. J Neurophysiol. 1989;62:1018–1027. doi: 10.1152/jn.1989.62.5.1018. [DOI] [PubMed] [Google Scholar]
- Mescher M, Merkle H, Kirsch J, Garwood M, Gruetter R. Simultaneous in vivo spectral editing and water suppression. NMR Biomed. 1998;11:266–272. doi: 10.1002/(sici)1099-1492(199810)11:6<266::aid-nbm530>3.0.co;2-j. [DOI] [PubMed] [Google Scholar]
- Montelius M, et al. MATLAB tool for segmentation and re-creation of 1H-MRS volumes of interest in MRI image stacks. ESMRMB; October 1–3; Antalya/TR. 2008. [Google Scholar]
- Muthukumaraswamy SD, Edden RA, Jones DK, Swettenham JB, Singh KD. Resting GABA concentration predicts peak gamma frequency and fMRI amplitude in response to visual stimulation in humans. Proc Natl Acad Sci U S A. 2009;106:8356–8361. doi: 10.1073/pnas.0900728106. [DOI] [PMC free article] [PubMed] [Google Scholar]
- Muthukumaraswamy SD, Evans CJ, Edden RA, Wise RG, Singh KD. Individual variability in the shape and amplitude of the BOLD-HRF correlates with endogenous GABAergic inhibition. Hum Brain Mapp. 2012;33:455–465. doi: 10.1002/hbm.21223. [DOI] [PMC free article] [PubMed] [Google Scholar]
- Northoff G, Walter M, Schulte RF, Beck J, Dydak U, Henning A, Boeker H, Grimm S, Boesiger P. GABA concentrations in the human anterior cingulate cortex predict negative BOLD responses in fMRI. Nat Neurosci. 2007;10:1515–1517. doi: 10.1038/nn2001. [DOI] [PubMed] [Google Scholar]
- O’Gorman RL, Michels L, Edden RA, Murdoch JB, Martin E. In vivo detection of GABA and glutamate with MEGA-PRESS: reproducibility and gender effects. J Magn Reson Imaging. 2011;33:1262–1267. doi: 10.1002/jmri.22520. [DOI] [PMC free article] [PubMed] [Google Scholar]
- Petroff OA, Hyder F, Rothman DL, Mattson RH. Homocarnosine and seizure control in juvenile myoclonic epilepsy and complex partial seizures. Neurology. 2001;56:709–715. doi: 10.1212/wnl.56.6.709. [DOI] [PubMed] [Google Scholar]
- Pollack MH, Jensen JE, Simon NM, Kaufman RE, Renshaw PF. High-field MRS study of GABA, glutamate and glutamine in social anxiety disorder: response to treatment with levetiracetam. Prog Neuropsychopharmacol Biol Psychiatry. 2008;32:739–743. doi: 10.1016/j.pnpbp.2007.11.023. [DOI] [PubMed] [Google Scholar]
- Puts NA, Edden RA. In vivo magnetic resonance spectroscopy of GABA: A methodological review. Prog NMR Spectroscopy. 2012;60:29–41. doi: 10.1016/j.pnmrs.2011.06.001. [DOI] [PMC free article] [PubMed] [Google Scholar]
- Puts NA, Edden RA, Evans CJ, McGlone F, McGonigle DJ. Regionally specific human GABA concentration correlates with tactile discrimination thresholds. J Neurosci. 2011;31:16556–16560. doi: 10.1523/JNEUROSCI.4489-11.2011. [DOI] [PMC free article] [PubMed] [Google Scholar]
- Raza A, Milbrandt JC, Arneric SP, Caspary DM. Age-related changes in brainstem auditory neurotransmitters: measures of GABA and acetylcholine function. Hear Res. 1994;77:221–230. doi: 10.1016/0378-5955(94)90270-4. [DOI] [PubMed] [Google Scholar]
- Reyngoudt H, Claeys T, Vlerick L, Verleden S, Acou M, Deblaere K, De Deene Y, Audenaert K, Goethals I, Achten E. Age-related differences in metabolites in the posterior cingulate cortex and hippocampus of normal ageing brain: a 1H-MRS study. Eur J Radiol. 2012;81:e223–231. doi: 10.1016/j.ejrad.2011.01.106. [DOI] [PubMed] [Google Scholar]
- Robertson DM, van Amelsvoort T, Daly E, Simmons A, Whitehead M, Morris RG, Murphy KC, Murphy DG. Effects of estrogen replacement therapy on human brain aging: an in vivo 1H MRS study. Neurology. 2001;57:2114–2117. doi: 10.1212/wnl.57.11.2114. [DOI] [PubMed] [Google Scholar]
- Rothman DL, Petroff OA, Behar KL, Mattson RH. Localized 1H NMR measurements of gamma-aminobutyric acid in human brain in vivo. Proc Natl Acad Sci U S A. 1993;90:5662–5666. doi: 10.1073/pnas.90.12.5662. [DOI] [PMC free article] [PubMed] [Google Scholar]
- Rothman DL, Behar KL, Prichard JW, Petroff OA. Homocarnosine and the measurement of neuronal pH in patients with epilepsy. Magn Reson Med. 1997;38:924–929. doi: 10.1002/mrm.1910380611. [DOI] [PubMed] [Google Scholar]
- Sanacora G, Mason GF, Rothman DL, Behar KL, Hyder F, Petroff OA, Berman RM, Charney DS, Krystal JH. Reduced cortical gamma-aminobutyric acid levels in depressed patients determined by proton magnetic resonance spectroscopy. Arch Gen Psychiatry. 1999;56:1043–1047. doi: 10.1001/archpsyc.56.11.1043. [DOI] [PubMed] [Google Scholar]
- Saunders DE, Howe FA, van den Boogaart A, Griffiths JR, Brown MM. Aging of the adult human brain: in vivo quantitation of metabolite content with proton magnetic resonance spectroscopy. J Magn Reson Imaging. 1999;9:711–716. doi: 10.1002/(sici)1522-2586(199905)9:5<711::aid-jmri14>3.0.co;2-3. [DOI] [PubMed] [Google Scholar]
- Stagg CJ, Best JG, Stephenson MC, O’Shea J, Wylezinska M, Kincses ZT, Morris PG, Matthews PM, Johansen-Berg H. Polarity-sensitive modulation of cortical neurotransmitters by transcranial stimulation. J Neurosci. 2009;29:5202–5206. doi: 10.1523/JNEUROSCI.4432-08.2009. [DOI] [PMC free article] [PubMed] [Google Scholar]
- Stanley EM, Fadel JR, Mott DD. Interneuron loss reduces dendritic inhibition and GABA release in hippocampus of aged rats. Neurobiol Aging. 2012;33:431, e431–413. doi: 10.1016/j.neurobiolaging.2010.12.014. [DOI] [PMC free article] [PubMed] [Google Scholar]
- Stefan D, Di Cesare F, Andrasescu A, Popa E, Lazariev A, Vescovo E, Strbak O, Williams S, Starcuk Z, Cabanas M, van Ormondt D, Graveron-Demilly D. Quantitation of magnetic resonance spectroscopy signals: the jMRUI software package. Measurement Science and Technology. 2009;20:104035. [Google Scholar]
- Sumner P, Edden RA, Bompas A, Evans CJ, Singh KD. More GABA, less distraction: a neurochemical predictor of motor decision speed. Nat Neurosci. 2010;13:825–827. doi: 10.1038/nn.2559. [DOI] [PubMed] [Google Scholar]
- Tayoshi S, Nakataki M, Sumitani S, Taniguchi K, Shibuya-Tayoshi S, Numata S, Iga J, Ueno S, Harada M, Ohmori T. GABA concentration in schizophrenia patients and the effects of antipsychotic medication: a proton magnetic resonance spectroscopy study. Schizophr Res. 2010;117:83–91. doi: 10.1016/j.schres.2009.11.011. [DOI] [PubMed] [Google Scholar]
- van der Meer RW, Doornbos J, Kozerke S, Schar M, Bax JJ, Hammer S, Smit JW, Romijn JA, Diamant M, Rijzewijk LJ, de Roos A, Lamb HJ. Metabolic imaging of myocardial triglyceride content: reproducibility of 1H MR spectroscopy with respiratory navigator gating in volunteers. Radiology. 2007;245:251–257. doi: 10.1148/radiol.2451061904. [DOI] [PubMed] [Google Scholar]
- Waddell KW, Zanjanipour P, Pradhan S, Xu L, Welch EB, Joers JM, Martin PR, Avison MJ, Gore JC. Anterior cingulate and cerebellar GABA and Glu correlations measured by 1H J-difference spectroscopy. Magnetic Resonance Imaging. 2011;29:19–24. doi: 10.1016/j.mri.2010.07.005. [DOI] [PMC free article] [PubMed] [Google Scholar]
- Wilson HR, Mei M, Habak C, Wilkinson F. Visual bandwidths for face orientation increase during healthy aging. Vision Res. 2011;51:160–164. doi: 10.1016/j.visres.2010.10.026. [DOI] [PubMed] [Google Scholar]
- Yang Y, Zhang J, Liang Z, Li G, Wang Y, Ma Y, Zhou Y, Leventhal AG. Aging affects the neural representation of speed in Macaque area MT. Cereb Cortex. 2009;19:1957–1967. doi: 10.1093/cercor/bhn221. [DOI] [PMC free article] [PubMed] [Google Scholar]
- Zhang J, Wang X, Wang Y, Fu Y, Liang Z, Ma Y, Leventhal AG. Spatial and temporal sensitivity degradation of primary visual cortical cells in senescent rhesus monkeys. Eur J Neurosci. 2008;28:201–207. doi: 10.1111/j.1460-9568.2008.06300.x. [DOI] [PubMed] [Google Scholar]
- Zhang Y, Brady M, Smith S. Segmentation of brain MR images through a hidden Markov random field model and the expectation-maximization algorithm. IEEE Trans Med Imaging. 2001;20:45–57. doi: 10.1109/42.906424. [DOI] [PubMed] [Google Scholar]
- Zhu H, Barker PB. MR spectroscopy and spectroscopic imaging of the brain. Methods Mol Biol. 2011;711:203–226. doi: 10.1007/978-1-61737-992-5_9. [DOI] [PMC free article] [PubMed] [Google Scholar]
- Zhang Z, Francisco EM, Holden JK, Dennis RG, Tommerdahl M. Somatosensory information processing in the aging population. Front Aging Neurosci. 2011;3:18. doi: 10.3389/fnagi.2011.00018. [DOI] [PMC free article] [PubMed] [Google Scholar]