

Abstract
Percutaneous needle core biopsy is the definitive procedure by which essential diagnostic and prognostic information on acute and chronic renal allograft dysfunction is obtained. The diagnostic value of the information so obtained has endured for over three decades and has proven crucially important in shaping strategies for therapeutic intervention. This Review provides a broad outline of the utility of performing kidney graft biopsies after transplantation, highlighting the relevance of biopsy findings in the immediate and early post-transplant period (from days to weeks after implantation), the first post-transplant year, and the late period (beyond the first year). We focus on how biopsy findings change over time, and the wide variety of pathological features that characterize the major clinical diagnoses facing the clinician. This article also includes a discussion of acute cellular and humoral rejection, the toxic effects of calcineurin inhibitors, and the widely varying etiologies and characteristics of chronic lesions. Emerging technologies based on gene expression analyses and proteomics, the in situ detection of functionally relevant molecules, and new bioinformatic approaches that hold the promise of improving diagnostic precision and developing new, refined molecular pathways for therapeutic intervention are also presented.
Introduction
Renal biopsy remains the gold standard by which essential diagnostic and prognostic information is obtained after kidney transplantation.1,2 Biopsy methodologies have been devised to assess the acceptability of an organ before transplantation and to assess and predict renal allograft performance after implantation. Renal transplant biopsy samples are analyzed by the same traditional and modern techniques as are used to assess samples from native kidneys (Box 1).
In this Review, we describe the practical role of renal biopsy in the management of renal allograft recipients and highlight the changes that occur in renal pathology with time after transplantation. In addition, we describe how the analysis of renal allograft biopsy is being enhanced by innovative techniques that could revolutionize the management of patients who have undergone renal transplantation.
Diagnostic value
Studies over the past 30 years have repeatedly documented the value of information obtained by renal transplant biopsy in clarifying the diagnosis of graft dysfunction and as a guide to the patient's management. Indeed, biopsy results changed the clinical diagnosis and treatment plan (made on the basis of clinical and laboratory findings) in approximately 40% of patients and led to a reduction in immunosuppression in approximately 20% of patients.3 This benefit was independent of the time since transplantation and extended to biopsies obtained after the first post-transplant year;3 these findings are similar to those previously reported.2
Pretransplant biopsy
Pretransplant kidney biopsy is used to judge the quality of a deceased donor organ at excision and, on occasion, to rule out the possibility of disease in live donors.4 In addition, the donor organ biopsy sample provides a valuable baseline against which the results of subsequent biopsies of the renal allograft can be compared. Before a graft is accepted for transplantation, many variables are considered in addition to the biopsy findings, including the donor and recipient's age and body size, the closeness of the donor–recipient match, and the likelihood of finding another suitable donor. Validating the criteria for donor acceptance has been challenging, and consequentially, approximately 30% of deceased donor kidneys are discarded by US transplant centers.5 Many clinicians regard this discard rate as unacceptably high, and a number of investigators are, therefore, attempting to refine donor biopsy sample analysis to develop predictive indicators of graft performance.6,7
One such indicator is the Maryland aggregate pathology index (MAPI),7 which is based on comprehensive pathologic scoring of both frozen and permanent tissue sections, followed by sophisticated bio informatics analysis of the most informative morphological para meters (Table 1).7 Five features (glomerulosclerosis, periglomerular fibrosis, tubular atrophy and/or interstitial fibrosis, arteriolar hyalinosis and arterial wall thickening) seem to have the greatest relevance to the risk of graft loss and these features have been assigned thresholds and relative values. The sum of these five values is the MAPI score (Table 1). Among patients in the validation group who were used to show the efficacy of this approach, 5-year survival was strikingly correlated with MAPI scores: 90% had a score of 0–7, 63% had a score of 8–11 and 53% had a score of 12–15.7 Reproducibility and application of MAPI scores to clinical decision making remain to be defined; nonetheless, this study is a model of how biopsy samples can be comprehensively analyzed without prejudice to discover the most relevant prognostic features. Owing to the limited sampling associated with kidney biopsy, however, the findings are unlikely to be sufficiently decisive to enable any organs except those with the most florid disease to be discarded. Relying on the donor's renal function parameters is, in most cases, potentially more valid than using pretransplant biopsy findings, except in donors with reversible causes of renal failure (such as hepatorenal syndrome).
Table 1.
MAPI assessment of donor kidney biopsy samples
| Contributors to graft loss | Threshold | Points if present |
|---|---|---|
| Arteriolar hyalinosis | Any | 4 |
| Periglomerular fibrosis | Any | 4 |
| Fibrosis, tubular atrophy and/or scar | Affecting ≥10 tubules | 3 |
| Glomerulosclerosis | 15.0% | 2 |
| Interlobular artery wall to lumen ratio | 0.5 | 2 |
Points for each feature are added together, resulting in a MAPI score of 0–15 points.
Abbreviation: MAPI, Maryland aggregate pathology index.
Permission obtained from John Wiley and Sons © Munivenkatappa, R. B. et al. Am. J. Transplant. 8, 2316–2324 (2008).
Many investigators have addressed the question of whether gene expression profiles in donor biopsy samples might help to assess the quality of the organ. For example, the level of expression of three genes jointly accounted for 28% of the variability in serum creatinine levels at 1 year after transplantation in recipients of deceased donor kidneys, whereas conventional pathology findings accounted for only 14% of this variability.8 Other studies have shown differences in gene expression in kidneys from living versus deceased donors; interestingly these differences were observed in the tubular or interstitial compartment (not the glomeruli) and were manifested in part by increased expression of complement system genes.9–11 Moreover, hepatitis C virus infection status12 and the age of the kidney donor13 also had an effect on gene expression; differences in expression profiles were also observed between laparoscopic and conventional nephrectomy samples.14 Some patterns of gene expression can identify patients who are at high risk of delayed graft function but cannot otherwise be distinguished by clinical or pathological assessment.11 Among the wide variety of mRNA species that show increased expression in these high-risk patients are adhesion molecules, mediators induced by oxidative stress, transforming growth factor β (TGF-β), IL-6, IL-8, interferons, complement components, proteolytic enzymes, immunoglobulins, apoptosis pathway members and cell-cycle components.
Kidney injury molecule-1 (KIM-1) is produced by injured proximal tubular cells. Its expression correlates inversely with renal function at the time of donor kidney procurement and positively with the extent of inter stitial fibrosis; however, no significant correlation is evident between either KIM-1 staining intensity by immunohistochemistry or KIM-1 mRNA levels and subsequent delayed graft function.15 Although screening of potential donor organs using gene expression microarrays is not feasible in real time, selected markers might be assessed by PCR or immunohistochemistry. At present, however, no gene expression profile that should prompt a donor kidney to be declined has been identified, although this approach could conceivably be used to stratify the results of clinical trials. An alternative line of investigation has focused on identifying genetic risk factors in donor organs. One example of the power of this approach was the demonstration that kidneys from African-American donors who carry two copies of a genetic variant in APOL1 (which encodes apolipoprotein L-1) associated with focal segmental glomerulosclerosis (FSGS) had a significantly shorter graft survival.16
Indication biopsy findings
Indication biopsies are those taken to assess the cause of graft dysfunction. The timing of such biopsies strongly influences the differential diagnoses that should be considered (Figure 1).17
Figure 1.
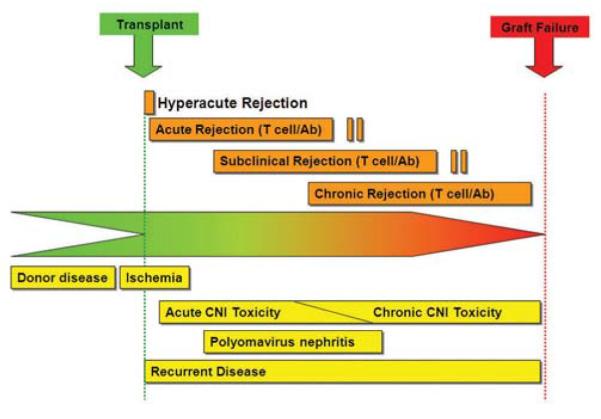
Timing of complications after kidney transplantation in allograft recipients. The differential diagnosis varies with the time since transplantation. Conditions above the line are related to immune rejection, and those below it to nonrejection causes of graft failure. Analysis of biopsy samples is needed to distinguish between these two categories of complications, which require different treatment. In the first few days after transplantation, the major concerns are post-transplantation acute tubular injury, anastomic complications of vessels and ureter with thrombosis, or obstruction, and hyperacute rejection. The following several weeks are dominated principally by acute antibody or cell-mediated rejection, acute drug toxicity, infection, occasionally recurrent disease, as well as lingering acute tubular injury and vascular complications. Up to 1 year post-transplantation, the issues include chronic drug toxicity, infection, recurrent disease, acute rejection, obstruction and renal artery stenosis. After the first year the major problems leading to graft dysfunction are chronic antibody-mediated rejection, chronic calcineurin inhibitor toxicity, recurrent glomerular disease and infection. Acute rejection can also occur at any time, particularly as a consequence of reduced immunosuppression (patient initiated or iatrogenic). *Rejection can be humoral or cell mediated. Abbreviation: CNI, calcineurin inhibitor. Permission obtained from Nature Publishing Group © Chapman et al. Kidney Int. Suppl. 99, S108–S112 (2005).
Immediate post-transplantation period
In the immediate post-transplantation period (≤3 days after implantation), if delayed renal graft function results in the need for continued dialysis, the primary objective is to differentiate between ischemic acute tubular injury (ATI), hyperacute rejection, and technical problems related to the surgical procedure: acute vascular thrombosis; failures of vascular or ureteral anastomoses (leaks or dehiscence); and perinephric hematoma or fluid collections (Figure 2). Analysis of biopsy samples is generally not useful for the definitive diagnosis of extrarenal complications, although some features are suggestive, such as hemorrhage, cortical necrosis and infarcts (major vascular complications) and collecting duct dilation, edema and a modest infiltrate (urine leaks, lymphocele or obstruction). Such vascular and mechanical complications are best detected by noninvasive imaging, such as duplex Doppler ultrasonography, MRI and CT, which can assess vascular flow and patency as well as the presence of perinephric collections.
Figure 2.

Pathological findings in renal biopsy samples taken 0–3 days after transplantation. a | Acute tubular injury, with loss of brush borders and nuclei in proximal tubules (arrow) and little infiltrate. These findings also persist beyond 3 days after transplantation in patients with delayed graft function. b | Hyperacute rejection, with neutrophils in glomerular capillaries (arrow). The inset image shows foci of C4d deposition (red staining) in some peritubular capillaries (arrow), but not others (asterisk). c | Acute tubulopathy resulting from the toxic effects of calcineurin inhibitors, with characteristic isometric vacuolization (arrow). This complication can occur at any time after transplantation. d | Urine leaks that cause obstruction typically demonstrate only a focal infiltrate (arrow), but can mimic acute cellular rejection. Permission obtained from Amirsys © Colvin, R. B. et al. Diagnostic Pathology: Kidney Diseases (Salt Lake City, 2011).
After such complications are ruled out, allograft biopsy can be helpful, and even crucial, in making a definitive diagnosis of the cause of graft dysfunction. Hyperacute graft rejection, in which pre-existing donor-specific antibody (DSA) levels are sufficient to cause rejection immediately following graft perfusion, has a characteristic appearance on light microscopy, with neutrophils in peritubular capillaries and glomeruli, accompanied by capillary congestion hemorrhage and focal microthrombi. Analysis of graft tissue using immuno fluorescence microscopy or immunohistochemistry also reveals C4d deposition in a linear pattern in peritubular capillaries which, in addition to the presence of DSA, is the major diagnostic criterion for hyperacute rejection. Moreover, in ABO-incompatible grafts, IgM deposition is often evident in peritubular capillaries. C4d deposition can, however, be focal or even absent in the earliest stages of hyperacute rejection, perhaps owing to poor graft perfusion. The presence of abundant neutrophils and C4d deposition distinguishes hyperacute rejection from ATI, although sometimes neutrophils are prominent in ATI.
Early post-transplantation period
The most common causes of graft dysfunction 3–30 days after transplantation are acute cell-mediated rejection (CMR), acute antibody-mediated rejection (AMR, also known as acute humoral rejection), and the toxic effects of calcineurin inhibitors (Figure 3). This triad also continues to dominate the differential diagnosis of graft dysfunction for the following 2 months. The Banff classification is widely used to define the diagnostic criteria for the various forms of rejection.18
Figure 3.

Pathological findings observed in renal biopsy samples obtained 3–30 days after transplantation. a | Acute cell-mediated rejection with tubulitis (arrow) and a mixed mononuclear interstitial infiltrate. b | Acute cell-mediated rejection with endarteritis (arrow) superimposed on chronic intimal fibroelastosis resulting from pre-existing donor disease, which can mimic chronic rejection. c | Acute AMR with prominent neutrophils in peritubular capillaries (arrows), a common finding in acute AMR. d | C4d deposition (brown staining) in acute AMR is typically widespread in peritubular capillaries (arrow) and can also be detected in glomeruli by immunohistochemistry. Abbreviation: AMR, antibody-mediated rejection. Permission obtained from Amirsys © Colvin, R. B. et al. Diagnostic Pathology: Kidney Diseases (Salt Lake City, 2011).
Acute CMR
Acute CMR is characterized by infiltration of T lymphocytes and monocytes, which invade renal tubules, causing tubulitis, interstitial edema and, in severe cases, arterial subendothelial mononuclear cell infiltration (endarteritis). Host T lymphocytes react to both major histo compatibility complex (MHC) and non-MHC allo-antigens expressed on the graft. Glomerulitis (mononuclear cell infiltration in glomerular capillaries) might also be present but is not a defining feature of acute CMR. Indeed, acute CMR has become less frequent with the introduction of improved immunosuppressive regimens and now occurs in <10% of renal graft recipients in the first post-transplantation year, although this rate is affected by a number of variables, including the level of T-cell presensitization to donor antigens and ethnicity (23.6% in African-Americans and 7.7% in other American populations).19
Acute AMR
Acute AMR is caused by DSA to antigens expressed on the graft microvasculature (particularly the peritubular and glomerular capillaries). These antibodies activate the complement system, leading to tissue injury. The usual targets of DSA are HLA class I or II antigens or ABO antigens (in recipients of ABO-incompatible grafts). Non-HLA antigens (as yet not well characterized) might also potentially serve as targets of DSA, as acute AMR is occasionally described in recipients of HLA-identical grafts.20,21
The frequency of acute AMR varies within the renal transplant population, but it occurs in <5% of patients after receiving their first ABO-compatible graft.1,2 Acute AMR is most common in patients who are presensitized to donor antigens and sensitive assays are therefore used to detect DSA before transplantation to minimize this risk.
A diagnosis of acute AMR requires morphologic evidence of acute tissue injury (including ATI, neutrophils in peritubular capillaries or fibrinoid necrosis of arteries); evidence of an interaction between host antibodies and graft tissue (typically C4d deposition in peritubular capillaries); and the identification of circulating DSA. C4d deposition, which occurs in a widespread, linear and circumferential distribution in peritubular capillaries, is detected by immunofluorescence microscopy or immunohistochemistry. Focal C4d deposition is of uncertain clinical relevance, but warrants determination of the patient's DSA status.18 Not all biopsy samples from patients with acute AMR show C4d deposition,22 and other clues, notably inflammation in peritubular capillaries (capillaritis), can help to identify acute AMR, especially in presensitized patients.23 Interpretation of C4d staining in renal biopsy samples is strongly influenced by the technique used: immunofluorescence microscopy of frozen tissues is the most sensitive and reproducible option.24 Banff working groups are currently seeking to establish diagnostic criteria for C4d-negative AMR and to assess the reproducibility of C4d staining across laboratories.
Toxic effects of calcineurin inhibitors
In patients with acute calcineurin inhibitor toxicity, the renal biopsy sample might be normal, show features of ATI or have isometric vacuolization of proximal tubular cells (toxic tubulopathy). The extent of nephropathy is dose-related, and the changes are reversible. Tubular epithelial cell vacuolization also occurs in patients with osmotic nephrosis owing to the administration of solutes, such as mannitol, and in recipients of intra venous immunoglobulin solutions.
Thrombotic microangiopathy is a rare complication associated with both calcineurin inhibitor and mTOR inhibitor therapy, such as rapamycin. The histologic features are primarily mucoid intimal thickening of small arteries and arterioles with trapped erythrocytes and a mild infiltrate of leukocytes, as well as scattered thrombi and (in severe cases) cortical necrosis. Thrombotic microangiopathy can also be a manifestation of acute AMR; indeed, in approximately half of patients, post-transplantation thrombotic microangiopathy is caused by acute AMR.25,26 Notably, C4d deposition is absent in peritubular capillaries in all forms of calcineurin inhibitor toxicity, including thrombotic microangiopathy. Rarely, thrombotic microangiopathy can mimic acute CMR owing to the presence of mononuclear arterial intimal inflammation.2 Detection of other features, such as red cell entrapment in arterial intima and thrombi, are helpful in this differential. Biopsy findings direct treatment decisions
In patients who present with the various forms of graft dysfunction described above, the biopsy findings become crucial in tailoring therapy to the patient. For example, in a high-risk renal graft recipient, such as a highly sensitized (>80% positivity for panel reactive antibodies) African-American patient in whom the donor kidney was subjected to prolonged cold ischemia, the histological appearance of ischemia-related ATI can be distinguished from that of aggressive, antibody-mediated hyperacute or cellular rejection. If the biopsy sample reveals ATI, induction therapy can be continued for an extended period before starting standard calcineurin-inhibitor-based therapy. Another important dividend of a biopsy is that overimmunosuppression after empiric use of high-dose antirejection medication can be avoided.
The first post-transplantation year
As always, the clinician's first step is to try to determine whether the cause of graft dysfunction is intrarenal or extrarenal. In the first 3–6 months after transplantation, mechanical causes of allograft dysfunction (although unusual) remain important to exclude; these include kinking or frank stenosis of the renal artery and delayed lymphocele formation. Lymphoceles usually occur within the first 3 months after transplantation and are caused by ligation of lymphatic vessels during preparation of the kidney for transplantation and during the actual transplantation procedure. In some patients, incomplete ligation leads to lymphatic leak and lymphocele formation. Lymphoceles can cause localized pain over the allograft, acute kidney allograft dysfunction, ipsilateral lower extremity edema, iliac vein thrombosis and pulmonary embolism.
Allograft dysfunction during the first year after transplantation might also be caused by pre-existing diseases in the host that recur after transplantation and by viral infections, in addition to acute rejection and calcineurin inhibitor toxicity (Figure 4).
Figure 4.

Pathological findings observed in renal biopsy samples obtained 1–12 months after transplantation. a | Polyomavirus nephropathy is initially suggested by detection of intranuclear inclusions (arrow). Inset image shows nuclear immunohistochemical staining for polyomavirus large T antigen. b | Adenovirus nephropathy characteristically has a granulomatous appearance and occasional enlarged nuclei. Diagnosis is confirmed by detection of adenoviral antigens by immunohistochemistry (inset image). c | Thrombotic microangiopathy is usually caused by the toxic effects of calcineurin inhibitors in transplant recipients. Glomeruli and small arteries show focal thrombi (arrow). d | Recurrent focal segmental glomerulosclerosis can occur at any time after transplantation and is characterized by segmental scarring and adhesions (black arrow) and occasional prominent podocytes (white arrow). Permission obtained from Amirsys © Colvin, R. B. et al. Diagnostic Pathology: Kidney Diseases (Salt Lake City, 2011).
Glomerular diseases
Glomerular diseases recur with varied frequency and consequences and are the third leading cause of graft loss in patients with glomerulonephritis.27 Among the glomerular diseases, several have a considerable effect on graft survival, including idiopathic FSGS, membranoproliferative glomerulonephritis type I, dense deposit disease, and atypical hemolytic-uremic syndrome.28,29 For example, primary FSGS recurs in approximately 30% of patients, sometimes within 1 h after transplantation.1,2 Many researchers have sought to identify biomarkers in plasma that can indicate the presence of FSGS or other glomerular diseases because an assay for such putative mediators would permit both better selection of patients for transplantation and also post-transplantation monitoring.30 For example, an assay has been developed to detect autoantibodies to phospholipase A2 receptor (PLA2R), which are the most common cause of idiopathic membranous glomerulonephritis (MGN), and is currently under evaluation in renal graft recipients.31,32 Recurrent glomerulonephritis is usually morphologically identical to the patient's original disease by light, immunofluorescence and electron microscopy. In this regard, recurrence in renal allografts could serve as a model system in which to study the early subclinical phases of the condition that resulted in the patient's kidney failure, such as the minimal change disease pattern in FSGS.
Viral pathogens
Polyomavirus nephropathy (PVN), another disease that commonly develops after transplantation (with a prevalence of 1–8%), has emerged as an important complication that can pose an enormous risk to graft longevity.33 PVN is characterized by tubulointerstitial nephritis, ureteral stricture and hemorrhagic or nonhemorrhagic cystitis. PVN is usually caused by BK virus, and less commonly by JC virus.34 The diagnosis is made in biopsy samples by the presence of inclusions and viral bodies in the nuclei of tubular epithelial cells, and confirmed by immunohistochemistry or electron microscopy.35 Occasionally, immune complex deposits are observed along the tubular basement membrane, which linger after viral clearance.36 The stage of PVN (early, florid and late) and the viral load (from <1% to >15% of tubular nuclei) can be assessed by histology and immunohistochemistry, with moderate reproducibility.37 Patients at risk of PVN can be identified by monitoring the polyomavirus load in plasma.38 Although the transient presence of polyomavirus in urine is common in patients with asymptomatic infections, persistent viruria precedes the development of PVN in all susceptible patients. Clusters of virions (so-called Haufen) in urine are observed by negative-staining electron microscopy and are strongly correlated with PVN.39 Kidney allografts are more susceptible to PVN than are native kidneys in recipients of nonrenal organ transplants, despite similar levels of immunosuppression.1,2 This observation suggests that either rejection of the renal graft promotes viral replication or that the lack of self-MHC antigens in the kidney allograft provides a sanctuary for the virus. Allogeneic kidney grafts in the mouse are better than isogeneic grafts in supporting viral replication and the viral infection augments the antiallogeneic T lymphocyte response.40
Although adenovirus infection occurs in approximately 6% of renal transplant recipients in the first year, clinically evident infection of the allograft is rare.41,42 In contrast to PVN, adenoviral infections in renal grafts commonly cause a granulomatous reaction and adenoviral antigens are detectable in biopsy samples by immunohistochemistry.40,41 Adenovirus infections are also typically associated with hematuria and systemic manifestions—clinical features that help to distinguish PVN from adenoviral nephropathy.
Late renal allograft dysfunction
Over the past 20 years, with the improvements in diagnosis and management of graft dysfunction, renal allograft loss has become less common in the first year after transplantation. 1-year failure rates now range from 3.4% for living donor grafts to 6.7% for standard-criteria, deceased-donor grafts, which is a reduction from 9% and 20%, respectively compared with rates 20 years ago.43 Graft survival after the first post-transplantation year however, has improved only marginally (~1%) during the same period.43 Currently, in the USA, the annual failure rate is 3–5% for living donor kidneys and 5–7% for standard-criteria, deceased-donor grafts from 1 to 10 years post-transplantation.43
Late allograft dysfunction has given rise to one of the most interesting and challenging areas of inquiry in renal transplant biology. Progress was initially impeded by introduction of the term `chronic allograft nephropathy' to refer to late graft pathology, because it obscured specific diagnostic categories.44 Chronic allograft nephropathy was subsequently abandoned by the Banff consensus in 2005 in favor of disease-specific diagnoses that enable prompt intervention and appropriate treatments to pre-empt late allograft failure.45 In only 5% of patients with late allograft failure, no underlying etiology can be identified.46 However, if all attempts to find the exact diagnosis underlying a biopsy finding of chronic interstitial fibrosis and tubular atrophy fail, the diagnosis is termed interstitial fibrosis and tubular atrophy not otherwise specified.45
Episodes of acute graft dysfunction are uncommon after the first post-transplantation year and are mostly associated with reduced levels of immunosuppression, either iatrogenic or self-induced. The typical presentation is progressive graft dysfunction (increasing serum creatinine levels and proteinuria), which develops over several months. Analysis of renal biopsy samples is particularly helpful in this setting, as the differential diagnosis is broad, including recurrent and de novo glomerular disease, chronic AMR, chronic CMR, calcineurin inhibitor toxicity, and PVN (Figure 5). Uncommon causes of late graft dysfunction include renal artery stenosis related to the surgical anastomosis, post-transplant lymphoproliferative disease, and pyelonephritis.3
Figure 5.

Pathological findings observed in renal biopsy samples obtained after the first year post-transplantation. a | Chronic AMR is characterized by duplication of the glomerular basement membrane, which is best observed in periodic acid-Schiff-stained sections. Inset image: C4d deposition (blue staining) is usually present in peritubular capillaries (stained brown with CD34, an endothelial marker) but can be focal, with only a minority of the peritubular capillaries affected, or even absent. b | The multilaminated glomerular basement membrane (black arrow) in chronic AMR can be observed by electron microscopy, which also reveals the loss of normal fenestrations in glomerular endothelial cells (red arrow). c | The most distinctive feature of calcineurin inhibitor toxicity in renal grafts ≥1 year after transplantation is severe hyalinosis of the arterioles, often with a peripheral nodular pattern (arrows). d | De novo focal segmental glomerulosclerosis can occur at any time after renal transplantation, but is most common ≥1 year after transplantation. Focal segmental glomerulosclerosis can also be a manifestation of the toxic effects of calcineurin inhibitors, which in this image shows a collapsing pattern with prominent podocytes (arrow). Abbreviation: AMR, antibody-mediated rejection. Permission obtained from Amirsys © Colvin, R. B. et al. Diagnostic Pathology: Kidney Diseases (Salt Lake City, 2011).
Chronic AMR
A frequent specific cause of late graft loss is chronic AMR,45,47,48 which arises in the setting of persistent or intermittent circulating DSA, usually to graft MHC class II antigens. In a prospective study, the majority (63%) of indication biopsy samples from renal allografts that failed after 12 months had evidence of chronic AMR, including circulating DSA and microcirculatory changes—glomerulitis, capillaritis, peritubular capillary multilayering, glomerulopathy and persistent scarring.49 Similar results were found in a multicenter study, in which 39% of biopsy samples from renal grafts with late dysfunction had C4d deposition, with or without detectable DSA in the circulation.50 Patients whose biopsy findings included C4d deposits had a significantly worse outcome, regardless of whether circulating DSAs were detected.50 Similarly, patients whose biopsy samples showed C4d deposits and transplant glomerulopathy had a worse prognosis than those with either feature alone.51 The combination of C4d deposition and DSA is also associated with acceleration of chronic arterial intimal fibrosis.52
The histological features of chronic AMR are transplant glomerulopathy (duplication of the glomerular basement membrane), multilamination of the peritubular capillary basement membrane, interstitial fibrosis and chronic transplant arteriopathy in various combinations, often with intravascular mononuclear cells in peritubular capillaries and glomeruli. Confirmation of the diagnosis requires evidence of antibody interaction with the graft tissue, most commonly in the form of C4d deposition along peritubular capillaries on immunofluorescence microscopy or immunohistochemistry, plus detection of circulating DSA. Lesions of a similar pathologic appearance can occur in the absence of C4d deposition (and occasionally in the absence of DSA). These biopsy samples are classified as suspicious for chronic AMR.
Some patients with circulating DSA and no C4d deposition in renal allograft biopsy samples show evidence of endothelial gene activation and/or intravascular mononuclear cells.53 Subsequently, a form of chronic AMR that does not involve the complement system has been proposed to occur,22 similar to that described in mouse allografts.54 In the mouse this process is mediated by natural killer cells;55 molecular studies have also provided evidence for a role of natural killer cells in human chronic AMR.56
Four stages of chronic AMR have been identified in nonhuman primate studies: induction of DSA; C4d deposition; transplant glomerulopathy; and progressive graft dysfunction.57 These stages progress slowly over many months, even without immunosuppressive therapy. Moreover, C4d deposition can be intermittent and might not be present in any particular biopsy sample.58 A similar sequence of events has been suggested to occur in humans, in which subclinical chronic AMR (DSA presence and C4d deposition) can be present for several years before the development of overt transplant glomerulopathy, as confirmed by analyses of protocol (surveillance) biopsies—those performed at predetermined intervals, irrespective of the presence or absence of graft dysfunction.59 Once a diagnosis of chronic AMR is confirmed, 18-month graft survival is 50%.50 Clinicians need, therefore, to detect this disease in the early stages, by monitoring circulating DSA levels in renal allograft recipients and performing renal biopsies in those who manifest de novo DSA.
Chronic CMR
Chronic CMR is less well defined than chronic AMR in the Banff classification, in part because interstitial inflammation in areas of interstitial fibrosis or in atrophic tubules is not counted as active rejection. In our opinion, chronic CMR should be considered in the presence of a mononuclear cell interstitial infiltrate, tubulitis and/or infiltration of the arterial intima, combined with interstitial fibrosis, tubular atrophy and/or intimal fibrosis.1,2 A contribution of chronic AMR to chronic CMR is common and needs to be assessed by looking for C4d deposition and DSA in renal biopsy samples. The criteria for this putative condition need further investigation.
Calcineurin inhibitor toxicity
Calcineurin inhibitor toxicity is prevalent in long-surviving allografts (and in native kidneys of recipients of other organ allografts), reaching 100% in one prospective study.60 Chronic calcineurin inhibitor toxicity is characterized by interstitial fibrosis, tubular atrophy and glomerulosclerosis, which are all nonspecific features. Many of the graft failures ascribed to calcineurin inhibitor toxicity could, therefore, have other causes, as no pathognomonic feature has been defined. From a diagnostic perspective, the most specific feature of the toxic effects of calcineurin inhibitors (usually either ciclosporin or tacrolimus) are the characteristic nodular peripheral hyaline deposits in the media of arterioles, although these deposits can occasionally be observed in kidneys from patients who have never taken these agents.61,62 A quantitative scoring system for calcineurin inhibitor arteriolo pathy, based on whether the hyaline deposits are focal or circumferential, is fairly reproducible and should become the standard method of assessment.63
De novo glomerular disease
After the first post-transplantation year, de novo glomerular diseases might arise, such as FSGS, MGN and diabetic glomerulopathy. FSGS has been linked to calcineurin inhibitor toxicity, owing to the impairment of glomerular perfusion by these drugs.62 Occasionally the FSGS has a collapsing pattern, which predicts a rapid decline in renal function, as in native kidneys.64 Collapsing FSGS can also be associated with use of mTOR inhibitors.65De novo MGN is similar in appearance to idiopathic MGN; however, the target antigen is not M-type PLA2R, and the condition is associated with chronic AMR. These differences suggest that de novo MGN could be a manifestation of alloantibodies to the podocyte.1
Transplant glomerulopathy, as defined by duplication of the glomerular basement membrane, is not a specific disease, but has several causes. In one study, there were three overlapping etiologies—chronic AMR (48%), thrombotic microangiopathy (32%), and hepatitis C virus infection (36%); 16% patients were idiopathic.66 Graft outcome was worst with hepatitis C infection; it is therefore important to identify the cause of transplant glomerulopathy, as it could have therapeutic implications.
Nonimmune pathology
Nonimmune injury also contributes to late graft pathology. The majority of kidney donor recipients become, or continue to be, hypertensive after transplantation.67 Stenosis of the transplant renal artery is one of the treatable causes of hypertension, and arises in approximately 2% of renal transplant recipients, typically after the first post-transplant year.68 Renal biopsy samples from these patients usually show ischemic atrophy and ATI secondary to intermittent stenosis. Chronic hypertension can lead to arterial intimal thickening and fibrosis, with duplication of the internal elastica, arteriolar and small artery hyalinosis, glomerulosclerosis, and interstitial fibrosis or tubular atrophy. Finally, recurrent or de novo diabetic nephropathy can result in chronic graft injury, starting approximately 5 years post-transplantation.
Complexity of renal graft pathology
The features of all major diseases of renal allografts have a pattern that changes over time, typically from early diagnostic lesions, to late nonspecific patterns. For example, PVN at the late stage might show no viral inclusions, and be incorrectly diagnosed as interstitial fibrosis with tubular atrophy not otherwise specified, unless an earlier biopsy sample showing these inclusions had been obtained. Furthermore, clinicians should bear in mind the limited amount of renal tissue that can be obtained by biopsy; thus, a sample might show more or less involvement than the whole kidney. In addition, the presence of features of more than one disease is usual in late renal biopsy samples, typically indicating some components of calcineurin inhibitor toxicity, donor disease (arteriosclerosis), and chronic rejection, sometimes with recurrent disease. The pathologist, together with the clinician, must try to determine the principal pathological processes that are present and decide which treatments might be of potential benefit. Clearly, this process could be made easier by advanced diagnostic tests.
Surveillance (protocol) biopsies
The value of surveillance biopsies has been to detect subclinical rejection, particularly in highly sensitized patients; to document graft outcomes in clinical trials; and as a research tool to identify pathogenetic mechanisms.50,60 Multiple features have been identified in such biopsy samples: for example, asymptomatic C4d deposition is detected in 2–4% of biopsy samples from non-presensitized patients in the first post-transplantation year69 and in almost 100% of ABO-incompatible grafts70 (a state termed accommodation). In addition, subclinical acute CMR (now <5% with current regimens)71 and subclinical polyomavirus infection have also been identified in approximately 2% of patients.72
An important insight from surveillance biopsy samples obtained 1 year post-transplantation is that the combination of interstitial fibrosis and infiltrate predicts long-term graft loss.73,74 The utility of routine surveillance biopsies in low-risk patients has, however, been questioned owing to the low frequency of rejection and consequent need for changes in therapy. Guided surveillance biopsies could be the best approach in the future, in which a noninvasive test (such as an assay for circulating DSA) is used to select patients for biopsy to increase the probability of finding a treatable abnormality.
Modern genetic techniques
Gene expression
Many groups have explored gene expression profiling by microarray or PCR in an effort to enhance the diagnostic accuracy of biopsy sample analysis and to provide pathogenetic insights. Findings include detection of cytotoxic T-cell transcripts (specifically granzyme B)75 and IFN-γ76 in samples from kidneys with acute rejection; the beneficial effect of increased expression of TGF-β in organs undergoing acute rejection;77 and the association of B-cell transcripts with a poor prognosis78,79 and the time after transplantation.80 Moreover, chronic AMR was associated with increased endothelial cell53 and natural killer cell transcripts,56 as well as expression of granzyme B and the transcription factor T-bet.81,82 A new way to express these data is to group them by pathogenetic pathways, which helps to organize the results and increases the robustness of any conclusions drawn from them.82
Although molecular studies have contributed to our understanding of the mechanisms underlying renal graft pathology, their practical value in the management of graft recipients has not been established. Despite their apparent objectivity, a surprising lack of congruence is evident in the results of meta-analyses of gene expression data. Translation of these molecular studies to the clinic will require these molecular tests to be validated across multiple laboratories, their interpretation standardized and their methodology simplified. Eventually, randomized clinical trials will be needed to analyze the effects of various therapies according to patients' gene expression profiles, which is analogous to the current drive to identify subgroups of patients who respond to targeted therapies in cancer research.
Several advantages and disadvantages of gene expression analyses are apparent in comparison with assessment of microscopic pathology (Box 2). Microarrays offer the considerable advantage over conventional pathology in their capacity to identify and quantify thousands of transcript species at once and in their capability to measure early and rapid changes before pathologic lesions are detectable. Microarrays and PCR techniques, however, destroy anatomical relationships and do not identify the source or location of the transcript, an approach equivalent to `reading' Shakespeare's plays by counting how many times each word appears.
The logistical issues and high cost of microarrays could be solved by innovative technology in the future, and these approaches might become part of the routine clinical evaluation of renal biopsy samples. In the meantime, however, insights from microarray studies are highly likely to refine the diagnostic categories and, in some cases at least, lead to more practical ways of detecting relevant molecular changes, for example, by combining PCR with immunofluorescence microscopy or immunohistochemistry. Multiparameter immunofluorescence microscopy can be done with quantum dots—crystalline semiconductors of a precise size, which emit light at specific wavelengths on excitation and are brighter and more stable than traditional fluorescent dyes—a powerful technology when combined with automated fluorescence scanning that can provide a quantitative assessment of multiple markers with histologic localization.84
We believe that a combination of gene expression analysis with histology will be the most valuable. For example, late graft loss was associated with the expression of inflammatory transcripts in conjunction with histology showing fibrosis in 1-year protocol biopsy samples of living-donor kidney allografts.85 Similarly, an adverse outcome was predicted by increased B-cell and IL-10 transcripts in protocol biopsy samples.78 Molecular tests can also reveal potential fallacies in the histopathologic classification.86,87 For example, the distinction between `suspicious for CMR' and `acute CMR' in the Banff schema is based on the maximum number of intratubular mononuclear cells (the severity of tubulitis), yet molecular testing showed no marked difference between gene expression profiles in samples classified as belonging to these two categories, raising the question of whether this distinction should be based on that pathologic feature and the threshold of acute CMR be lowered or whether the distinction should be based on other features.
Cluster and principal components analysis
Cluster and principal components analysis, as employed in gene expression studies, is also readily applicable to light, immunofluorescence and electron microscopy pathology parameters, provided that the pathologic features are quantitative and scored individually and the number of cases is large.66,88,89 Cluster analysis attempts to group patients with similar characteristics together and to delineate subsets within these cohorts (such as those with new-onset late graft dysfunction) with pathogenetically meaningful features. Pathologic data are combined with serologic and clinical information to correlate these groups with graft outcomes and responses to disease-specific therapeutic interventions. Proponents of this approach argue that this methodology could be used to deconstruct data matrixes and so provide the best explanation of the variance between histological groupings and outcomes.88
In protocol biopsy samples of 240 grafts with late dysfunction, the long-term deterioration of kidney allograft function (DeKAF) study yielded six clusters based on the measurement of 13 Banff scores among patients without recurrent disease or PVN.89 These clusters had widely differing 1-year graft survival (53–96%), which did not correlate well with traditional pathology diagnostic categories.89 The characterization of these clusters could probably be further improved with additional information, as this analysis did not take into account C4d deposition or DSA levels in the tissue samples—features that were strongly predictive of outcome in the same population.50
In a similar study based on 234 unselected indication biopsy samples, clustering algorithms based on Banff scores, C4d deposition and electron microscopy features yielded three categories: microcirculatory disease (glomerulitis, capillaritis, glomerular basement membrane duplication and mesangial expansion); scarring and/or hyalinosis; and tubulointerstitial inflammation.88 Patients in the microcirculatory disease group had an increased incidence of graft loss. DSA levels, C4d deposition and arteritis were features found in the microcirculatory disease group, whereas the time after transplantation and presence of arterial intimal fibrosis correlated with the scarring and/or hyalinosis group. Multilamination of the peritubular capillary basement membrane was found in both the microcirculatory disease and scarring and/or hyalinosis groups.88 The authors argue that this approach could lead to the identification of distinct classes of pathogenetic factors; they also propose that their technique might be useful in the future to supplement Banff scoring of individual biopsy samples with mathematical expressions derived from the prognostic implications of the lesions specific to each group, thereby leading to the development of a more robust composite Banff scoring system.
Morphometric methods
In part owing to the broad application of whole slide scanning, which provides a digital image for analytic and archival purposes, morphometric methods are increasingly becoming available in pathology laboratories. Improvements in reproducibility and accuracy of diagnosis are the primary goals of this method. Among the features that can be assessed by this technology are fibrosis and cellular infiltrates. Fibrosis has been linked to graft outcomes, particularly when associated with inflammation,72,79,85 and could one day become a target of drug intervention, in which case reproducible methods will be needed for its assessment.90 A comparative study reported the advantages and correlations of the major morphometric methods: trichrome stain, Sirius red stain, and collagen III immunohistochemistry.91 Collagen III morphometry and visual scoring of trichrome-stained sections had the best correlation with graft function.90 Clearly, the methodology for morphometry needs to be standardized. For this reason, a Banff working group was formed in 2011 to develop a consensus recommendation.
Detection of functionally relevant molecules in situ
A powerful approach for the assessment of renal biopsy samples is the detection of functionally relevant molecules in situ. C4d localization and extent of deposition is the best-known example of such an approach, but the number of other candidates is increasing rapidly. For example, FOXP3 (a transcription factor highly expressed in T-regulatory cells) can be readily detected in renal biopsy samples. Initial studies revealed FOXP3+ cells in human allografts affected by acute CMR, but its presence showed little or no correlation with graft outcome,92,93 leading to the conclusion that the FOXP3+ cells were bystanders. One study even reported that a worse outcome was associated with high levels of FOXP3 mRNA in biopsy samples showing acute rejection.94 However, studies in mice indicate that Foxp3+ cells are necessary for host acceptance of renal allografts.95 Indeed, when Foxp3+ cells are selectively depleted, renal grafts are rejected within 1 week. Moreover, subsequent clinical studies of protocol biopsy samples96 or indication biopsy samples showing borderline infiltrates97,98 in renal allografts revealed that patients whose biopsy samples showed an increased number or proportion of FOXP3+ cells had an improved prognosis, and evidence of donor-specific immune hyporesponsiveness.99 Other studies showed that patients renal grafts with AMR have a reduced level of FOXP3+ cells,92 which might account for the poor prognosis of individuals with AMR who have low urinary levels of FOXP3 mRNA.100 More studies are warranted to clarify the potential value of this marker.
Endothelial cells are considered a major target of the rejection process and assessment of their status in grafts is a logical goal. As noted above, increased endothelium-associated gene transcripts can be detected in patients with circulating DSA. However, this finding has not been translated into an immunohistochemistry test for the corresponding proteins, because many are constitutively expressed (B. Sis, personal communication). An alternative approach is to measure the extent of post-translational modification of signaling proteins. Antibodies to the phosphorylated forms of some signaling proteins, such as ERK and Akt, have been developed. Such antibodies can detect the extent and nature of endothelial activation.101 We expect that in the future these and similar markers of cell physiology will be more widely applied in the routine analysis of graft biopsy samples.
Conclusions
Assessment of conventional renal biopsy samples provides well-characterized criteria for most diseases that afflict the renal allograft. For this reason, biopsy analysis will remain a definitive procedure for the diagnosis of most causes of renal allograft dysfunction for the foreseeable future. Other, less invasive modalities, including gene expression profiling and proteomic analyses of blood and urine samples, as well as in vivo imaging, have the potential to contribute to our clinical armamentarium, but clinical acceptance of these techniques will depend on improvements in cost, speed and simplicity, as well as cross-laboratory validation. In the meantime, modern pathology techniques, such as identification of functional markers, morphometry and cluster analysis, if avidly pursued, are expected to enhance the clinical usefulness of assessments of transplant biopsy samples.
Key points
-
■
Renal biopsy analysis provides the best means of determining the cause of acute or chronic kidney allograft dysfunction
-
■
Biopsy results change the pretest diagnosis and recommended treatment in approximately 40% of patients
-
■
Kidney allograft pathology varies with time after transplantation
-
■
During the first year after transplantation, a high rate of recurrent kidney disease, as well as de novo glomerular disease and viral nephropathies, can occur
-
■
Late allograft dysfunction remains a challenging presentation: however, insights into its pathophysiology have been realized since the introduction of disease-specific categorization of pathological findings
-
■
New technologies are emerging that might lead to profound insights into the mechanisms of allograft dysfunction and the development of precise treatment protocols
Box 1 | Techniques for renal biopsy analysis.
Traditional morphological techniques
Light microscopy
Immunofluorescence
Immunohistochemistry
Electron microscopy
Modern morphological techniques
Functional markers
Morphometric analysis
Multiparameter immunofluorescence or quantum dots
Modern genetic techniques
Microarray gene expression
Cluster and/or principal component analysis*
*Also applicable to morphological analyses.
Box 2 | Biopsy gene expression vs microscopy.
Advantages of analysis of gene expression
Early warning
Rapid detection of response to therapy
Identification of potential drug targets
Objectivity
Advantages of microscopy
Speed
Low cost
Detection of anatomic site of injury
Assessment of severity and reversibility
Determination of adequacy
Acknowledgments
The authors thank the NIH and the Roche Organ Transplant Research Foundation for grant support and A. Bernard Collins, Martin Selig and Patricia Della Pelle for their outstanding technical contributions to biopsy analysis.
Footnotes
Author contributions W. W. Williams, D. Taheri and R. B. Colvin researched the data for the article and wrote the manuscript. W. W. Williams, D. Taheri, N. Tolkoff-Rubin and R. B. Colvin contributed substantially to discussions of the article content and undertook review and/or editing of the manuscript before submission.
Competing interests R. B. Colvin declares associations with the following companies: Alexion, Amicus, Genzyme, GlaxoSmithKline, Novartis. See the article online for full details of the relationships. The other authors declare no competing interests.
References
- 1.Colvin RB, et al. Diagnostic Pathology: Kidney Diseases. Amirsys; Salt Lake City: 2011. [Google Scholar]
- 2.Colvin RB, Nickeleit V. In: Heptinstall's Pathology of the Kidney. Jennette JC, Olson JL, Schwartz MM, Silva FG, editors. Vol. 2. Lippincott-Raven; Philadelphia: 2006. pp. 1347–1490. [Google Scholar]
- 3.Pascual M, et al. The clinical usefulness of the renal allograft biopsy in the cyclosporine era: a prospective study. Transplantation. 1999;67:737–741. doi: 10.1097/00007890-199903150-00016. [DOI] [PubMed] [Google Scholar]
- 4.Nickeleit V. Pathology: donor biopsy evaluation at time of renal grafting. Nat. Rev. Nephrol. 2009;5:249–251. doi: 10.1038/nrneph.2009.50. [DOI] [PubMed] [Google Scholar]
- 5.Massie AB, Desai NM, Montgomery RA, Singer AL, Segev DL. Improving distribution efficiency of hard-to-place deceased donor kidneys: predicting probability of discard or delay. Am. J. Transplant. 2010;10:1613–1620. doi: 10.1111/j.1600-6143.2010.03163.x. [DOI] [PubMed] [Google Scholar]
- 6.Remuzzi G, et al. Long-term outcome of renal transplantation from older donors. N. Engl. J. Med. 2006;354:343–352. doi: 10.1056/NEJMoa052891. [DOI] [PubMed] [Google Scholar]
- 7.Munivenkatappa RB, et al. The Maryland aggregate pathology index: a deceased donor kidney biopsy scoring system for predicting graft failure. Am. J. Transplant. 2008;8:2316–2324. doi: 10.1111/j.1600-6143.2008.02370.x. [DOI] [PubMed] [Google Scholar]
- 8.Perco P, et al. Histogenomics: association of gene expression patterns with histological parameters in kidney biopsies. Transplantation. 2009;87:290–295. doi: 10.1097/TP.0b013e318191b4c0. [DOI] [PubMed] [Google Scholar]
- 9.Naesens M, et al. Expression of complement components differs between kidney allografts from living and deceased donors. J. Am. Soc. Nephrol. 2009;20:1839–1851. doi: 10.1681/ASN.2008111145. [DOI] [PMC free article] [PubMed] [Google Scholar]
- 10.Kaminska D, et al. Cytokine gene expression in kidney allograft biopsies after donor brain death and ischemia-reperfusion injury using in situ reverse-transcription polymerase chain reaction analysis. Transplantation. 2007;84:1118–1124. doi: 10.1097/01.tp.0000287190.86654.74. [DOI] [PubMed] [Google Scholar]
- 11.Mueller TF, et al. The transcriptome of the implant biopsy identifies donor kidneys at increased risk of delayed graft function. Am. J. Transplant. 2008;8:78–85. doi: 10.1111/j.1600-6143.2007.02032.x. [DOI] [PubMed] [Google Scholar]
- 12.Mas VR, et al. Distinctive gene expression profiles characterize donor biopsies from HCV-positive kidney donors. Transplantation. 2010;90:1172–1179. doi: 10.1097/TP.0b013e3181f9ca6c. [DOI] [PMC free article] [PubMed] [Google Scholar]
- 13.Kainz A, et al. Gene-expression profiles and age of donor kidney biopsies obtained before transplantation distinguish medium term graft function. Transplantation. 2007;83:1048–1054. doi: 10.1097/01.tp.0000259960.56786.ec. [DOI] [PubMed] [Google Scholar]
- 14.Kurian SM, et al. Laparoscopic donor nephrectomy gene expression profiling reveals upregulation of stress and ischemia associated genes compared to control kidneys. Transplantation. 2005;80:1067–1071. doi: 10.1097/01.tp.0000176485.85088.f7. [DOI] [PubMed] [Google Scholar]
- 15.Schroppel B, et al. Tubular expression of KIM-1 does not predict delayed function after transplantation. J. Am. Soc. Nephrol. 2010;21:536–542. doi: 10.1681/ASN.2009040390. [DOI] [PMC free article] [PubMed] [Google Scholar]
- 16.Reeves-Daniel AM, et al. The APOL1 gene and allograft survival after kidney transplantation. Am. J. Transplant. 2011;11:1025–1030. doi: 10.1111/j.1600-6143.2011.03513.x. [DOI] [PMC free article] [PubMed] [Google Scholar]
- 17.Chapman JR. Longitudinal analysis of chronic allograft nephropathy: clinicopathologic correlations. Kidney Int. Suppl. 2005;99:S108–S112. doi: 10.1111/j.1523-1755.2005.09920.x. [DOI] [PubMed] [Google Scholar]
- 18.Solez K, et al. Banff 07 classification of renal allograft pathology: updates and future directions. Am. J. Transplant. 2008;8:753–760. doi: 10.1111/j.1600-6143.2008.02159.x. [DOI] [PubMed] [Google Scholar]
- 19.Padiyar A, et al. Influence of African-American ethnicity on acute rejection after early steroid withdrawal in primary kidney transplant recipients. Transplant. Proc. 2010;42:1643–1647. doi: 10.1016/j.transproceed.2010.02.081. [DOI] [PubMed] [Google Scholar]
- 20.Grafft CA, et al. Antibody-mediated rejection following transplantation from an HLA-identical sibling. Nephrol. Dial. Transplant. 2010;25:307–310. doi: 10.1093/ndt/gfp526. [DOI] [PubMed] [Google Scholar]
- 21.Collins AB, et al. Putative antibody-mediated rejection with C4d deposition in HLA-identical, ABO-compatible renal allografts. Transplant. Proc. 2006;38:3427–3429. doi: 10.1016/j.transproceed.2006.10.159. [DOI] [PubMed] [Google Scholar]
- 22.Haas M. C4d-negative antibody-mediated rejection in renal allografts: evidence for its existence and effect on graft survival. Clin. Nephrol. 2011;75:271–278. doi: 10.5414/cnp75271. [DOI] [PubMed] [Google Scholar]
- 23.Loupy A, et al. Significance of C4d Banff scores in early protocol biopsies of kidney transplant recipients with preformed donor-specific antibodies (DSA) Am. J. Transplant. 2011;11:56–65. doi: 10.1111/j.1600-6143.2010.03364.x. [DOI] [PubMed] [Google Scholar]
- 24.Seemayer CA, Gaspert A, Nickeleit V, Mihatsch MJ. C4d staining of renal allograft biopsies: a comparative analysis of different staining techniques. Nephrol. Dial. Transplant. 2007;22:568–576. doi: 10.1093/ndt/gfl594. [DOI] [PubMed] [Google Scholar]
- 25.Noris M, Remuzzi G. Thrombotic microangiopathy after kidney transplantation. Am. J. Transplant. 2010;10:1517–1523. doi: 10.1111/j.1600-6143.2010.03156.x. [DOI] [PubMed] [Google Scholar]
- 26.Satoskar AA, et al. De novo thrombotic microangiopathy in renal allograft biopsies—role of antibody-mediated rejection. Am. J. Transplant. 2010;10:1804–1811. doi: 10.1111/j.1600-6143.2010.03178.x. [DOI] [PubMed] [Google Scholar]
- 27.Briganti EM, Russ GR, McNeil JJ, Atkins RC, Chadban SJ. Risk of renal allograft loss from recurrent glomerulonephritis. N. Engl. J. Med. 2002;347:103–109. doi: 10.1056/NEJMoa013036. [DOI] [PubMed] [Google Scholar]
- 28.Hariharan S, et al. Recurrent and de novo glomerular disease after renal transplantation: a report from the Renal Allograft Disease Registry (RADR) Transplantation. 1999;68:635–641. doi: 10.1097/00007890-199909150-00007. [DOI] [PubMed] [Google Scholar]
- 29.Angelo JR, Bell CS, Braun MC. Allograft failure in kidney transplant recipients with membranoproliferative glomerulonephritis. Am. J. Kidney Dis. 2011;57:291–299. doi: 10.1053/j.ajkd.2010.09.021. [DOI] [PubMed] [Google Scholar]
- 30.Wei C, et al. Circulating urokinase receptor as a cause of focal segmental glomerulosclerosis. Nat. Med. 2011;17:952–960. doi: 10.1038/nm.2411. [DOI] [PMC free article] [PubMed] [Google Scholar]
- 31.Qin W, et al. Anti-phospholipase A2 receptor antibody in membranous nephropathy patients. J. Am. Soc. Nephrol. doi: 10.1681/ASN.2010090967. http://dx.doi.org/10.1681/ASN.2010090967. [DOI] [PMC free article] [PubMed]
- 32.Beck LH, Jr, et al. M-type phospholipase A2 receptor as target antigen in idiopathic membranous nephropathy. N. Engl. J. Med. 2009;361:11–21. doi: 10.1056/NEJMoa0810457. [DOI] [PMC free article] [PubMed] [Google Scholar]
- 33.Randhawa P, Brennan DC. BK virus infection in transplant recipients: an overview and update. Am. J. Transplant. 2006;6:2000–2005. doi: 10.1111/j.1600-6143.2006.01403.x. [DOI] [PubMed] [Google Scholar]
- 34.Drachenberg CB, et al. Polyomavirus BK versus JC replication and nephropathy in renal transplant recipients: a prospective evaluation. Transplantation. 2007;84:323–330. doi: 10.1097/01.tp.0000269706.59977.a5. [DOI] [PubMed] [Google Scholar]
- 35.Nickeleit V SJ, Mihatsch MJ. BK virus infection after kidney transplantation. Graft. 2002;5(Suppl.):S46–S57. [Google Scholar]
- 36.Bracamonte E, et al. Tubular basement membrane immune deposits in association with BK polyomavirus nephropathy. Am. J. Transplant. 2007;7:1552–1560. doi: 10.1111/j.1600-6143.2007.01794.x. [DOI] [PubMed] [Google Scholar]
- 37.Sar A, et al. Interobserver agreement for polyomavirus nephropathy grading in renal allografts using the working proposal from the 10th Banff Conference on Allograft Pathology. Hum. Pathol. 2011;42:2018–2024. doi: 10.1016/j.humpath.2011.03.008. [DOI] [PubMed] [Google Scholar]
- 38.Hirsch HH, et al. Prospective study of polyomavirus type BK replication and nephropathy in renal-transplant recipients. N. Engl. J. Med. 2002;347:488–496. doi: 10.1056/NEJMoa020439. [DOI] [PubMed] [Google Scholar]
- 39.Singh HK, et al. Presence of urinary Haufen accurately predicts polyomavirus nephropathy. J. Am. Soc. Nephrol. 2009;20:416–427. doi: 10.1681/ASN.2008010117. [DOI] [PMC free article] [PubMed] [Google Scholar]
- 40.Han Lee ED, et al. A mouse model for polyomavirus-associated nephropathy of kidney transplants. Am. J. Transplant. 2006;6:913–922. doi: 10.1111/j.1600-6143.2006.01265.x. [DOI] [PubMed] [Google Scholar]
- 41.Varma MC, et al. Early onset adenovirus infection after simultaneous kidney-pancreas transplant. Am. J. Transplant. 2011;11:623–627. doi: 10.1111/j.1600-6143.2010.03408.x. [DOI] [PubMed] [Google Scholar]
- 42.Storsley L, Gibson IW. Adenovirus interstitial nephritis and rejection in an allograft. J. Am. Soc. Nephrol. 2011;22:1423–1427. doi: 10.1681/ASN.2010090941. [DOI] [PMC free article] [PubMed] [Google Scholar]
- 43.Lamb KE, Lodhi S, Meier-Kriesche HU. Long-term renal allograft survival in the United States: a critical reappraisal. Am. J. Transplant. 2011;11:450–462. doi: 10.1111/j.1600-6143.2010.03283.x. [DOI] [PubMed] [Google Scholar]
- 44.Colvin RB. Chronic allograft nephropathy. N. Engl. J. Med. 2003;349:2288–2290. doi: 10.1056/NEJMp038178. [DOI] [PubMed] [Google Scholar]
- 45.Solez K, et al. Banff `05 Meeting Report: differential diagnosis of chronic allograft injury and elimination of chronic allograft nephropathy (`CAN') Am. J. Transplant. 2007;7:518–526. doi: 10.1111/j.1600-6143.2006.01688.x. [DOI] [PubMed] [Google Scholar]
- 46.El-Zoghby ZM, et al. Identifying specific causes of kidney allograft loss. Am. J. Transplant. 2009;9:527–535. doi: 10.1111/j.1600-6143.2008.02519.x. [DOI] [PubMed] [Google Scholar]
- 47.Mauiyyedi S, et al. Chronic humoral rejection: identification of antibody-mediated chronic renal allograft rejection by C4d deposits in peritubular capillaries. J. Am. Soc. Nephrol. 2001;12:574–582. doi: 10.1681/ASN.V123574. [DOI] [PubMed] [Google Scholar]
- 48.Regele H, et al. Capillary deposition of complement split product C4d in renal allografts is associated with basement membrane injury in peritubular and glomerular capillaries: a contribution of humoral immunity to chronic allograft rejection. J. Am. Soc. Nephrol. 2002;13:2371–2380. doi: 10.1097/01.asn.0000025780.03790.0f. [DOI] [PubMed] [Google Scholar]
- 49.Einecke G, et al. Antibody-mediated microcirculation injury is the major cause of late kidney transplant failure. Am. J. Transplant. 2009;9:2520–2531. doi: 10.1111/j.1600-6143.2009.02799.x. [DOI] [PubMed] [Google Scholar]
- 50.Gaston RS, et al. Evidence for antibody-mediated injury as a major determinant of late kidney allograft failure. Transplantation. 2010;90:68–74. doi: 10.1097/TP.0b013e3181e065de. [DOI] [PubMed] [Google Scholar]
- 51.Kieran N, et al. Combination of peritubular c4d and transplant glomerulopathy predicts late renal allograft failure. J. Am. Soc. Nephrol. 2009;20:2260–2268. doi: 10.1681/ASN.2009020199. [DOI] [PMC free article] [PubMed] [Google Scholar]
- 52.Hill GS, et al. Donor specific antibodies accelerate arteriosclerosis after kidney transplantation. J. Am. Soc. Nephrol. 2011;22:975–983. doi: 10.1681/ASN.2010070777. [DOI] [PMC free article] [PubMed] [Google Scholar]
- 53.Sis B, et al. Endothelial gene expression in kidney transplants with alloantibody indicates antibody mediated damage despite lack of C4d staining. Am. J. Transplant. 2009;9:2312–2323. doi: 10.1111/j.1600-6143.2009.02761.x. [DOI] [PubMed] [Google Scholar]
- 54.Hirohashi T, et al. Complement independent antibody-mediated endarteritis and transplant arteriopathy in mice. Am. J. Transplant. 2010;10:510–517. doi: 10.1111/j.1600-6143.2009.02958.x. [DOI] [PMC free article] [PubMed] [Google Scholar]
- 55.Hirohashi T, et al. A novel pathway of chronic allograft rejection mediated by NK cells and alloantibody. Am. J. Transplant. doi: 10.1111/j.1600-6143.2011.03836.x. doi:10.1111/j.1600-6143.2011.03836.x) [DOI] [PMC free article] [PubMed] [Google Scholar]
- 56.Hidalgo LG, et al. NK cell transcripts and NK cells in kidney biopsies from patients with donor-specific antibodies: evidence for NK cell involvement in antibody-mediated rejection. Am. J. Transplant. 2010;10:1812–1822. doi: 10.1111/j.1600-6143.2010.03201.x. [DOI] [PubMed] [Google Scholar]
- 57.Smith RN, et al. Four stages and lack of stable accommodation in chronic alloantibody-mediated renal allograft rejection in Cynomolgus monkeys. Am. J. Transplant. 2008;8:1662–1672. doi: 10.1111/j.1600-6143.2008.02303.x. [DOI] [PMC free article] [PubMed] [Google Scholar]
- 58.Nickeleit V, Zeiler M, Gudat F, Thiel G, Mihatsch MJ. Detection of the complement degradation product C4d in renal allografts: diagnostic and therapeutic implications. J. Am. Soc. Nephrol. 2002;13:242–251. doi: 10.1681/ASN.V131242. [DOI] [PubMed] [Google Scholar]
- 59.Farris AB, et al. Acute renal endothelial injury during marrow recovery in a cohort of combined kidney and bone marrow allografts. Am. J. Transplant. 2011;11:1464–1477. doi: 10.1111/j.1600-6143.2011.03572.x. [DOI] [PMC free article] [PubMed] [Google Scholar]
- 60.Nankivell BJ, et al. The natural history of chronic allograft nephropathy. N. Engl. J. Med. 2003;349:2326–2333. doi: 10.1056/NEJMoa020009. [DOI] [PubMed] [Google Scholar]
- 61.Snanoudj R, et al. Specificity of histological markers of long-term CNI nephrotoxicity in kidney transplant recipients under low-dose cyclosporine therapy. Am. J. Transplant. 2011;11:2635–2646. doi: 10.1111/j.1600-6143.2011.03718.x. [DOI] [PubMed] [Google Scholar]
- 62.Chapman JR. Chronic calcineurin inhibitor nephrotoxicity—lest we forget. Am. J. Transplant. 2011;11:693–697. doi: 10.1111/j.1600-6143.2011.03504.x. [DOI] [PubMed] [Google Scholar]
- 63.Sis B, et al. Reproducibility studies on arteriolar hyaline thickening scoring in calcineurin inhibitor-treated renal allograft recipients. Am. J. Transplant. 2006;6:1444–1450. doi: 10.1111/j.1600-6143.2006.01302.x. [DOI] [PubMed] [Google Scholar]
- 64.Meehan SM, et al. De novo collapsing glomerulopathy in renal allografts. Transplantation. 1998;65:1192–1197. doi: 10.1097/00007890-199805150-00009. [DOI] [PubMed] [Google Scholar]
- 65.Dogan E, Ghanta M, Tanriover B. Collapsing glomerulopathy in a renal transplant recipient: potential molecular mechanisms. Ann. Transplant. 2011;16:113–116. doi: 10.12659/aot.881874. [DOI] [PubMed] [Google Scholar]
- 66.Baid-Agrawal S, et al. Overlapping pathways to transplant glomerulopathy: chronic humoral rejection, hepatitis C infection, and thrombotic microangiopathy. Kidney Int. 2011;80:879–885. doi: 10.1038/ki.2011.194. [DOI] [PubMed] [Google Scholar]
- 67.Rubin MF. Hypertension following kidney transplantation. Adv. Chronic Kidney Dis. 2011;18:17–22. doi: 10.1053/j.ackd.2010.10.006. [DOI] [PubMed] [Google Scholar]
- 68.Hurst FP, et al. Incidence, predictors and outcomes of transplant renal artery stenosis after kidney transplantation: analysis of USRDS. Am. J. Nephrol. 2009;30:459–467. doi: 10.1159/000242431. [DOI] [PubMed] [Google Scholar]
- 69.Mengel M, et al. Incidence of C4d stain in protocol biopsies from renal allografts: results from a multicenter trial. Am. J. Transplant. 2005;5:1050–1056. doi: 10.1111/j.1600-6143.2005.00788.x. [DOI] [PubMed] [Google Scholar]
- 70.Haas M, et al. C4d and C3d staining in biopsies of ABO- and HLA-incompatible renal allografts: correlation with histologic findings. Am. J. Transplant. 2006;6:1829–1840. doi: 10.1111/j.1600-6143.2006.01356.x. [DOI] [PubMed] [Google Scholar]
- 71.Kraus ES, et al. Subclinical rejection in stable positive crossmatch kidney transplant patients: incidence and correlations. Am. J. Transplant. 2009;9:1826–1834. doi: 10.1111/j.1600-6143.2009.02701.x. [DOI] [PubMed] [Google Scholar]
- 72.Khamash HA, et al. Polyomavirus-associated nephropathy risk in kidney transplants: the influence of recipient age and donor gender. Kidney Int. 2007;71:1302–1309. doi: 10.1038/sj.ki.5002247. [DOI] [PubMed] [Google Scholar]
- 73.Seron D, Moreso F. Protocol biopsies in renal transplantation: prognostic value of structural monitoring. Kidney Int. 2007;72:690–697. doi: 10.1038/sj.ki.5002396. [DOI] [PubMed] [Google Scholar]
- 74.Mengel M, et al. Protocol biopsies in renal transplantation: insights into patient management and pathogenesis. Am. J. Transplant. 2007;7:512–517. doi: 10.1111/j.1600-6143.2006.01677.x. [DOI] [PubMed] [Google Scholar]
- 75.Lipman ML, Stevens AC, Strom TB. Cytotoxic T lymphocyte (CTL) and immunosuppressive cytokine gene expression in human renal allograft biopsies. J. Am. Soc. Nephrol. 1992;3:867–872. [Google Scholar]
- 76.Nast CC, et al. γ-Interferon gene expression in human renal allograft fine-needle aspirates. Transplantation. 1994;57:498–502. [PubMed] [Google Scholar]
- 77.Eikmans M, et al. High transforming growth factor-β and extracellular matrix mRNA response in renal allografts during early acute rejection is associated with absence of chronic rejection. Transplantation. 2002;73:573–579. doi: 10.1097/00007890-200202270-00016. [DOI] [PubMed] [Google Scholar]
- 78.Sarwal M, et al. Molecular heterogeneity in acute renal allograft rejection identified by DNA microarray profiling. N. Engl. J. Med. 2003;349:125–138. doi: 10.1056/NEJMoa035588. [DOI] [PubMed] [Google Scholar]
- 79.Hueso M, et al. Intragraft expression of the IL-10 gene is up-regulated in renal protocol biopsies with early interstitial fibrosis, tubular atrophy, and subclinical rejection. Am. J. Pathol. 2010;176:1696–1704. doi: 10.2353/ajpath.2010.090411. [DOI] [PMC free article] [PubMed] [Google Scholar]
- 80.Einecke G, et al. Expression of B cell and immunoglobulin transcripts is a feature of inflammation in late allografts. Am. J. Transplant. 2008;8:1434–1443. doi: 10.1111/j.1600-6143.2008.02232.x. [DOI] [PubMed] [Google Scholar]
- 81.Ashton-Chess J, et al. Regulatory, effector, and cytotoxic T cell profiles in long-term kidney transplant patients. J. Am. Soc. Nephrol. 2009;20:1113–1122. doi: 10.1681/ASN.2008050450. [DOI] [PMC free article] [PubMed] [Google Scholar]
- 82.Homs S, et al. Predominant TH1 and cytotoxic phenotype in biopsies from renal transplant recipients with transplant glomerulopathy. Am. J. Transplant. 2009;9:1230–1236. doi: 10.1111/j.1600-6143.2009.02596.x. [DOI] [PubMed] [Google Scholar]
- 83.Halloran PF, et al. The molecular phenotype of kidney transplants. Am. J. Transplant. 2010;10:2215–2222. doi: 10.1111/j.1600-6143.2010.03267.x. [DOI] [PubMed] [Google Scholar]
- 84.Isse K, et al. Adding value to liver (and allograft) biopsy evaluation using a combination of multiplex quantum dot immunostaining, high-resolution whole-slide digital imaging, and automated image analysis. Clin. Liver Dis. 2010;14:669–685. doi: 10.1016/j.cld.2010.07.004. [DOI] [PubMed] [Google Scholar]
- 85.Park WD, Griffin MD, Cornell LD, Cosio FG, Stegall MD. Fibrosis with inflammation at one year predicts transplant functional decline. J. Am. Soc. Nephrol. 2010;21:1987–1997. doi: 10.1681/ASN.2010010049. [DOI] [PMC free article] [PubMed] [Google Scholar]
- 86.Mueller TF, et al. Microarray analysis of rejection in human kidney transplants using pathogenesis-based transcript sets. Am. J. Transplant. 2007;7:2712–2722. doi: 10.1111/j.1600-6143.2007.02005.x. [DOI] [PubMed] [Google Scholar]
- 87.Mengel M, Sis B, Halloran PF. SWOT analysis of Banff: strengths, weaknesses, opportunities and threats of the international Banff consensus process and classification system for renal allograft pathology. Am. J. Transplant. 2007;7:2221–2226. doi: 10.1111/j.1600-6143.2007.01924.x. [DOI] [PubMed] [Google Scholar]
- 88.Sis B, et al. Cluster analysis of lesions in nonselected kidney transplant biopsies: microcirculation changes, tubulointerstitial inflammation and scarring. Am. J. Transplant. 2010;10:421–430. doi: 10.1111/j.1600-6143.2009.02938.x. [DOI] [PubMed] [Google Scholar]
- 89.Matas A, et al. Histopathologic clusters differentiate subgroups within the nonspecific diagnoses of CAN or CR: preliminary data from the DeKAF study. Am. J. Transplant. 2010;10:315–323. doi: 10.1111/j.1600-6143.2009.02943.x. [DOI] [PubMed] [Google Scholar]
- 90.Servais A, et al. Interstitial fibrosis quantification in renal transplant recipients randomized to continue cyclosporine or convert to sirolimus. Am. J. Transplant. 2009;9:2552–2560. doi: 10.1111/j.1600-6143.2009.02803.x. [DOI] [PubMed] [Google Scholar]
- 91.Farris AB, et al. Morphometric and visual evaluation of fibrosis in renal biopsies. J. Am. Soc. Nephrol. 2011;22:176–186. doi: 10.1681/ASN.2009091005. [DOI] [PMC free article] [PubMed] [Google Scholar]
- 92.Veronese F, et al. Pathological and clinical correlates of FOXP3+ cells in renal allografts during acute rejection. Am. J. Transplant. 2007;7:914–922. doi: 10.1111/j.1600-6143.2006.01704.x. [DOI] [PubMed] [Google Scholar]
- 93.Bunnag S, et al. FOXP3 expression in human kidney transplant biopsies is associated with rejection and time post transplant but not with favorable outcomes. Am. J. Transplant. 2008;8:1423–1433. doi: 10.1111/j.1600-6143.2008.02268.x. [DOI] [PubMed] [Google Scholar]
- 94.Yapici U, et al. Intragraft FOXP3 protein or mRNA during acute renal allograft rejection correlates with inflammation, fibrosis, and poor renal outcome. Transplantation. 2009;87:1377–1380. doi: 10.1097/TP.0b013e3181a24a4b. [DOI] [PubMed] [Google Scholar]
- 95.Miyajima M, et al. Early acceptance of renal allografts in mice is dependent on Foxp3+ cells. Am. J. Pathol. 2011;178:1635–1645. doi: 10.1016/j.ajpath.2010.12.024. [DOI] [PMC free article] [PubMed] [Google Scholar]
- 96.Bestard O, et al. Presence of FoxP3+ regulatory T cells predicts outcome of subclinical rejection of renal allografts. J. Am. Soc. Nephrol. 2008;19:2020–2026. doi: 10.1681/ASN.2007111174. [DOI] [PMC free article] [PubMed] [Google Scholar]
- 97.Mansour H, et al. Intragraft levels of Foxp3 mRNA predict progression in renal transplants with borderline change. J. Am. Soc. Nephrol. 2008;19:2277–2281. doi: 10.1681/ASN.2008030254. [DOI] [PMC free article] [PubMed] [Google Scholar]
- 98.Grimbert P, et al. The regulatory/cytotoxic graft-infiltrating T cells differentiate renal allograft borderline change from acute rejection. Transplantation. 2007;83:341–346. doi: 10.1097/01.tp.0000248884.71946.19. [DOI] [PubMed] [Google Scholar]
- 99.Bestard O, et al. Achieving donor-specific hyporesponsiveness is associated with FOXP3+ regulatory T cell recruitment in human renal allograft infiltrates. J. Immunol. 2007;179:4901–4909. doi: 10.4049/jimmunol.179.7.4901. [DOI] [PubMed] [Google Scholar]
- 100.Muthukumar T, et al. Messenger RNA for FOXP3 in the urine of renal-allograft recipients. N. Engl. J. Med. 2005;353:2342–2351. doi: 10.1056/NEJMoa051907. [DOI] [PubMed] [Google Scholar]
- 101.Zhang X, Reed EF. Effect of antibodies on endothelium. Am. J. Transplant. 2009;9:2459–2465. doi: 10.1111/j.1600-6143.2009.02819.x. [DOI] [PMC free article] [PubMed] [Google Scholar]