

Abstract
Earlier histopathology studies suggest that parasite loads may differ between cutaneous leishmaniasis (CL) and mucosal leishmaniasis (ML) lesions and between acute and chronic CL. Formal demonstration requires highly sensitive detection and accurate quantification of Leishmania in human lesional tissue. In this study, we developed a quantitative real-time PCR (qPCR) assay targeting minicircle kinetoplast DNA (kDNA) to detect and quantify Leishmania (Viannia) parasites. We evaluated a total of 156 lesion biopsy specimens from CL or ML suspected cases and compared the quantitative performance of our kDNA qPCR assay with that of a previously validated qPCR assay based on the glucose-6-phosphate dehydrogenase (G6PD) gene. We also examined the relationship between parasite load and clinical parameters. The kDNA qPCR sensitivity for Leishmania detection was 97.9%, and its specificity was 87.5%. The parasite loads quantified by kDNA qPCR and G6PD qPCR assays were highly correlated (r = 0.87; P < 0.0001), but the former showed higher sensitivity (P = 0.000). CL lesions had 10-fold-higher parasite loads than ML lesions (P = 0.009). Among CL patients, the parasite load was inversely correlated with disease duration (P = 0.004), but there was no difference in parasite load according to the parasite species, the patient's age, and number or area of lesions. Our findings confirm that CL and recent onset of disease (<3 months) are associated with a high parasite load. Our kDNA qPCR assay proved highly sensitive and accurate for the detection and quantification of Leishmania (Viannia) spp. in lesion biopsy specimens. It has potential application as a diagnostic and follow-up tool in American tegumentary leishmaniasis.
INTRODUCTION
American tegumentary leishmaniasis (ATL) is a major public health problem in the New World; it is a cause of social stigma and has a considerable impact on morbidity and quality of life of the affected population. Clinical presentation and outcome of ATL are associated with the host immune response and the infecting Leishmania species (1, 2). Among the different parasite species causing cutaneous leishmaniasis (CL) in the New World, Leishmania (Viannia) braziliensis is considered the most important because of its prevalence, its difficulty to cure, its public health importance, and the risk of severe disease, i.e., disfiguring mucosal leishmaniasis (ML) (2–6).
Quantitative assessment of the Leishmania load in host tissues has been proposed to be useful in monitoring the response to antileishmanial therapy and for addressing gaps in the understanding of the natural history of human infection with Leishmania (7–9). The traditional method of quantification of Leishmania in host tissues is the limiting dilution assay (LDA) (10, 11). However, this assay is arduous and time-consuming; it depends on sterile conditions and highly trained personnel and can be applied only with fresh samples with relatively high parasite loads because of its low sensitivity (10, 12). Nowadays, quantitative real-time PCR (qPCR) is widely used in research and diagnostics, since it provides rapid, sensitive, and accurate detection and quantification of pathogens (13–15). As for Leishmania, reports on the use of qPCR have focused mostly on visceral leishmaniasis (VL) (16–18), while reports on ATL due to Leishmania (Viannia) species are scanty. One report described qPCR assays targeting the Leishmania glucose-6-phosphate dehydrogenase (G6PD) locus to identify different Leishmania (Viannia) species and quantify the parasites (19). Since G6PD is a single-copy gene, it is expected that the G6PD qPCR assay has limited sensitivity for application in tissues with low parasite loads. In contrast, multicopy kinetoplast DNA (kDNA) could boost this sensitivity. Indeed, different studies describing qPCR assays targeting kDNA proved highly sensitive for detection, species discrimination, and quantification of Leishmania in clinical specimens from patients with different forms of leishmaniasis (17, 20, 21).
In this study, we developed and validated a SYBR green-based qPCR assay targeting kDNA to simultaneously detect and quantify Leishmania (Viannia) parasites with high sensitivity in skin and mucosal lesion biopsy specimens. We evaluated the correlation between measurements estimated with our kDNA qPCR assay and with a G6PD qPCR assay validated previously (19). Moreover, parallel quantification of the human endogenous retrovirus 3 (ERV-3) gene allowed normalization of the parasite number for the number of cell equivalents present in each biopsy specimen. The applicability of our assay was demonstrated by its ability to quantify low parasite loads characteristic of lesions from patients with ML and chronic CL. To our knowledge, this is the first report of the quantitative comparison of parasite loads in CL and ML lesions by means of qPCR. We also analyzed the parasite load according to parasite species and clinical parameters in patients with CL.
MATERIALS AND METHODS
Ethics statement.
This study was approved by the Institutional Review Boards of Hospital Nacional Cayetano Heredia and Universidad Peruana Cayetano Heredia (Lima, Peru) and the Hospital Nacional Adolfo Guevara Velasco (Cusco, Peru). All patients provided written informed consent for the study procedures prior to enrollment.
Patient lesion biopsies and promastigote cultures.
One hundred fifty-six skin and mucosal lesion biopsy specimens (2 mm in diameter) were taken before treatment from 152 Peruvian patients with clinically suspected CL, ML, or mucocutaneous leishmaniasis (MCL). In MCL, there are both CL and ML concurrent lesions. Patients were enrolled at the Instituto de Medicina Tropical Alexander von Humboldt (IMTAvH) in Lima and at the Hospital Nacional Adolfo Guevara Velasco in Cusco between 2008 and 2011. The biopsy specimens were preserved in absolute ethanol and stored at −20°C prior to further processing.
Four Leishmania (V.) braziliensis reference strains (MHOM/BR/75/M2903, MHOM/BR/75/M2904, MHOM/PE/93/LC2177, and MHOM/PE/91/LC2043) and 3 Leishmania (V.) guyanensis reference strains (MHOM/BR/75/M4147, IPRN/PE/87/Lp52, and MHOM/PE/03/LH2549) were cultured as promastigotes in Novy-MacNeal-Nicolle (NNN) medium, as reported elsewhere (22). Cells were harvested, washed, and resuspended in phosphate-buffered saline (PBS) (pH 7.2).
Reference standards for diagnosis.
We defined a lesion to be due to Leishmania when at least 1 of 3 tests was positive, where tests refer to direct smear (microscopy), culture, and biopsy specimen qualitative PCR targeting the kDNA minicircles. A biopsy specimen negative for the 3 tests was defined as negative. The sensitivity and specificity of the qualitative and real-time-based PCR tests targeting kDNA were evaluated (23).
Isolation of DNA from lesion biopsy specimens and cultured strains.
The biopsy specimens were minced with a sterile scalpel. Then, the biopsy specimens and promastigote pellets were subjected to overnight lysis with proteinase K and processed for DNA isolation using the High Pure PCR template preparation kit (Roche), according to the manufacturer's instructions. The isolated DNA was quantified by fluorometry using the Quant-iT high-sensitivity DNA assay kit and the Qubit fluorometer (Invitrogen).
Qualitative PCR detecting Leishmania (Viannia) kDNA and species identification.
Leishmania kDNA PCR was performed using primers and conditions described previously (24, 25). Parasites were typed according to the algorithm reported elsewhere (26).
Detection and quantification of Leishmania (Viannia) spp. by quantitative real-time PCR.
A qPCR assay based on kDNA minicircle amplification (kDNA qPCR) was developed for detection and quantification of Leishmania (Viannia) DNA in biological samples. It uses the primer set described previously for qualitative, diagnostic PCR (24). To normalize the parasite load for human cell equivalents, we quantified in parallel the single-copy human gene endogenous retrovirus 3 (ERV-3) (27, 28).
In order to analyze the variability of the number of minicircles and its impact on the quantification results among Leishmania (Viannia)-positive samples, comparative quantification was performed for 7 reference strains and 43 clinical specimens by targeting a single-copy gene, the Leishmania G6PD gene (19). The relative number of kDNA copies was calculated as follows: (parasite DNA equivalents/reaction estimated by kDNA qPCR)/(parasites/reaction estimated by G6PD qPCR).
The qPCRs were performed in a 25-μl volume consisting of 5 μl of DNA sample (10 ng), 200 μM (each) primer (see Table S1 in the supplemental material), and 1× iQ SYBR green supermix (Bio-Rad). Reactions were run on the LightCycler 480 system (Roche). The thermal cycling conditions were as follows: 95°C for 3 min, 35 cycles (kDNA qPCR and ERV-3 qPCR) or 36 cycles (G6PD qPCR) at 95°C for 20 s, 60°C for 20 s, and 72°C for 20 s. Fluorescence emission was measured at the end of the elongation step. After PCR amplification, a melting curve was generated to check the amplicon specificity; it consisted of 1 cycle at 95°C for 60 s, followed by 60°C for 60 s and continuous heating at 0.02°C/s to 95°C. The PCR product of each targeted gene had a specific Tm (see Table S1). Each run included a positive-control sample (DNA from a biopsy specimen of a leishmaniasis patient), a negative control (DNA from a healthy subject), and a blank (no-template control). Each sample was tested in duplicate.
Standard curves.
Genomic DNA (gDNA) of the Leishmania (V.) braziliensis strain MHOM/BR/75/M2904 served as the quantification standard for the kDNA qPCR assay. We considered 83.15 fg of leishmanial DNA equivalent to one parasite, based on the size of the sequenced L. (V.) braziliensis haploid genome (32 Mb; 70 fg for its diploid genome) (29), plus an estimated 15.8% kDNA (13.15 fg) (30). This equivalence was used for the preparation of the standard curves in the range 5 × 10⁴ to 5 × 10⁻³ parasites/reaction. The G6PD standard curves (106 to 101 copies/reaction) were based on the pGEM-T Easy vector containing the 5′ end of the G6PD gene cloned from the L. (V.) braziliensis strain MHOM/BR/75/M2903 (19). The ERV-3 standard curves were established using human gDNA (from peripheral blood mononuclear cells of a healthy donor) and comprised 2 × 10⁴ to 1.6 × 10² copies/reaction (28).
To assess the impact of background human gDNA in clinical samples on assay performance (sensitivity and amplification efficiency), standard curves based on serial dilutions of the Leishmania DNA standard in nuclease-free water were compared to the same dilution series performed in a background of 20 ng of human gDNA per reaction. Since no interference was observed, water was used to elute the leishmanial DNA used to prepare the standard curves.
Data analysis.
The “second derivative maximum” mode of the LightCycler software, v1.5.0, was used to calculate the amplification curve quantification cycle (Cq). Cq values of duplicate measurements were averaged. Replicates with a standard deviation of >0.35 in Cq values (>0.5 cycles) were retested. The “melting-curve genotyping” mode of the LightCycler software was used to generate the melting curves.
Limit of quantification, limit of detection, and expression of results.
A sample was quantified when it had a Cq value falling within the range of the standard curve. The highest dilution of template of the standard curve was defined as the limit of quantification (LOQ). Samples with Cq values higher than the LOQ could be detected; they were considered positive (qualitative detection) only if their melting curves had the same profile as those of the standards included in the same experiment.
The Leishmania load (here called PL [parasite load]) was calculated as follows: (i) [(parasite DNA equivalents/reaction estimated by kDNA qPCR)/(ERV-3 average copy number/2)] × 106 or (ii) [(G6PD average copy number/2)/(ERV-3 average copy number/2)] × 106, expressed as the number of Leishmania parasites per 106 human cells.
Statistical analyses.
Correlation analysis between the PL estimated with the kDNA qPCR and G6PD qPCR assays was conducted using the Spearman rank correlation test. The PL in CL and ML lesion biopsy specimens was comparatively analyzed using the Mann-Whitney U test. Among CL lesions, the association between the Leishmania load and the parasite species was evaluated using the Kruskal-Wallis test. The PL level was arbitrarily categorized as “low PL” (≤10,000 parasites/106 human cells) or “high PL” (>10,000 parasites/106 human cells) based on PL data distribution and then analyzed with regard to the clinical parameters studied among CL patients: the patient's age, number of lesions, duration of lesions, and total area of lesions (Mann-Whitney U test). Statistical tests were performed under a 5% significance level, using GraphPad Prism v5.02 software.
RESULTS
qPCR assays for Leishmania quantification. (i) Dynamic range of the qPCR assays.
The dynamic range of the kDNA qPCR assay encompassed at least 7 orders of magnitude (5 × 10⁴ to 5 × 10⁻³ parasite DNA equivalents/reaction). The standard curves (n = 3) were characterized by a mean square error (MSE) of ≤0.007, correlation coefficients (r2) of ≥0.995, and slopes of −3.20 (mean) ± 0.24 (standard deviation), indicating a high amplification efficiency (≥1.97) (2 would indicate 100% PCR efficiency). The standard curves of the G6PD qPCR assay (n = 3) were linear over concentrations of 106 to 101 copies/reaction, with a MSE of ≤0.005, r2 value of ≥0.993, and slopes of −3.40 ± 0.25, corresponding to an efficiency of ≥1.95 (see Fig. S1 in the supplemental material).
The sensitivity of Leishmania quantification by the kDNA -qPCR or G6PD qPCR assay was not affected by the presence of background human gDNA, since similar Cq values were obtained in the presence versus absence of background gDNA (see Fig. S1).
For each parasite concentration of the standard curve of the kDNA qPCR assay, the coefficient of variation (CV) was calculated for one run (intra-assay reproducibility) and 3 independent runs (interassay reproducibility). The highest CV values were obtained with the smallest amount of parasite DNA equivalents in both cases (Table 1). The positive control (one clinical sample) included in 4 independent runs showed a mean of 4.78 × 10³ parasites with a CV of 8.1%. Under the conditions established for each qPCR assay, no amplification of the negative-control sample or blank was detected.
Table 1.
Intra-assay and interassay reproducibility of the kDNA qPCR
| No. of parasite DNA equivalents/reaction | Intra-assay reproducibility |
Interassay reproducibility |
||||||
|---|---|---|---|---|---|---|---|---|
| Mean Cqa | No. of parasites |
Mean Cq | No. of parasites |
|||||
| Meanb | SD | % CVc | Meanb | SD | % CVc | |||
| 5.0 × 10⁴ | 7.8 | 5.2 × 10⁴ | 1.4 × 10³ | 2.7 | 8.0 | 5.1 × 10⁴ | 3.5 × 10² | 0.7 |
| 5.0 × 10³ | 11.2 | 5.3 × 10³ | 2.4 × 101 | 0.5 | 11.3 | 4.9 × 10³ | 3.0 × 10² | 6.3 |
| 5.0 × 10² | 14.6 | 4.7 × 10² | 1.1 × 101 | 2.4 | 14.5 | 5.1 × 10² | 3.5 × 101 | 6.8 |
| 5.0 × 101 | 17.9 | 4.9 × 101 | 1.4 × 100 | 2.8 | 17.8 | 4.9 × 101 | 4.2 × 10⁻¹ | 0.9 |
| 5.0 × 100 | 21.1 | 5.1 × 100 | 1.3 × 10⁻¹ | 2.5 | 21.2 | 4.6 × 100 | 7.6 × 10⁻¹ | 16.3 |
| 5.0 × 10⁻¹ | 24.4 | 5.1 × 10⁻¹ | 2.2 × 10⁻² | 4.2 | 24.6 | 4.8 × 10⁻¹ | 5.7 × 10⁻² | 11.9 |
| 5.0 × 10⁻² | 27.4 | 4.8 × 10⁻² | 2.7 × 10⁻³ | 5.6 | 28.1 | 5.4 × 10⁻² | 1.6 × 10⁻² | 29.3 |
| 5.0 × 10⁻³ | 31.2 | 5.1 × 10⁻³ | 1.9 × 10⁻³ | 36.6 | 31.6 | 5.7 × 10⁻³ | 1.3 × 10⁻³ | 23.4 |
Cq, quantification cycle.
Mean parasite number estimated by the kDNA qPCR assay with the LightCycler 480 instrument (Roche).
Coefficient of variation of the parasite number [CV = (SD/mean) × 100)]. To analyze intra-assay variation, each dilution of the standard curve was tested with 3 replicates within one LightCycler run. Interassay variation was investigated in 3 independent experimental runs.
(ii) Evaluation of variability of relative number of kDNA targets.
We analyzed the ratio of the parasite number determined by the kDNA qPCR to the parasite number determined by the G6PD qPCR (further called kDNA/G6PD ratio). First, this was done for 7 cultured strains (promastigote stage). The ratios for the 4 tested Leishmania (V.) braziliensis strains were 1.1 (MHOM/BR/75/M2904, reference strain used for quantification), 1.9 (MHOM/PE/91/LC2043), 2.5 (MHOM/BR/75/M2903), and 3.3 (MHOM/PE/93/LC2177). The ratios for the 3 tested L. (V.) guyanensis strains were 1.2 (IPRN/PE/87/Lp52), 2.6 (MHOM/PE/03/LH2549), and 3.6 (MHOM/BR/75/M4147).
Next, the kDNA/G6PD ratio was evaluated directly with clinical samples (n = 43); ratios varied from 0.1 to 3.8 among the Leishmania (Viannia)-infected cells, with the majority of samples (38/43) showing a variation in the range from 0.7 to 2 (Fig. 1A). We then analyzed if this variability could be due to the different parasite species found in the clinical samples examined. The analysis showed that the mean variability in the relative number of minicircles was not significantly different among samples positive for L. (V.) peruviana (median ratio of 0.74 [interquartile range {IQR}, 0.3 to 1.4]; n = 9), L. (V.) braziliensis (median ratio of 0.46 [IQR, 0.2 to 1.0]; n = 10), or L. (V.) guyanensis (median ratio of 0.53 [IQR, 0.4 to 1.3]; n = 15) (P = 0.47, Kruskal-Wallis test).
Fig 1.

Variability of kDNA targets in clinical samples and comparison of parasite loads estimated by the kDNA qPCR and G6PD qPCR assays. (A) Variations in kDNA minicircle numbers among Leishmania (Viannia) clinical isolates. The bars (right plot) show the ratio of kDNA to G6PD quantification results. (B) Comparison of sensitivities of the kDNA qPCR and G6PD qPCR assays for quantifying the parasite load in clinical samples. The histogram shows the distribution of the kDNA qPCR results with respect to those of G6PD qPCR (n = 87 values). (C) Correlation between parasite loads estimated by the kDNA qPCR and G6PD qPCR assays.
Application of qPCR assays with human biopsy specimens. (i) Detection of Leishmania DNA in human biopsy specimens by kDNA qPCR.
The qualitative kDNA PCR detected the presence of Leishmania DNA with 95.5% sensitivity (95% confidence interval [CI], 90.5% to 98.5%) and 100% specificity (95% CI, 76.8% to 100%), while the kDNA qPCR assay achieved this with 97.9% sensitivity (95% CI, 94.2% to 99.6%) and 87.5% specificity (95% CI, 47.4% to 99.7%) (Fig. 2). The apparently lower specificity of the kDNA qPCR compared to the qualitative PCR reflected the fact that one tested biopsy specimen was positive by the kDNA qPCR assay while testing negative with the reference standards used here. We discarded the possibility of it being a false-positive qPCR result, since another specimen (scraping) available from the same lesion had a kDNA-positive qualitative PCR result.
Fig 2.

Flow diagram of the study procedures (diagnosis, parasite load determination, and species identification) performed on lesion biopsy specimens from patients with ATL. Superscript numbers indicate the following: (1) another specimen (scraping) available from the same lesion had a kDNA-positive qualitative PCR result; (2) these samples could not be quantified because they fell out of the limit of quantification; (3) mixed pattern for L. (V.) peruviana and L. (V.) braziliensis; (4) the species could not be assigned due to a lack of recognizable patterns common to reference Leishmania strains included in the species identification algorithm used herein, or the species could not be determined because of a very low parasite load or insufficient concentration of amplifiable genomic DNA.
(ii) Quantification of Leishmania load in human biopsy specimens.
The kDNA qPCR assay allowed the quantification of the parasite load in 132 out of 148 lesion biopsy specimens with positive diagnosis of ATL (89.2%; 95% CI, 83.6% to 94.3%) (Fig. 2). The PL varied from 1.8 × 100 to 1.9 × 10⁶ parasites per 106 human cells (median = 5.3 × 10²).
To evaluate the correlation between the kDNA qPCR and G6PD qPCR assays and to assess the performance of the former assay, 101 collected CL samples were quantified in parallel by both assays. In this subset of biopsy specimens, the kDNA qPCR assay allowed the quantification of the PL in 87 samples (86.1%; 95% CI, 79.2% to 92.7%), while the G6PD qPCR assay allowed this in 43 samples (42.2%; 95% CI, 33.3% to 52.6%), indicating that the former assay is far more sensitive than the latter (P = 0.000, Z test). The PL quantified by the G6PD qPCR varied from 2.3 × 10³ to 1.5 × 10⁶ parasites per 106 human cells (median = 3.3 × 10⁴), whereas the kDNA qPCR attained lower detection limits (down to 1.8 × 100 parasites per 106 human cells) (Fig. 1B). As expected, when samples had a quantifiable Leishmania PL with both qPCR assays, the measurements were highly correlated (Spearman's rho = 0.87; P < 0.0001) (Fig. 1C).
(iii) Comparison of parasite loads according to clinical manifestations and infecting species.
The median PL in CL lesions (n = 108) was 1.0 × 10³ parasites per 106 human cells, compared to 0.9 × 10² in ML lesions (n = 21) (P = 0.009, Mann-Whitney U test) (Fig. 3A). There was no significant difference in PL according to the infecting species in CL lesions (P = 0.81, Kruskal-Wallis test) (Fig. 3B).
Fig 3.
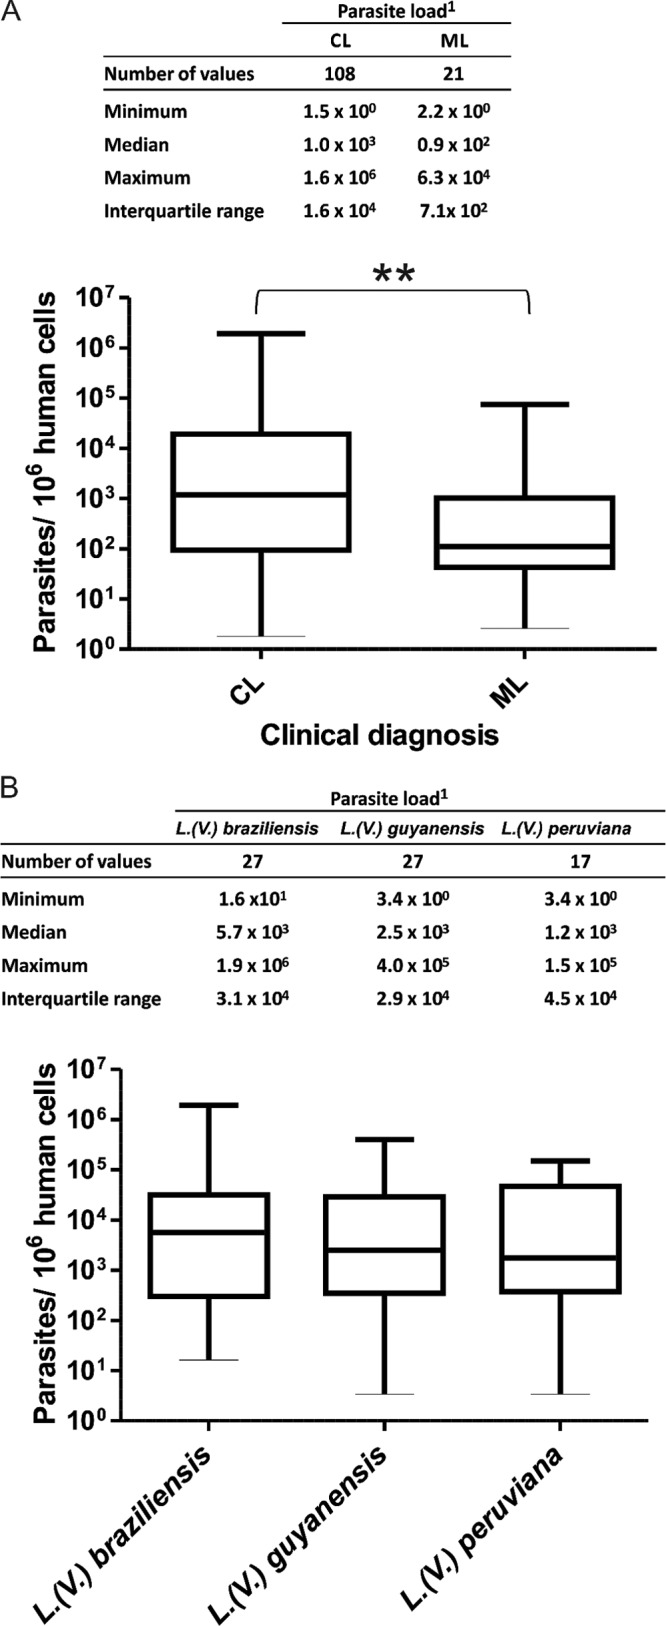
Parasite load levels in human biopsy specimens. (A) Parasite load levels in clinical samples according to clinical manifestations. **, a significant difference was found in parasite loads between cutaneous leishmaniasis (CL) and mucosal leishmaniasis (ML) lesions (P = 0.009). (B) Parasite load levels in CL lesions according to the infecting species. 1, the number of parasites per 106 human cells is indicated.
(iv) Parasite load levels according to clinical parameters in CL patients.
A “high PL” was characteristic of lesions of recent onset (median lesion duration of 64 days), whereas a “low PL” was observed in lesions with a higher evolution time (median lesion duration of 95 days) (P = 0.004, Mann-Whitney U test) (Table 2). There was no significant association between the PL level and other clinical parameters examined: the patient's age, number of lesions, or mean total area of active lesions (Table 2).
Table 2.
Clinical characteristics of CL patients and the level of parasite load
| Clinical characteristic | Value for patients with parasite load classificationb |
P valued | |
|---|---|---|---|
| Low (nc = 57) | High (nc = 28) | ||
| Age (yrs) | |||
| Mean ± SD | 31.8 ± 15.7 | 34.4 ± 14.2 | 0.362 |
| Median (IQRa) | 28.0 (20.5–39.0) | 32.5 (22.8–47.0) | |
| No. of lesions | |||
| Mean ± SD | 2.2 ± 1.8 | 3.3 ± 5.7 | 0.984 |
| Median (IQR) | 2.0 (1–3) | 1.5 (1–3) | |
| Lesion area (cm2) | |||
| Mean ± SD | 9.9 ± 9.5 | 7.3 ± 7.0 | 0.170 |
| Median (IQR) | 7.5 (3.6–13.2) | 4.8 (2.3–10.1) | |
| Duration of disease (days) | |||
| Mean ± SD | 362.1 ± 1,555.6 | 79.5 ± 63.0 | 0.004 |
| Median (IQR) | 95.0 (73.5–159.5) | 64.0 (40.5–96.0) | |
IQR, interquartile range.
The parasite load was determined by the kDNA qPCR assay and categorized as “low” (≤10,000 parasites/106 human cells) or “high” (>10,000 parasites/106 human cells).
n, no. of patients.
P values were determined by the Mann-Whitney U test.
DISCUSSION
Early evidences from histopathological studies indicate that parasite abundance in lesions from ML patients is lower than that in lesions from CL patients (31, 32). Here, the power of the kDNA qPCR assay has allowed the quantification of a broad range of parasite load levels in CL and ML tissue lesions. We confirmed that parasite levels are indeed lower in ML lesions than in CL ones: the median parasite load between these groups differed remarkably, by 10-fold. To our knowledge, this is the first qPCR study that assesses parasite load in a large sample of CL and ML lesions due to Leishmania (Viannia) species and in which the parasite load is expressed as the number of parasites normalized for a fixed number of human cell equivalents.
Notably, the scarcity of parasites in lesional tissue of Leishmania (Viannia)-infected patients, particularly in lesions from patients with ML and chronic CL, contrasts with the severe tissue damage observed in ATL. On the one hand, this suggests that Leishmania might alter local tissue homeostasis, promoting tissue damage. On the other hand, some reports show that the immune system response, rather than the parasites per se, causes ulceration and tissue destruction in ATL (33, 34).
Our finding of low parasite loads in ML lesions is consistent with the reported difficulty in visualizing Leishmania parasites in Giemsa-stained smears of lesion biopsy specimens from patients with ML (31, 32) and with the lesser success in isolating the parasites through culture of ML lesion samples than with CL (35). The differences in parasite load between CL and ML lesions could be associated with the differential immunopathological manifestations documented in ATL (36). CL is characterized by a moderate T-cell hypersensitivity, whereas ML represents the extreme expression of the T-cell hypersensitivity pole with an exacerbated Th1-type immune response. In a previous study, complex links between New World Leishmania infection and immune responses in the skin and mucosa were evidenced; for instance, the leishmanin skin test (LST) responses showed bigger induration sizes in ML than in CL, consistent with higher levels of inflammatory cytokine mRNAs found in ML (37).
Another relevant observation was that among the CL lesions analyzed here, the parasite load level was inversely correlated with disease duration. This is in line with reports documenting that the diagnosis of CL caused by Leishmania (Viannia) spp. is more challenging for lesions of greater than 6 months' duration than for lesions of more recent onset (38). Our finding is also consistent with findings of a previous study that focused on Old World CL due to Leishmania (L.) tropica (39), pointing to a high parasite load in acute cutaneous disease.
Concerning pathogenicity differences according to Leishmania species, a study performed in Brazil showed that the diseases caused by L. (V.) braziliensis and L. (V.) guyanensis are different with regard to the number, size, and location of skin lesions and the characteristics of lymphatic involvement (40). The analysis performed here revealed no significant differences in parasite load according to the infecting L. (Viannia) species or with regard to the number or size of the skin lesions. These findings suggest that the degree of clinical pathology in CL is not associated with the parasite load.
Reports of the use of qPCR assays based on repetitive sequences, like the Leishmania kDNA minicircles, to simultaneously detect and quantify the parasite load in clinical specimens have mostly focused on VL (7, 16–18). As for ATL, a few qPCR assays that amplify multicopy DNA targets have been described (20, 41, 42). In terms of diagnostic sensitivity, our kDNA qPCR assay performed similarly to the qualitative PCR test based on the same primers. The achieved analytical sensitivity for the quantification of Leishmania (Viannia), i.e., 5 × 10⁻³ parasite DNA equivalents/reaction, was the same as that of the most sensitive reported qPCR assay that also targets kDNA (20).
In order to accurately quantify parasites in clinical specimens, we investigated the variability of the relative number of kDNA targets (adjusted to the single-copy G6PD gene) in the promastigote stage (7 strains) and the amastigote stage (43 clinical samples) of L. (Viannia)-positive samples. In agreement with previous reports on Old World Leishmania (17, 20), the relative number for kDNA differed moderately (up to 4-fold) among the strains/specimens of a same L. (Viannia) species analyzed here. However, in this study, there were no statistically significant differences in the relative number of kDNA minicircle targets among the three L. (Viannia) species found in clinical samples, which indicates that there is no quantitative bias related to the parasite species. Therefore, our data suggest that quantification of L. (Viannia)-infected samples could be performed by comparison with a standard curve generated using only one reference strain DNA. Altogether, our observations support the validity of using kDNA minicircle targets to quantify Leishmania in tissues from human lesions. Absolute parasite numbers would likely be most accurate if the quantification is based on a single-copy target, but it has to be taken into account that single-copy targets present in chromosomes might be dependent on variation in ploidy, which has been shown to occur extensively in Leishmania (43, 44). Last, any amplification assay based on a single-copy target will have very low sensitivity in application for survey (e.g., follow-up of patient's response to therapy) and epidemiologic purposes.
Further work using well-documented clinical samples covering different regions of endemicity is needed to replicate the present finding of an association between the parasite load and clinical manifestations of ATL with an independent sample. The kDNA qPCR assay developed here has potential diagnostic and prognostic application value in the clinical management of ATL. Since Leishmania (Viannia) infection can still sometimes be detected after treatment (45, 46), a highly sensitive quantitative technique can be employed not only for diagnostic purposes but also for monitoring the parasite load in patients during treatment and follow-up as a way to assess or predict the outcome of therapy. Such an application of qPCR has been clearly demonstrated in VL (7, 18, 47). Last, our kDNA qPCR assay will allow evaluating the association of parasite load with the human immune response in ATL, which could be helpful in defining the prognosis of this disease.
Supplementary Material
ACKNOWLEDGMENTS
We thank Lucile Maria Floeter-Winter, Departamento de Fisiologia, Instituto de Biociências, Universidade de São Paulo, São Paulo, Brazil, for kindly providing us with the pGEM-T plasmid containing the complete sequence of the G6PD open reading frame (ORF) from the L. (Viannia) species.
This study was funded by the Belgian Directorate General for Development (third framework agreement, project 95502) and the European Commission FP7 (RAPSODI project, grant number 223341). M.J. was supported by a Fogarty scholarship through the National Institutes of Health/Fogarty International Center Global Infectious Diseases Training Grant D43TW007120 during the study period.
V.A. and J.A. conceived the study. B.M.V., D.M., and M.C. contributed to data collection and were responsible for enrolling patients. M.J., M.A., and C.C. conducted molecular analyses. J.A., I.C., G.V.D.A., J.-C.D., and A.L.-C. contributed to study design, implementation, and data interpretation. M.J. and V.A. contributed to study design, data collection, analysis, and interpretation and were primarily responsible for writing the manuscript. All authors critically appraised the manuscript.
All authors report no potential conflicts of interest.
The funders had no role in study design, data collection and analysis, decision to publish, or preparation of the manuscript.
Footnotes
Published ahead of print 3 April 2013
Supplemental material for this article may be found at http://dx.doi.org/10.1128/JCM.00208-13.
REFERENCES
- 1. McMahon-Pratt D, Alexander J. 2004. Does the Leishmania major paradigm of pathogenesis and protection hold for New World cutaneous leishmaniases or the visceral disease? Immunol. Rev. 201:206–224 [DOI] [PubMed] [Google Scholar]
- 2. Arevalo J, Ramirez L, Adaui V, Zimic M, Tulliano G, Miranda-Verastegui C, Lazo M, Loayza-Muro R, De Doncker S, Maurer A, Chappuis F, Dujardin JC, Llanos-Cuentas A. 2007. Influence of Leishmania (Viannia) species on the response to antimonial treatment in patients with American tegumentary leishmaniasis. J. Infect. Dis. 195:1846–1851 [DOI] [PubMed] [Google Scholar]
- 3. David CV, Craft N. 2009. Cutaneous and mucocutaneous leishmaniasis. Dermatol. Ther. 22:491–502 [DOI] [PubMed] [Google Scholar]
- 4. Reithinger R, Dujardin JC, Louzir H, Pirmez C, Alexander B, Brooker S. 2007. Cutaneous leishmaniasis. Lancet Infect. Dis. 7:581–596 [DOI] [PubMed] [Google Scholar]
- 5. Santrich C, Segura I, Arias AL, Saravia NG. 1990. Mucosal disease caused by Leishmania braziliensis guyanensis. Am. J. Trop. Med. Hyg. 42:51–55 [DOI] [PubMed] [Google Scholar]
- 6. Osorio LE, Castillo CM, Ochoa MT. 1998. Mucosal leishmaniasis due to Leishmania (Viannia) panamensis in Colombia: clinical characteristics. Am. J. Trop. Med. Hyg. 59:49–52 [DOI] [PubMed] [Google Scholar]
- 7. Mary C, Faraut F, Drogoul MP, Xeridat B, Schleinitz N, Cuisenier B, Dumon H. 2006. Reference values for Leishmania infantum parasitemia in different clinical presentations: quantitative polymerase chain reaction for therapeutic monitoring and patient follow-up. Am. J. Trop. Med. Hyg. 75:858–863 [PubMed] [Google Scholar]
- 8. van der Meide WF, Peekel I, van Thiel PP, Schallig HD, de Vries HJ, Zeegelaar JE, Faber WR. 2008. Treatment assessment by monitoring parasite load in skin biopsies from patients with cutaneous leishmaniasis, using quantitative nucleic acid sequence-based amplification. Clin. Exp. Dermatol. 33:394–399 [DOI] [PubMed] [Google Scholar]
- 9. Romero I, Téllez J, Suárez Y, Cardona M, Figueroa R, Zelazny A, Saravia NG. 2010. Viability and burden of Leishmania in extralesional sites during human dermal leishmaniasis. PLoS Negl. Trop. Dis. 4:e819 doi:10.1371/journal.pntd.0000819 [DOI] [PMC free article] [PubMed] [Google Scholar]
- 10. Maurya R, Mehrotra S, Prajapati VK, Nylén S, Sacks D, Sundar S. 2010. Evaluation of blood agar microtiter plates for culturing Leishmania parasites to titrate parasite burden in spleen and peripheral blood of patients with visceral leishmaniasis. J. Clin. Microbiol. 48:1932–1934 [DOI] [PMC free article] [PubMed] [Google Scholar]
- 11. Titus RG, Marchand M, Boon T, Louis JA. 1985. A limiting dilution assay for quantifying Leishmania major in tissues of infected mice. Parasite Immunol. 7:545–555 [DOI] [PubMed] [Google Scholar]
- 12. Zhang W-W, Miranda-Verastegui C, Arevalo J, Ndao M, Ward B, Llanos-Cuentas A, Matlashewski G. 2006. Development of a genetic assay to distinguish between Leishmania Viannia species on the basis of isoenzyme differences. Clin. Infect. Dis. 42:801–809 [DOI] [PubMed] [Google Scholar]
- 13. Cummings KL, Tarleton RL. 2003. Rapid quantitation of Trypanosoma cruzi in host tissue by real-time PCR. Mol. Biochem. Parasitol. 129:53–59 [DOI] [PubMed] [Google Scholar]
- 14. Lin M-H, Chen T-C, Kuo T-T, Tseng C-C, Tseng C-P. 2000. Real-time PCR for quantitative detection of Toxoplasma gondii. J. Clin. Microbiol. 38:4121–4125 [DOI] [PMC free article] [PubMed] [Google Scholar]
- 15. Kamau E, Tolbert LS, Kortepeter L, Pratt M, Nyakoe N, Muringo L, Ogutu B, Waitumbi JN, Ockenhouse CF. 2011. Development of a highly sensitive genus-specific quantitative reverse transcriptase real-time PCR assay for detection and quantitation of Plasmodium by amplifying RNA and DNA of the 18S rRNA genes. J. Clin. Microbiol. 49:2946–2953 [DOI] [PMC free article] [PubMed] [Google Scholar]
- 16. Verma S, Kumar R, Katara GK, Singh LC, Negi NS, Ramesh V, Salotra P. 2010. Quantification of parasite load in clinical samples of leishmaniasis patients: IL-10 level correlates with parasite load in visceral leishmaniasis. PLoS One 5:e10107 doi:10.1371/journal.pone.0010107 [DOI] [PMC free article] [PubMed] [Google Scholar]
- 17. Mary C, Faraut F, Lascombe L, Dumon H. 2004. Quantification of Leishmania infantum DNA by a real-time PCR assay with high sensitivity. J. Clin. Microbiol. 42:5249–5255 [DOI] [PMC free article] [PubMed] [Google Scholar]
- 18. Sudarshan M, Weirather JL, Wilson ME, Sundar S. 2011. Study of parasite kinetics with antileishmanial drugs using real-time quantitative PCR in Indian visceral leishmaniasis. J. Antimicrob. Chemother. 66:1751–1755 [DOI] [PMC free article] [PubMed] [Google Scholar]
- 19. Castilho TM, Camargo LM, McMahon-Pratt D, Shaw JJ, Floeter-Winter LM. 2008. A real-time polymerase chain reaction assay for the identification and quantification of American Leishmania species on the basis of glucose-6-phosphate dehydrogenase. Am. J. Trop. Med. Hyg. 78:122–132 [PubMed] [Google Scholar]
- 20. Weirather JL, Jeronimo SM, Gautam S, Sundar S, Kang M, Kurtz MA, Haque R, Schriefer A, Talhari S, Carvalho EM, Donelson JE, Wilson ME. 2011. Serial quantitative PCR assay for detection, species-discrimination and quantification of Leishmania spp. in human samples. J. Clin. Microbiol. 49:3892–3904 [DOI] [PMC free article] [PubMed] [Google Scholar]
- 21. Pita-Pereira D, Lins R, Oliveira MP, Lima RB, Pereira BA, Moreira OC, Brazil RP, Britto C. 2012. SYBR green-based real-time PCR targeting kinetoplast DNA can be used to discriminate between the main etiologic agents of Brazilian cutaneous and visceral leishmaniases. Parasit. Vectors 5:15 doi:10.1186/1756-3305-5-15 [DOI] [PMC free article] [PubMed] [Google Scholar]
- 22. Tobie EJ, von-Brand T, Mehlman B. 2001. Cultural and physiological observations on Trypanosoma rhodesiense and Trypanosoma gambiense. 1949. J. Parasitol. 87:714–717 [DOI] [PubMed] [Google Scholar]
- 23. Bossuyt PM, Reitsma JB, Bruns DE, Gatsonis CA, Glasziou PP, Irwig LM, Moher D, Rennie D, de Vet HC, Lijmer JG. 2003. The STARD statement for reporting studies of diagnostic accuracy: explanation and elaboration. Clin. Chem. 49:7–18 [DOI] [PubMed] [Google Scholar]
- 24. Lopez M, Inga R, Cangalaya M, Echevarria J, Llanos-Cuentas A, Orrego C, Arevalo J. 1993. Diagnosis of Leishmania using the polymerase chain reaction: a simplified procedure for field work. Am. J. Trop. Med. Hyg. 49:348–356 [DOI] [PubMed] [Google Scholar]
- 25. Boggild AK, Valencia BM, Espinosa D, Veland N, Ramos AP, Arevalo J, Llanos-Cuentas A, Low DE. 2010. Detection and species identification of Leishmania DNA from filter paper lesion impressions for patients with American cutaneous leishmaniasis. Clin. Infect. Dis. 50:e1–e6 doi:10.1086/648730 [DOI] [PubMed] [Google Scholar]
- 26. Veland N, Boggild AK, Valencia C, Valencia BM, Llanos-Cuentas A, Van der Auwera G, Dujardin JC, Arevalo J. 2012. Leishmania (Viannia) species identification on clinical samples from cutaneous leishmaniasis patients in Peru: assessment of a molecular stepwise approach. J. Clin. Microbiol. 50:495–498 [DOI] [PMC free article] [PubMed] [Google Scholar]
- 27. Yuan CC, Miley W, Waters D. 2001. A quantification of human cells using an ERV-3 real time PCR assay. J. Virol. Methods 91:109–117 [DOI] [PubMed] [Google Scholar]
- 28. Adaui V, Verdonck K, Best I, González E, Tipismana M, Arévalo J, Vanham G, Campos M, Zimic M, Gotuzzo E. 2006. SYBR green-based quantitation of human T-lymphotropic virus type 1 proviral load in Peruvian patients with neurological disease and asymptomatic carriers: influence of clinical status, sex, and familial relatedness. J. Neurovirol. 12:456–465 [DOI] [PubMed] [Google Scholar]
- 29. Peacock CS, Seeger K, Harris D, Murphy L, Ruiz JC, Quail MA, Peters N, Adlem E, Tivey A, Aslett M, Kerhornou A, Ivens A, Fraser A, Rajandream MA, Carver T, Norbertczak H, Chillingworth T, Hance Z, Jagels K, Moule S, Ormond D, Rutter S, Squares R, Whitehead S, Rabbinowitsch E, Arrowsmith C, White B, Thurston S, Bringaud F, Baldauf SL, Faulconbridge A, Jeffares D, Depledge DP, Oyola SO, Hilley JD, Brito LO, Tosi LR, Barrell B, Cruz AK, Mottram JC, Smith DF, Berriman M. 2007. Comparative genomic analysis of three Leishmania species that cause diverse human disease. Nat. Genet. 39:839–847 [DOI] [PMC free article] [PubMed] [Google Scholar]
- 30. Shapiro TA, Englund PT. 1995. The structure and replication of kinetoplast DNA. Annu. Rev. Microbiol. 49:117–143 [DOI] [PubMed] [Google Scholar]
- 31. Gutierrez Y, Salinas GH, Palma G, Valderrama LB, Santrich CV, Saravia NG. 1991. Correlation between histopathology, immune response, clinical presentation, and evolution in Leishmania braziliensis infection. Am. J. Trop. Med. Hyg. 45:281–289 [DOI] [PubMed] [Google Scholar]
- 32. Azogue E. 1983. Diagnóstico histopatológico de la leishmaniasis cutánea y cutáneo-mucosa en Bolivia. Mem. Inst. Oswaldo Cruz 78:13–20 [PubMed] [Google Scholar]
- 33. Nylén S, Eidsmo L. 2012. Tissue damage and immunity in cutaneous leishmaniasis. Parasite Immunol. 34:551–561 [DOI] [PubMed] [Google Scholar]
- 34. Carvalho LP, Passos S, Schriefer A, Carvalho EM. 2012. Protective and pathologic immune responses in human tegumentary leishmaniasis. Front. Immunol. 3:301 doi:10.3389/fimmu.2012.00301 [DOI] [PMC free article] [PubMed] [Google Scholar]
- 35. Barral A, Almeida RP, de Jesus AR, Medeiros Neto E, Santos IA, Johnson W., Jr 1987. The relevance of characterizing Leishmania from cutaneous lesions. A simple approach for isolation. Mem. Inst. Oswaldo Cruz 82:579. [DOI] [PubMed] [Google Scholar]
- 36. Silveira FT, Lainson R, De Castro Gomes CM, Laurenti MD, Corbett CE. 2009. Immunopathogenic competences of Leishmania (V.) braziliensis and L. (L.) amazonensis in American cutaneous leishmaniasis. Parasite Immunol. 31:423–431 [DOI] [PubMed] [Google Scholar]
- 37. Maurer-Cecchini A, Decuypere S, Chappuis F, Alexandrenne C, De Doncker S, Boelaert M, Dujardin JC, Loutan L, Dayer JM, Tulliano G, Arevalo J, Llanos-Cuentas A, Chizzolini C. 2009. Immunological determinants of clinical outcome in Peruvian patients with tegumentary leishmaniasis treated with pentavalent antimonials. Infect. Immun. 77:2022–2029 [DOI] [PMC free article] [PubMed] [Google Scholar]
- 38. Weigle KA, Labrada LA, Lozano C, Santrich C, Barker DC. 2002. PCR-based diagnosis of acute and chronic cutaneous leishmaniasis caused by Leishmania (Viannia). J. Clin. Microbiol. 40:601–606 [DOI] [PMC free article] [PubMed] [Google Scholar]
- 39. Kumar R, Bumb RA, Salotra P. 2009. Correlation of parasitic load with interleukin-4 response in patients with cutaneous leishmaniasis due to Leishmania tropica. FEMS Immunol. Med. Microbiol. 57:239–246 [DOI] [PubMed] [Google Scholar]
- 40. Romero GA, Vinitius de Farias Guerra M, Gomes Paes M, de Oliveira Macêdo V. 2001. Comparison of cutaneous leishmaniasis due to Leishmania (Viannia) braziliensis and L. (V.) guyanensis in Brazil: clinical findings and diagnostic approach. Clin. Infect. Dis. 32:1304–1312 [DOI] [PubMed] [Google Scholar]
- 41. Schulz A, Mellenthin K, Schönian G, Fleischer B, Drosten C. 2003. Detection, differentiation, and quantitation of pathogenic Leishmania organisms by a fluorescence resonance energy transfer-based real-time PCR assay. J. Clin. Microbiol. 41:1529–1535 [DOI] [PMC free article] [PubMed] [Google Scholar]
- 42. Tupperwar N, Vineeth V, Rath S, Vaidya T. 2008. Development of a real-time polymerase chain reaction assay for the quantification of Leishmania species and the monitoring of systemic distribution of the pathogen. Diagn. Microbiol. Infect. Dis. 61:23–30 [DOI] [PubMed] [Google Scholar]
- 43. Downing T, Imamura H, Decuypere S, Clark TG, Coombs GH, Cotton JA, Hilley JD, De Doncker S, Maes I, Mottram JC, Quail MA, Rijal S, Sanders M, Schönian G, Stark O, Sundar S, Vanaerschot M, Hertz-Fowler C, Dujardin JC, Berriman M. 2011. Whole genome sequencing of multiple Leishmania donovani clinical isolates provides insights into population structure and mechanisms of drug resistance. Genome Res. 21:2143–2156 [DOI] [PMC free article] [PubMed] [Google Scholar]
- 44. Sterkers Y, Lachaud L, Crobu L, Bastien P, Pagès M. 2011. FISH analysis reveals aneuploidy and continual generation of chromosomal mosaicism in Leishmania major. Cell Microbiol. 13:274–283 [DOI] [PubMed] [Google Scholar]
- 45. de Oliveira Camera P, Junger J, do Espírito Santo Silva Pires F, Mattos M, Oliveira-Neto MP, Fernandes O, Pirmez C. 2006. Haematogenous dissemination of Leishmania (Viannia) braziliensis in human American tegumentary leishmaniasis. Trans. R. Soc. Trop. Med. Hyg. 100:1112–1117 [DOI] [PubMed] [Google Scholar]
- 46. Vergel C, Palacios R, Cadena H, Posso CJ, Valderrama L, Perez M, Walker J, Travi BL, Saravia NG. 2006. Evidence for Leishmania (Viannia) parasites in the skin and blood of patients before and after treatment. J. Infect. Dis. 194:503–511 [DOI] [PubMed] [Google Scholar]
- 47. Disch J, Oliveira MC, Orsini M, Rabello A. 2004. Rapid clearance of circulating Leishmania kinetoplast DNA after treatment of visceral leishmaniasis. Acta Trop. 92:279–283 [DOI] [PubMed] [Google Scholar]
Associated Data
This section collects any data citations, data availability statements, or supplementary materials included in this article.