

Abstract
Pseudomonas aeruginosa pneumonia remains a difficult therapeutic problem. Optimal doses and modes of administration of single agents often do not result in acceptable outcomes. Further, emergence of resistance occurs frequently in this setting with single-agent chemotherapy. The purpose of these experiments was to evaluate combination chemotherapy with meropenem plus tobramycin for P. aeruginosa in a murine pneumonia model. Neutropenia was induced by cyclophosphamide. Pharmacokinetics of meropenem and tobramycin were determined using a population pharmacokinetic approach. Both drugs were given at 4-h intervals. Meropenem was administered as total daily doses of 30 to 600 mg/kg of body weight, while tobramycin doses ranged from 50 to 400 mg/kg. Combination therapy evaluated all combinations of 50, 100, and 150 mg/kg/day of tobramycin doses with 60 or 300 mg/kg/day of meropenem. Total and drug-resistant organisms were enumerated. Meropenem alone had a near-maximal effect at 60 mg/kg/day (3.18 log10 [CFU/g] kill from stasis). The time > MIC in epithelial lining fluid (ELF) at this dose was 35.25% of 24 h. For tobramycin alone, the near-maximal effect was at 150 mg/kg/day and the area under the concentration-time curve over 24 h in the steady state divided by the MIC (AUC/MIC ratio) in ELF was 240.3. Resistance suppression occurred at an ELF AUC/MIC ratio of 110.6. For combination therapy, the near-maximal effect was reached at 60 mg/kg/day and 50 mg/kg/day of meropenem and tobramycin, which produced a 35.25% time > MIC in ELF and an ELF AUC/MIC ratio of 80.1. The interaction was additive. All combination regimens suppressed resistance. Combination therapy produced additive drug interaction and suppressed all resistance amplification. It is likely that optimal therapy for Pseudomonas aeruginosa pneumonia will involve a combination of agents.
INTRODUCTION
The therapy to treat nosocomial pneumonia due to Pseudomonas aeruginosa is one of our greatest therapeutic challenges. Meropenem is arguably one of the best single agents available for this infection. In a previous set of publications (1, 2), we demonstrated that even this agent, when used at a maximal licensed dose and with a prolonged infusion, was still able to obtain the exposure target in epithelial lining fluid (ELF) predicted to produce a 3 log10 (CFU/g) reduction in bacterial burden (49% time > MIC in ELF) only about 65% of the time. Obviously, we would like our patients to have a higher likelihood of attaining a major bacterial kill in this difficult-to-treat infection.
We had also previously performed an in vitro checkerboard evaluation of the combination of meropenem plus tobramycin against this same isolate of Pseudomonas aeruginosa (3). This evaluation demonstrated that meropenem and tobramycin interacted additively with respect to bacterial kill. We were also able to demonstrate that a major factor unaccounted for in traditional evaluations of synergy/additivity/antagonism is the presence of resistant subpopulations of organisms a priori.
We decided, therefore, to evaluate the interaction of meropenem plus tobramycin in an in vivo setting. We have previously evaluated both meropenem (1) and levofloxacin (4) in a murine model of Pseudomonas aeruginosa pneumonia. We employed this same model to examine the impact of single-drug therapy with meropenem or tobramycin as well as the impact of combination therapy. We wished to be able to validate the evaluation of drug interaction for bacterial kill that we had performed previously (3) as well as identify drug exposures that resulted in suppression of resistance.
MATERIALS AND METHODS
Microorganism.
Pseudomonas aeruginosa strain PAO1 was a kind gift of Vincent Tam. The MIC determination was by CLSI macrobroth methodology for meropenem and tobramycin (5).
PK studies.
To correlate the doses of drug administered to mice with measures of exposure, pharmacokinetic (PK) studies were conducted in a separate cohort of mice with Pseudomonas aeruginosa pneumonia. For meropenem, we employed pharmacokinetic data previously published (1). For tobramycin, we administered the drug on a humanized dosing scheme administered on an every-4-h basis. The humanization scheme was derived from earlier single-dose pharmacokinetic studies performed with tobramycin (data not shown). The fraction of the total daily (mg/kg of body weight) dose at each injection was 33.33% at 0 h, 16.65% at h 4, 8, and 12, and 8.37% at h 16 and 20. Dosing times were chosen to be concordant with meropenem dosing times. Tobramycin total daily doses of 100, 150, 214, and 400 mg/kg/day were evaluated. Briefly, neutropenic mice were infected with P. aeruginosa via the intranasal route. Five hours later, the humanized regimens for the four total daily doses of tobramycin were administered to different cohorts of mice. Plasma and bronchoalveolar fluid were collected from three sacrificed mice per time point (and dosage) at 19 time points over the 24-h PK study. Plasma and bronchoalveolar lavage (BAL) fluid were stored at −80°C until they were assayed for drug content by liquid chromatography (LC) and dual mass spectrometry (MS-MS) (LC/MS-MS). The prediluted concentration of antibiotic in the BAL fluid (epithelial lining fluid or ELF) was calculated by comparing the ratio of the amounts of urea measured in simultaneously collected plasma and BAL fluid.
Murine pneumonia model.
The model and detailed methods have been previously described (1, 4). All animal experimentation was approved by the local institutional animal care and use committee (IACUC). A mouse pneumonia model previously described (1, 4) was used. Female, 24- to 26-g, outbred Swiss-Webster mice (Taconic Farms, Taconic, NY) were provided water and food ad libitum. Mice were rendered transiently neutropenic with cyclophosphamide at 150 mg/kg of body weight given intraperitoneally (i.p.) 4 days prior to infection plus 100 mg/kg given i.p. 1 day before infection. Anesthetized mice were infected via the intranasal route with a 20-μl volume using 2 × 10⁷ CFU of P. aeruginosa. The bacterial inoculum was confirmed by quantitative cultures. Five hours after bacterial inoculation, and just prior to therapy initiation, five mice were sacrificed for baseline quantitative cultures of lung homogenates. Fifteen animal cohorts were administered meropenem or tobramycin alone or in combination. Meropenem as monotherapy was given i.p. at doses of 30, 50, 300, and 600 mg/kg/day for meropenem. Tobramycin as monotherapy was given i.p. at 50, 100, 150, 214, and 400 mg/kg/day. Combination therapy consisted of 60 or 300 mg/kg/day of meropenem together with 50, 100, or 150 mg/kg/day of tobramycin. All agents were administered every 4 h. There was also an untreated control group (cohort 16). Twenty-four hours after treatment initiation, all mice were humanely euthanized and lungs were aseptically collected. The tissues were homogenized and washed with normal saline solution to prevent drug carryover. Homogenates were then quantitatively cultured onto drug-free agar to characterize the effect of each regimen on the total bacterial population. For groups that were treated with meropenem or tobramycin as a single agent, the homogenates were also quantitatively cultured on media supplemented with 3× the baseline MIC of the respective antibiotic to define the extent to which the regimens selected for the antibiotic-resistant subpopulation (virtually all Pseudomonas resistance mechanisms [efflux pump overexpression, ampC stable derepression, oprD downregulation, electron transport chain mutation] change the MIC by 4-fold or greater; a 3-fold-increased volume is sufficient to avoid confounding variance from the 2-fold error in the test). For mice that were treated with both meropenem and tobramycin, the tissue homogenates were quantitatively cultured and also plated on agar supplemented with 3× the MIC of meropenem and a separate set of agar preparations supplemented with 3× the MIC of tobramycin. After incubation of the plates at 35°C for 48 h, colonies were enumerated. Means and standard deviations for the quantitative culture samples were calculated.
Meropenem, tobramycin, and urea assays.
Mouse plasma samples (0.050 ml) were deproteinated with acetonitrile (0.150 ml). The samples were centrifuged, and an aliquot of the supernatant (0.050 ml) was transferred into an appropriately labeled autosampler vial containing 1.00 ml of high-pressure liquid chromatography (HPLC)-grade water. Samples were analyzed by high-pressure liquid chromatography–tandem mass spectrometry for meropenem and tobramycin concentrations.
Mouse BAL fluid samples (0.050 ml) were diluted with 0.100 ml of HPLC-grade water and were also analyzed by high-pressure liquid chromatography–tandem mass spectrometry for meropenem and tobramycin concentration determinations. The LC/MS-MS system was comprised of a Shimadzu Prominence HPLC system and an Applied Biosystems/MDS Sciex API5000 LC/MS-MS system.
Population PK modeling approach.
Performed as presented above, the approach has been described previously (1). For the population modeling approach, the ELF was its own sampling compartment with its own apparent volume of distribution. It required eight parameters, three differential equations, and two system outputs (drug concentration in plasma and drug concentration in ELF) to define this system as follows:
The plasma concentration equals X2/(Vc/F), and the ELF concentration equals X3/VELF.
The BigNPAG program described previously by Leary et al. (6) was employed for all population modeling. The weighting employed was the inverse of the observation variance. Bayesian estimates were obtained for each mouse using the “population-of-one” utility in BigNPAG. Model evaluation was performed by predicted-observed plots. The mean error served as the measure of bias. The bias-adjusted mean squared error served as the measure of precision. Because only single plasma and ELF measurements were available for any animal, the Adaptive γ feature for weighting was not employed.
Simulation.
We employed the ADAPT V package of programs described previously by D'Argenio et al. (7) for simple simulation for the tobramycin concentration-time profile in plasma and ELF. The mean parameter vector was used for simulation. The previously described meropenem data were used in the same way (1).
RESULTS
MIC of meropenem and tobramycin for Pseudomonas aeruginosa PAO1.
On three to six different occasions, broth macrodilution was performed; the MIC of meropenem for the Pseudomonas aeruginosa strain ranged from 0.5 to 1.0 mg/liter and that for tobramycin was 1.0 mg/liter.
Fit of the model to all the humanized tobramycin pharmacokinetic data simultaneously.
The model fit the data acceptably well. For the post-Bayesian step, the regression equations and measurements of bias (mean weighted error) and precision (bias-adjusted mean weighted squared error) for tobramycin produced the following data. For plasma, the observed value was 0.881 × the predicted value + 6.0 (r2 = 0.796; P ≪ 0.001), the mean weighted error was −0.782, and the bias-adjusted mean weighted squared error was 16.89. For ELF, the observed value was 0.959 × the predicted value + 8.766 (r2 = 0.871; p ≪ 0.001), the mean weighted error was −0.368, and the bias-adjusted mean weighted squared error as 1.312. The mean parameter estimates and their standard deviations are displayed in Table 1. These values were employed to generate estimates for ELF penetration and for the area under the concentration-time curve over 24 h in the steady state divided by the MIC (AUC/MIC ratio) in ELF for maximum cell kill in combination therapy as well as the ELF AUC/MIC for suppression of resistance. The mean value for ELF penetration (50 mg/kg dose) was 80.1%. The AUC/MIC targets are displayed below.
Table 1.
Mean and standard deviation pharmacokinetic parameter values for tobramycin identified from a humanized drug administration in a murine model of Pseudomonas aeruginosa pneumonia
| Parameters | Vc | CL | K23 | K32 | K24 | K42 | VELF | Ka |
|---|---|---|---|---|---|---|---|---|
| Unit | Liters | Liters/h | h−1 | h−1 | h−1 | h−1 | Liters | h−1 |
| Mean | 0.0024 | 0.0063 | 12.4 | 12.1 | 15.4 | 8.04 | 0.0056 | 12.85 |
| SD | 0.0024 | 0.0023 | 5.60 | 4.03 | 5.39 | 2.14 | 0.0040 | 7.94 |
Vc, volume of the central compartment; CL, clearance; K23, K32, K24, and K42, first-order intercompartmental rate constants; VELF = volume of the epithelial lining fluid compartment; Ka, first-order absorption rate constant.
Effects of meropenem and tobramycin alone and in combination on the total bacterial burden and in suppressing the resistant subpopulation in mice with Pseudomonas aeruginosa pneumonia. (i) Meropenem alone.
In Fig. 1, we show the effects of differing doses of meropenem on the killing of P. aeruginosa in the lungs of mice. The total daily doses were all administered in a fractionated manner on a 4-h dosing schedule. It is plain by inspection of the data that the near-maximal cell kill was achieved by a total daily dose of 60 mg/kg of meropenem. Using the parameter values from our previous publication, penetration into ELF was approximately 40% and the time > MIC (1.0 mg/liter) in ELF was 8.46 of 24 h or 35.25%. The bacterial kill attained with this dosage of meropenem was 3.18 log10 (CFU/g) of lung tissue (calculated from stasis).
Fig 1.
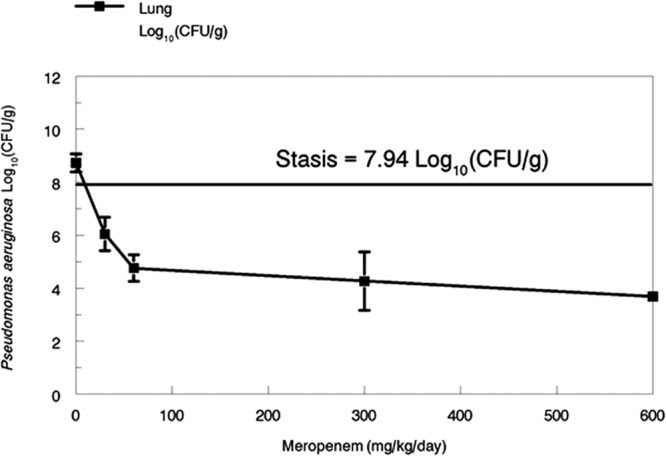
Pseudomonas aeruginosa cell kill in murine lung as driven by differing daily doses of meropenem. Daily doses were fractionated on a 4-h dosing schedule.
(ii) Tobramycin alone.
Examination of Fig. 2 shows that, in contradistinction to the meropenem results, a subpopulation of tobramycin-resistant organisms was present a priori in the site of infection. Near-maximal killing of the wild-type bacteria occurred at approximately 150 mg/kg/day, and resistance suppression occurred with a dose of approximately 69 mg/kg/day, where resistance suppression is defined as the dosage of the antibiotic which reduces the resistant bacterial subpopulation to the concentration measured in the infection site of the untreated control group at baseline. These dosages of tobramycin translate to AUC/MIC ratios in ELF of 240.3 and 110.6, respectively. The near-maximal-effect dose of tobramycin produced a kill of 3.69 log10 (CFU/g) relative to the stasis value. The 50 mg/kg/day dose of tobramycin, which worked maximally in combination with meropenem, produced a kill of 0.63 log10 (CFU/g), with an AUC/MIC target value of 80.1 in ELF. Target AUC/MIC values were derived from the mean parameter vector.
Fig 2.
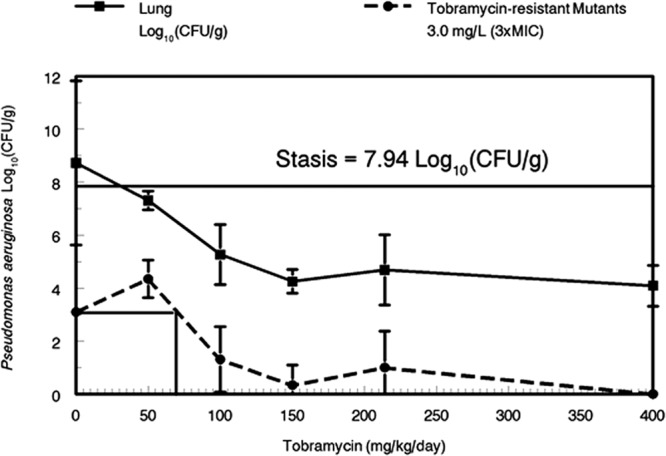
Pseudomonas aeruginosa bacterial cell kill in murine lung as driven by differing daily doses of tobramycin. Daily doses were administered using a humanized dosing scheme (See Materials and Methods for details).
(iii) Combination chemotherapy.
Fig. 3 and Fig. 4 show the 3-dimensional plots of meropenem and tobramycin administered both alone and in combination. The lowest doses of both drugs in combination (60 and 50 mg/kg/day for meropenem and tobramycin, respectively) produced near-maximal effect (i.e., bacterial cell kill). With combination therapy, no resistant organisms were recovered on either meropenem- or tobramycin-containing agar plates. This is in contradistinction to the results seen with tobramycin alone, where a considerable number of resistant isolates were recovered. With respect to resistance suppression, meropenem and tobramycin interacted in a positive manner.
Fig 3.
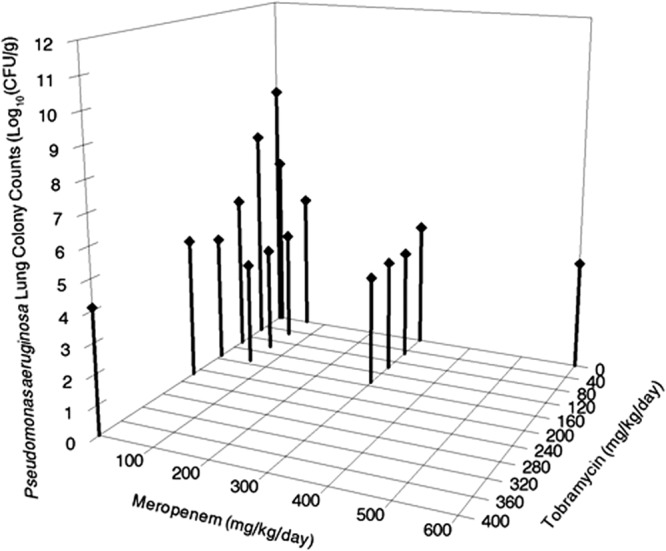
Pseudomonas aeruginosa cell kill in murine lung as driven by differing daily doses of meropenem in combination with tobramycin. Daily doses were fractionated on a 4-h dosing schedule for meropenem and on a humanized schedule for tobramycin (See Materials and Methods for details).
Fig 4.
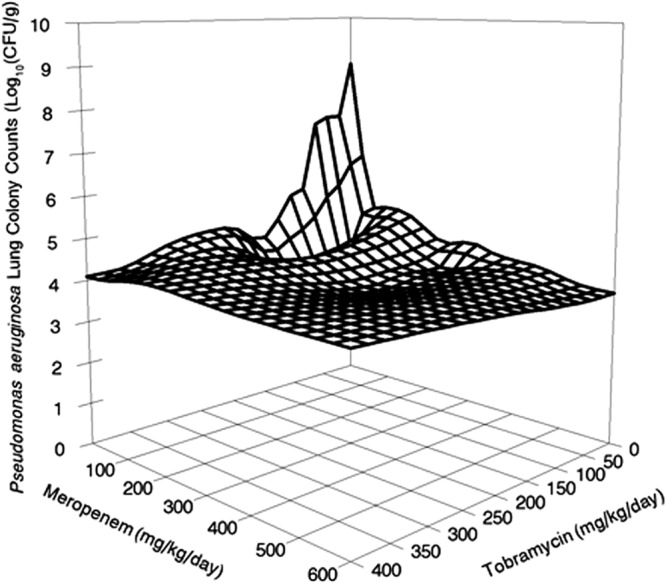
Data were determined as described for Fig. 3, but the graph is a wire mesh graph to best display the slope of the cell kill.
With regard to the killing of the wild-type bacterial population, greater killing was observed with the coadministerion of 60 mg/kg/day of meropenem and 50 mg/kg/day of tobramycin than with the same dose of either drug alone. The combination of these doses of meropenem and tobramycin produced 4.98 log10 (CFU/g) of killing (4.19 log10 [CFU/g] if calculated from stasis), while meropenem alone at 60 mg/kg/day yielded 3.97 log10 (CFU/g) of kill (3.18 log10 [CFU/g] calculated from stasis) and tobramycin alone at 50 mg/kg/day yielded 1.42 log10 (CFU/g) of kill (0.63 log10 [CFU/g] calculated from stasis). When the 95% confidence interval is calculated about the point estimate around the combined therapy cell kill, it includes the calculation for the cell kill for the definition of Loewe additivity (8) when both single-agent cell kill rates are combined. Therefore, the interaction between meropenem and tobramycin was additive for the killing of this strain of Pseudomonas aeruginosa, where the bacterial burden was such that there were preexistent resistant mutants in the population at baseline. The combination also completely suppressed amplification of the tobramycin-resistant population present at baseline.
DISCUSSION
Pneumonia caused by Gram-negative organisms continues to be a vexing clinical problem. Chastre and colleagues (9) have demonstrated that nonfermenting Gram-negative bacilli require longer durations of therapy than other Gram-negative organisms. Emergence of resistance, especially for Pseudomonas aeruginosa, has been demonstrated to be a major problem in patients with nosocomial pneumonia. In a study published by Fink and colleagues (10), in which ciprofloxacin administered at the maximal approved dose of 400 mg every 8 h was compared to imipenem (administered at either 500 mg every 6 h or 1 g every 8 h), resistance rates for Pseudomonas aeruginosa were approximately 33% for ciprofloxacin and 50% for imipenem. Optimal results for Pseudomonas aeruginosa pneumonia are unlikely to be obtained with any single agent, particularly if one considers emergence of resistance as a negative outcome.
In order for a good clinical outcome to be attained, sufficient bacterial cell kill is an important endpoint. The ability to attain sufficient cell kill interacts with resistance emergence, as multilog cell kill rates often suppress resistance emergence. A large enough (circa 3 log10 [CFU/g]) reduction in total bacterial burden often (but not always) results in enough antimicrobial activity to suppress amplification of a preexistent, less-susceptible bacterial population and also to suppress activation of new resistance mechanisms (e.g., efflux pump overexpression). When it does not, we see an initial decline in total population burden followed by regrowth.
The other important issue with regard to cell kill is the baseline bacterial burden. In this evaluation, the bacterial burden was substantial, being approximately 8 log10 (CFU/g) at the time of initiation of therapy. In hospital-acquired bacterial pneumonia (HABP) and ventilator-associated bacterial pneumonia (VABP), bacterial burdens are often very large. The minimal quantitative burden to meet the definition of pneumonia after a bronchoalveolar lavage procedure is 104 CFU/ml. In performing urea corrections for dilution (2), the actual amount of dilution is in the range of 30- to 100-fold (1.5 to 2.0 log). Consequently, the minimal burden is really circa 5.5 to 6.0 log10 (CFU/ml). The range of bacterial burden can then be 2 to 3 log higher than this value in a substantial number of patients.
The size of the burden is of importance to treatment outcomes. Our laboratory has demonstrated that granulocytes in mice can kill substantial amounts of Pseudomonas aeruginosa without antibiotic therapy if the bacterial density is less than 6 log CFU/g of lung tissue (11, 12). An important observation was that granulocyte kill was saturable. P. aeruginosa burdens above 6 log CFU/g of lung tissue result in progressive growth of the bacteria in the lungs of mice that are not treated with antibiotics. Consequently, our previous studies in immune normal mice suggest that for patients with severe pneumonia due to a high bacterial burden in the lungs, the antimicrobial chemotherapy needs to produce a multilog decline of the bacterial density to below 6 log CFU/g in the lungs as well as suppress resistance amplification to allow the granulocytes to achieve optimal cell kill.
In this evaluation, meropenem and tobramycin were studied alone and in combination. We have previously evaluated meropenem alone in this mouse pneumonia model (1). While meropenem is an excellent therapeutic agent, a maximal clinical dose (2 g administered intravenously [i.v.] every 8 h as a 3-h prolonged infusion) was given to patients with VABP (2). Pharmacokinetic modeling linked with Monte Carlo simulation demonstrated that ELF concentrations in humans attained the target time > MIC (1) associated with the 2 log kill/resistance and 3 log kill/resistance suppression targets identified in the mouse (32% and 49% time > MIC in ELF) approximately 65% and 76% of the time, respectively. Consequently, we concluded that a second agent was called for.
We have also previously studied the combination of meropenem plus tobramycin in vitro in a checkerboard evaluation (3). The drugs interacted in a positive way for resistance suppression. Cell kill was evaluated with a method that deviated from a Loewe additivity reference model (8). The evaluation demonstrated additivity for cell kill.
In this animal system evaluation, both meropenem and tobramycin were able to engender multilog kills at the doses evaluated. In this experiment, there were no meropenem-resistant organisms recovered from drug-containing plates. The cell kill was substantial. At 60 mg/kg/day, the kill approximated 3 to 4 log (total or relative to stasis). Giving 10 times as much drug (600 mg/kg/day) increased the kill but only by about an extra 1 log. The effect seen with this dose was minimally greater than seen previously (1). This is because there was not a meropenem-resistant subpopulation present at the initiation of therapy. It is easier to kill a pure fully susceptible population, as we have previously published (13).
Tobramycin required substantially more drug to attain multilog kill. The drug penetrated reasonably well into ELF at 80% of the plasma AUC value. Maximal cell kill was attained at 150 mg/kg/day. It should be noted that the drug was administered in a highly fractionated fashion with a decrementing dose with each administration, so that the result was a concentration-time profile that was “humanized.”
In contrast to meropenem, there was a substantial preexistent tobramycin-resistant population, with the no-treatment control having 1 resistant isolate per 5.63 log10 (CFU/g) at 24 h. At the initiation of therapy (0 h), this ratio was 1 resistant isolate per 5.88 log10 (CFU/g). The relatively large resistant population is the likely explanation for the requirement for substantially more tobramycin to generate multilog kill. The resistant subpopulation was held in check (stasis) at a tobramycin dose of approximately 69 mg/kg/day.
Combination therapy was clearly beneficial. Using 60 mg/kg/day of meropenem plus 50 mg/kg/day of tobramycin completely eradicated the tobramycin-resistant subpopulation, an outcome that required 400 mg/kg/day of tobramycin when administered as a single agent.
Cell kill was documented to be additive. The combination cell kill was greater than the cell kill of either agent alone at the same dose. However, the combination-therapy cell kill 95% confidence interval included the direct sum of the kills of the two drugs alone, which is the definition of Loewe additivity (8). This in vivo experiment led to the same conclusion as the previous in vitro experiment (3) in that meropenem and tobramycin interact additively when the bacterial burden is high enough to include resistant organisms at baseline.
Greco's laboratory identified that sometimes the application of the so-called Universal Response Surface Approach (URSA) resulted in a so-called “mosaic” surface in which areas of the plot were all either above or below the fitted surface resulting from the Greco model (14). This is because of the presence of preexistent resistant subpopulations. When the drug exposures are able to suppress these populations, the resultant bacterial cell kills are under the fitted surface (better than predicted). Conversely, when the exposures allow incomplete suppression (or even amplification), then the cell kills are above the surface (less effect than predicted). Because of this, we are pursuing a fully parametric mixture model to be able to delineate the effect of the combination on each of the populations (fully susceptible and less so).
Finally, based on the results of this study, we strongly believe that, to have the highest probability of attaining optimal organism kill and to suppress resistance, combination chemotherapy is required. Even excellent single agents, because of variability in effect site penetration (1), are not able to attain the requisite exposures that adequately bring the bacterial burden to a low enough level that granulocytes can also kill optimally as well as suppress resistant subpopulation amplification for an acceptable proportion of the population. Combinations at optimal doses and schedules are likely our best route forward to attain these goals. This hypothesis is currently being tested in a multicenter international trial of combination therapy for treatment of Gram-negative ventilator-associated pneumonia, funded by the National Institute for Allergy and Infectious Diseases, in which the primary endpoint is suppression of resistance for Pseudomonas aeruginosa and Acinetobacter spp. In this way, the clinical data will hopefully become available in the near future to address this issue.
ACKNOWLEDGMENTS
This work was supported by R01AI079578, a grant from NIAID to The Institute for Therapeutic Innovation.
The content is solely the responsibility of the authors and does not necessarily represent the official views of the National Institute of Allergy and Infectious Diseases or the National Institutes of Health.
Footnotes
Published ahead of print 9 April 2013
REFERENCES
- 1. Drusano GL, Lodise TP, Melnick D, Liu W, Oliver A, Mena A, Van Scoy B, Louie A. 2011. Meropenem penetration into epithelial lining fluid in mice and men and delineation of exposure targets. Antimicrob. Agents Chemother. 55:3406–3412 [DOI] [PMC free article] [PubMed] [Google Scholar]
- 2. Lodise TP, Sörgel F, Mason B, Melnick D, Kinzig M, Drusano GL. 2011. Penetration of meropenem into epithelial lining fluid in intubated patients with nosocomial pneumonia. Antimicrob. Agents Chemother. 55:1606–1610 [DOI] [PMC free article] [PubMed] [Google Scholar]
- 3. Drusano GL, Liu W, Fregeau C, Kulawy R, Louie A. 2009. Differing effects of combination chemotherapy with meropenem and tobramycin on cell kill and suppression of resistance on wild-type Pseudomonas aeruginosa PAO1 and its isogenic MexAB efflux pump-overexpressed mutant. Antimicrob. Agents Chemother. 53:2266–2273 [DOI] [PMC free article] [PubMed] [Google Scholar]
- 4. Louie A, Fregeau C, Liu W, Kulawy R, Drusano GL. 2009. Pharmacodynamics of levofloxacin in a murine pneumonia model of Pseudomonas aeruginosa infection: determination of epithelial lining fluid targets. Antimicrob. Agents Chemother. 53:3325–3330 [DOI] [PMC free article] [PubMed] [Google Scholar]
- 5. Clinical and Laboratory Standards Institute 2006. Methods for dilution antimicrobial susceptibility tests for bacteria that grow aerobically: approved standard. CLSI publication M7-A7. Clinical and Laboratory Standards Institute, Wayne, PA [Google Scholar]
- 6. Leary R, Jelliffe R, Schumitzky A, Van Guilder M. 2001. An adaptive grid non-parametric approach to pharmacokinetic and dynamic (PK/PD) models, p 389–394 Proceedings of the 14th IEEE Symposium on Computer-Based Medical Systems IEEE Computer Society, Bethesda, MD [Google Scholar]
- 7. D'Argenio DZ, Schumitzky A, Wang X. 2009. ADAPT 5 user's guide: pharmacokinetic/pharmacodynamic systems analysis software. Biomedical Simulations Resource, Los Angeles, CA [Google Scholar]
- 8. Greco WR, Bravo G, Parsons JC. 1995. The search for synergy: a critical review from a response surface perspective. Pharmacol. Rev. 47:331–385 [PubMed] [Google Scholar]
- 9. Chastre J, Wolff M, Fagon JY, Chevret S, Thomas F, Wermert D, Clementi E, Gonzalez J, Jusserand D, Asfar P, Perrin D, Fieux F, Aubas S, PneumA Trial Group 2003. Comparison of 8 vs 15 days of antibiotic therapy for ventilator-associated pneumonia in adults: a randomized trial. JAMA 290:2588–2598 [DOI] [PubMed] [Google Scholar]
- 10. Fink MP, Snydman DR, Niederman MS, Leeper KV, Jr, Johnson RH, Heard SO, Wunderink RG, Caldwell JW, Schentag JJ, Siami GA, The Severe Pneumonia Study Group 1994. Treatment of severe pneumonia in hospitalized patients: results of a multicenter, randomized, double-blind trial comparing intravenous ciprofloxacin with imipenem-cilastatin. Antimicrob. Agents Chemother. 38:547–557 [DOI] [PMC free article] [PubMed] [Google Scholar]
- 11. Drusano GL, Fregeau C, Liu W, Brown DL, Louie A. 2010. Impact of burden on granulocyte clearance of bacteria in a mouse thigh infection model. Antimicrob. Agents Chemother. 54:4368–4372 [DOI] [PMC free article] [PubMed] [Google Scholar]
- 12. Drusano GL, Vanscoy B, Liu W, Fikes S, Brown D, Louie A. 2011. Saturability of granulocyte kill of Pseudomonas aeruginosa in a murine model of pneumonia. Antimicrob. Agents Chemother. 55:2693–2695 [DOI] [PMC free article] [PubMed] [Google Scholar]
- 13. Jumbe N, Louie A, Leary R, Liu W, Deziel MR, Tam VH, Bachhawat R, Freeman C, Kahn JB, Bush K, Dudley MN, Miller MH, Drusano GL. 2003. Application of a mathematical model to prevent in-vivo amplification of antibiotic-resistant bacterial populations during therapy. J. Clin. Invest. 112:275–285 [DOI] [PMC free article] [PubMed] [Google Scholar]
- 14. White DB, Slocum HK, Brun Y, Wrzosek C, Greco WR. 2003. A new nonlinear mixture response surface paradigm for the study of synergism: a three drug example. Curr. Drug Metab. 4:399–409 [DOI] [PubMed] [Google Scholar]