

Abstract
Safe, effective concomitant treatment regimens for tuberculosis (TB) and HIV infection are urgently needed. Bedaquiline (BDQ) is a promising new anti-TB drug, and efavirenz (EFV) is a commonly used antiretroviral. Due to EFV's induction of cytochrome P450 3A4, the metabolic enzyme responsible for BDQ biotransformation, the drugs are expected to interact. Based on data from a phase I, single-dose pharmacokinetic study, a nonlinear mixed-effects model characterizing BDQ pharmacokinetics and interaction with multiple-dose EFV was developed. BDQ pharmacokinetics were best described by a 3-compartment disposition model with absorption through a dynamic transit compartment model. Metabolites M2 and M3 were described by 2-compartment models with clearance of BDQ and M2, respectively, as input. Impact of induction was described as an instantaneous change in clearance 1 week after initialization of EFV treatment and estimated for all compounds. The model predicts average steady-state concentrations of BDQ and M2 to be reduced by 52% (relative standard error [RSE], 3.7%) with chronic coadministration. A range of models with alternative structural assumptions regarding onset of induction effect and fraction metabolized resulted in similar estimates of the typical reduction and did not offer a markedly better fit to data. Simulations to investigate alternative regimens mitigating the estimated interaction effect were performed. The results suggest that simple adjustments of the standard regimen during EFV coadministration can prevent reduced exposure to BDQ without increasing exposures to M2. However, exposure to M3 would increase. Evaluation in clinical trials of adjusted regimens is necessary to ensure appropriate dosing for HIV-infected TB patients on an EFV-based regimen.
INTRODUCTION
Coinfection with tuberculosis (TB) and HIV is common. Of 8.7 million patients with incident TB in 2011, about 13% were HIV infected (1). TB is a leading cause of death among HIV-infected individuals in low- and middle-income countries (2). Safe, effective concomitant treatment regimens for the two infections are urgently needed given that concurrent treatment, rather than sequential treatment, is now the standard of care (3). Drug-drug interactions (DDIs) and overlapping toxicities, however, complicate HIV-TB cotreatment (4). Bedaquiline (BDQ), formerly known as TMC207, is a diarylquinoline just recently approved by the Food and Drug Administration for treatment of multidrug-resistant TB (MDR-TB). This makes bedaquiline the first new licensed drug for TB with a novel mechanism of action in decades. The recommended dosing regimen is 2 weeks of 400 mg once daily (QD) followed by 22 weeks of 200 mg three times per week. BDQ targets bacterial ATP synthase and disrupts energy metabolism (5, 6). BDQ has demonstrated antimycobacterial activity in vitro (7, 8), in animal models (9–11), and among patients with TB (12–14). It has been suggested that BDQ could also improve and simplify treatment of drug-sensitive TB by shortening the treatment duration required for cure (15).
BDQ is primarily metabolized to an N-monodesmethyl metabolite (M2) by cytochrome P450 (CYP) 3A4 (Fig. 1). M2 has 3- to 6-fold-weaker (16) activity in vitro and is of interest for safety reasons because it is more cytotoxic and a stronger inducer of phospholipidosis than the parent compound in in vitro experiments (17). M2 is further primarily demethylated to an M3 metabolite (responsible enzyme[s] not known). The toxicity profile of M3 is not well characterized, but some data suggest that M3 has a toxicity profile similar to that of M2 (18). The elimination of BDQ involves multiple phases, and the terminal half-life of both BDQ and M2 is extremely long, approximately 5 months, complicating efforts to evaluate the effects of CYP3A inhibitors or inducers on BDQ exposures (16).
Fig 1.
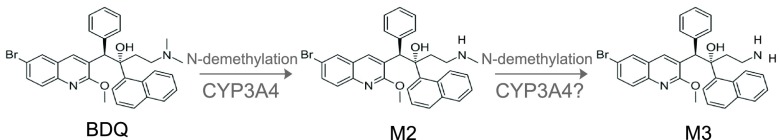
Biotransformation of BDQ to M2 and M3 metabolites (other metabolic pathways not shown).
Efavirenz (EFV) is a nonnucleoside reverse transcriptase inhibitor (NNRTI) that is widely used as part of combination antiretroviral (ART) therapy (cART). EFV is also an inducer of CYP3A4 activity (16) and would be predicted to reduce BDQ concentrations. In a phase I study sponsored by the AIDS Clinical Trials Group (ACTG; study A5267), 600 mg EFV once nightly reduced exposures (area under the concentration-time curve up to day 14 after dose [AUC0–168]) of single-dose BDQ by 18% (90% confidence interval [CI], 11 to 25%) and increased the maximum concentration (Cmax) of M2 by 89% (90% CI, 66 to 115%) (19). However, because of the long terminal half-life of BDQ, the effects of EFV on steady-state BDQ and M2 concentrations could not be predicted using noncompartmental analyses. Having accurate estimates of BDQ and M2 concentrations with EFV is important not only because reduced BDQ exposures may compromise treatment efficacy but also because M2 is thought to be more toxic than the parent drug, based on in vitro tests and animal studies (16, 17). In the present analysis, we hypothesized that EFV would reduce BDQ concentrations more than 20% when the drugs were given together at steady state and that M2 concentrations would not be increased but would, rather, be decreased in the setting of multiple-dose EFV. To estimate the effects of EFV on steady-state BDQ, we obtained raw BDQ and M2 concentration data from the phase I trial, measured M3 concentrations in stored clinical samples, and developed a population pharmacokinetics (PK) model incorporating BDQ, M2, and M3 data. This is the first model characterizing also the PK of the metabolites. To inform future phase II trials of BDQ that may include patients with HIV infection on EFV-based ART, we simulated alternative regimens that could mitigate the estimated interaction effect at chronic administration.
MATERIALS AND METHODS
Study population and design.
Study participants were healthy adults 18 to 65 years of age recruited at four ACTG sites in the United States. Subjects included had no clinical evidence of TB, negative HIV antibody test results, normal values on standard blood tests, and normal corrected QT intervals, as previously described (19). Women of reproductive potential were excluded. EFV metabolizer status (extensive, intermediate, or slow) was based on CYP2B6 composite 516/983 genotype (20).
The trial was a sequential PK study with two periods (Fig. 2). On the morning of day 1, subjects received a single dose of 400 mg of BDQ orally after a standard breakfast with an energy content of 670 kcal and 33% fat. Samples for PK analysis were collected predose and at 1, 2, 3, 4, 5, 6, 8, 12, 24, 48, 72, 120, 168, 216, 264, and 336 h postdose, i.e., up to day 14. From day 15 to 42, subjects received 600 mg EFV fasting each evening. On day 28, PK sampling of EFV was performed for 24 h. On the morning of day 29, after 2 weeks of daily EFV, a second dose of 400 mg of BDQ was administered, and PK samples were collected up to 336 h postdose (up to day 43), following the same sampling scheme as in the first sampling period. The clinical research has been conducted according to good clinical practice, the initial trial was approved by the institutional review boards of participating sites, and all subjects provided written informed consent.
Fig 2.
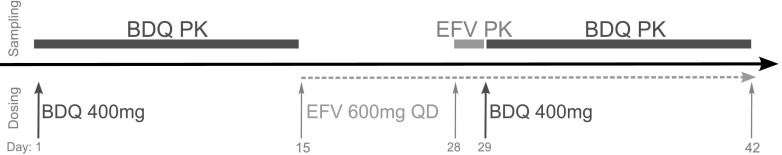
Study design outlining dosing (bottom) and PK sampling (top) over time.
Drug concentration analysis.
Concentrations of BDQ and M2 were determined and reported previously (19). For this analysis, M3 concentrations were measured using selected stored plasma samples from the original study (8 per PK profile: predose, 3, 6, 24, 72, 168, 264, and 336 h). Concentrations of BDQ and M2 in plasma were previously determined using a validated high-performance liquid chromatography method with tandem mass spectroscopy detection (19). The interassay precision (% coefficient of variation [CV]) was below 15%, and the deviation (% relative error [RE]) was within the interval of −10% and 10% for both compounds. The lower limit of quantification was 10 ng/ml. For this analysis, the same assay was applied and validated also for M3. For measurements of M3, the interassay CV and RE were 4.9 to 6.5% and 0.8 to −1.6%, respectively. The intra-assay CV and RE were 1.4 to 7.5% and 0.4 to 12.4%, respectively. The method was linear over the range from 0.50 to 500 ng/ml. For some samples, assay results were available despite being reported as a value below the limit of quantification. Such samples were used in the analysis, whereas samples without assay results were omitted from the analysis.
Population modeling.
The population PK of BDQ, M2, and M3 was described with nonlinear mixed-effects (NLME) models. NLME models consist of a structural component (fixed effects) and a stochastic component (random effects). The stochastic model divides the unexplained variabilities into those assigned to specific parameters and the residual error which is assigned to observations. Structural models evaluated included disposition models with 1 to 4 compartments for BDQ and 1 to 3 compartments for the metabolites and absorption models, including zero- and first-order processes, features to capture a second peak, time lag, and dynamic transit compartments (21). The typical value of bioavailability (F) was fixed to 1. The between-subject variability (BSV) and between-occasion variability (BOV) were assumed to follow log-normal distributions as described by equation 1, where θi is the individual parameter value, θ is the typical population value, and η is the patient- or occasion-specific random effect drawn from a normal distribution with mean 0 and variance ω2. The typical values of θ and ω2 were estimated.
| (1) |
For intraindividual parameter variability, the study was divided into two occasions, where the first one started with the first BDQ administration and the second started with the second BDQ administration. Different residual error models with additive, proportional, and combined error structures; time and concentration dependencies; and correlations between measurements of parent and metabolites in the same sample (L2 correlation) were evaluated. Allometric scaling of all disposition compartments with body weight as the size descriptor and fixed (0.75 for clearance and 1 for volume of distribution [V]) or estimated coefficients was evaluated. Other covariates (individual EFV PK and CYP2B6 metabolizer genotype) were subsequently evaluated in a stepwise fashion. The individual EFV exposure and clearances were obtained by applying a previously published model (22) and reestimating parameter values based on the data collected in this study. Since no PK data were collected during the first 2 weeks of EFV treatment, the time course of the induction could not be characterized, and the effect was modeled as an instantaneous change in clearance (CL) and/or bioavailability (F). Several time points between day 1 and day 14 of EFV treatment were tested for this change. In the most general model, it was assumed that each substance (BDQ, M2, and M3) may have inducible as well as noninducible routes of elimination. For M2 and M3, it was evaluated whether the formation was best described as arising from an inducible or a noninducible pathway. Correlations in induction magnitude between different metabolic steps were also investigated. Since these types of assumptions may correspond to models that are structurally unidentifiable with the available information (23), they were evaluated in parallel with corresponding identifiable models.
The model selection was based on scientific plausibility and on maximum likelihood statistics (quantified by the objective function value [OFV], defined as minus two times the log likelihood, with a 5% significance level applied for statistical tests), precision in parameter estimates, and graphical analysis of goodness-of-fit plots (population and individual predictions versus observations and conditional weighted residuals [CWRES] versus time after dose and versus individual predictions) and visual predictive checks (VPC; simulations n = 1,000). Eta shrinkage was continuously monitored. A nonparametric bootstrap (n = 100) was employed to provide information on model robustness and parameter imprecision.
Software.
The analysis was performed in NONMEM 7.2 (Icon Development Solutions, Hanover, MD) (24) with the first-order conditional estimation method including eta-epsilon interaction. The model development work was facilitated by PsN (25, 26) for automation of a diverse range of processes and Xpose 4 (27) for graphical evaluation. Pirana (28) was used for creation of run records and documentation and as an interface between above-mentioned software and the computation cluster.
Calculation of relative exposure.
The impact of EFV induction on average concentrations at steady state (Css,av) can be evaluated using equation 2, where F is bioavailability and CL is clearance and which also allows changes in dose or dosing interval (τ) to be taken into account.
| (2) |
Relative average steady-state concentration, assuming the same dosing strategy, is then given by equation 3, including parameter values in the absence and presence of concomitant EFV treatment.
| (3) |
The same equations can be used for BDQ, M2, and M3 as long as the fraction metabolized is assumed to be 100%. Standard errors (SEs) of the relative exposures were calculated from a nonparametric bootstrap (n = 100).
Simulations of alternative dosing regimens.
The proposed dosing regimen for treatment of MDR-TB with BDQ is 400 mg daily (QD) for 2 weeks followed by 200 mg three times per week (TIW) for 22 weeks, as part of multidrug TB treatment (16). Simulations of this regimen and alternatives (Table 1) were performed with the developed population model in the absence and presence of concomitant EFV. The scenario modeled was of patients simultaneously diagnosed with HIV and TB starting EFV-containing ART following 2 weeks of anti-TB treatment; hence, the induction effect of EFV would build up during a period after initialization of ART simultaneously with ongoing BDQ treatment. The simulation data set was set up with the same number of subjects and demographic characteristics as those in a published phase II study (13).
Table 1.
Standard and alternative BDQ regimens evaluated in simulations
| Dosing regimen | Initial phase (wk 1–2) | Maintenance phase (wk 3–24) |
|---|---|---|
| Standard | 400 mg daily | 200 mg three times weekly |
| Alternative 1: increased frequency | 400 mg daily | 200 mg daily |
| Alternative 2: increased dose | 400 mg daily | 400 mg three times weekly |
The simulations were evaluated by comparing estimated cumulative weekly exposures (AUC0–168) and Cmax at different time points during the treatment period.
RESULTS
Subjects.
Thirty-seven healthy subjects were enrolled in ACTG study A5267. Thirty-five completed the first PK sampling, and 33 completed both PK sampling periods; all 35 were included in the modeling analysis. Summary characteristics are provided in Table 2.
Table 2.
Summary of patient characteristics
| Characteristic | Value |
|---|---|
| Median wt, kg (range) | 82.3 (57.3–118.8) |
| Median BMI,a kg m−2 (range) | 25.9 (19.0–36.1) |
| Median age, yr (range) | 44 (19–62) |
| Sex, n (%) | |
| Male | 32 (91) |
| Female | 3 (9) |
| Race/ethnicity, n (%) | |
| Black, non-Hispanic | 8 (23) |
| White, non-Hispanic | 24 (69) |
| Hispanic (regardless of race) | 2 (6) |
| Asian, Pacific Islander | 1 (3) |
| CYP2B6 metabolizer status, n (%) | |
| Slow | 3 (9) |
| Intermediate | 13 (37) |
| Extensive | 19 (54) |
BMI, body mass index.
PK model.
The data included 1,152 observations each of BDQ and M2 and 560 observations of M3. Some of these were reported as zero (1, 30, and 4 observations for BDQ, M2, and M3, respectively) or to have a measurable concentration below the limit of quantification (14, 146, and 13 observations, respectively).
The NONMEM code for the developed model is available in the supplemental material (Text S1). BDQ PK was best described by a 3-compartment disposition model with absorption through a dynamic transit compartment model (Fig. 3). M2 and M3 were described by 2-compartment models with clearance of BDQ and M2, respectively, as input. The impact of induction was described as an instantaneous change in clearance 1 week after initialization of EFV treatment, and it was allowed to impact all three compounds. The increase in clearance with induction was not significantly different for BDQ and M2 and estimated to be about 2-fold. For M3, the increase in clearance was notably smaller but significant. The variability model included BOV on absorption parameters and correlations between the BSV of clearances and induction effects. Proportional error models with correlations across residual errors for the three compounds were applied. Separate magnitudes of the error were estimated for samples drawn in the absorption phase (less than 6 h after dose) and for observations below the limit of quantification. The error for observations below the limit of quantification was estimated to 3.3 times higher, and the agreement between individual predictions and observations below limit of quantification was good.
Fig 3.

Schematic figure of developed PK model.
Allometric scaling of disposition parameters with fixed coefficients improved the fit markedly (0.75 for clearances and 1 for volumes; estimation of the coefficients did not significantly improve the fit further) and were the only covariate effects included in the model. Neither CYP2B6 metabolizer status nor individual EFV PK characteristics (AUC or CL/F) were significantly correlated with the magnitude of the induction effect. Table 3 lists parameter estimates, and Fig. 4 shows a stratified VPC of the final model.
Table 3.
Parameter estimates with relative standard errors of the final modela
| Fixed effectsb | Value (RSE, %) | Random effects | Value, % CV (RSE, %) |
|---|---|---|---|
| MTT, h | 1.31 (12.6) | BOV F | 23.6 (26.9) |
| KA, h−1 | 0.128 (8.7) | BSV F | 24.3 (28) |
| CL, liters h−1 | 2.96 (9.5) | BOV MTT | 55.4 (11) |
| V, liters | 17.3 (18.7) | BSV CL | 23.7 (11.9) |
| Q1, liters h−1 | 5.01 (8.3) | BSV CLM2 | 29.6c (31.5), 18.8 (23.7) |
| VP1, liters | 2,870 (15.3) | BSV CLM3 | −12.9c (90.8), 71.3c (34.5), 30 (24.9) |
| Q2, liters h−1 | 4.16 (10.2) | BSV EFVEFF-BDQ | −69.2c (13.8), −56.1c (24.1), −22.4c (64.7), 20.6 (10.8) |
| VP2, liters | 136 (9) | BSV EFVEFF-M2 | −29.7c (36.6), −77c (29.5), −71.9c (32.8), 75.2c (17), 28.2 (22.1) |
| CLM2, liters h−1 | 12.3 (10.1) | BSV EFVEFF-M3 | −7.4c (163.5), −58.2c (43.2), −83.4c (30.3), 42.5c (35.2), 87.9c (27.2), 32.7 (25) |
| VM2, liters | 659 (7.2) | BSV V | 34.6 (32) |
| Q1M2, liters h−1 | 103 (10.5) | BSV Q1 | 18.7 (15) |
| VP1M2, liters | 2,840 (6) | BSV VM2 | 28.9 (19) |
| CLM3, liters h−1 | 39.2 (9) | BSV VP1M2 | 25.9 (39) |
| VM3, liters | 11.2 (44.7) | ||
| QM3, liters h−1 | 106 (9.9) | Prop error BDQ | 23.9 (5.3) |
| VPM3, liters | 2,680 (13.6) | Prop error M2 | 14.9c (6.1), 17.7 (4.8) |
| EFVEFF BDQ and M2 | 2.07 (3.6) | Prop error M3 | 7.5c (21.4), 11.7c (5.6), 15 (10.2) |
| EFVEFF M3 | 1.12 (3.6) | ||
| NN | 5.21 (20.5) | ||
| Error wt TAD < 6 h | 1.87 (11) | ||
| Error wt < BLQ | 3.28 (15) |
Abbreviations: MTT, mean transit time; KA, absorption rate constant; F, bioavailability; CL, clearance, V, volume of distribution; Q, intercompartmental clearance; VP, volume of distribution of peripheral compartments; EFVEFF, induction effect of EFV; NN, number of transit compartments; TAD, time after dose; BLQ, below limit of quantification; Prop, proportional; BOV, between-occasion variability; BSV, between-subject variability; RSE, relative standard error; % CV, percent coefficient of variation.
Estimated with typical value of F fixed to 1.
Correlation estimated as a covariance; presented here structured as the omega or sigma blocks used in the NONMEM code.
Fig 4.

Visual predictive check showing the 5th, 50th, and 95th percentiles (lines) of observed BDQ, M2, and M3 concentration data (dots) and the 95% confidence intervals (shaded areas) of the same percentiles from model-simulated data.
Relative exposures.
The model predicted the relative average steady-state concentration (RelCss,av) of BDQ, comparing BDQ taken with EFV to BDQ taken alone, to be 48% (standard error [SE], 1.9%). For M2, this value was 48% (SE, 1.9%), and for M3, it was 88% (SE, 3.7%). The interindividual variabilities in RelCss,av were 21% (SE, 2.7%), 29% (SE, 7.7%), and 35% (SE, 9.8%) for BDQ, M2, and M3, respectively. Figure 5 illustrates weekly exposures and Cmax of the two scenarios.
Fig 5.
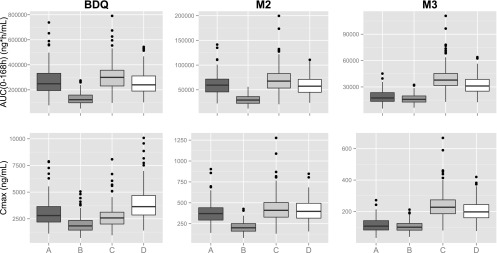
Simulations of standard and alternative dosing regimens of BDQ evaluated as weekly exposures (AUC0–168) and maximum concentrations (Cmax) at week 24 of treatment (representative for a large proportion of the treatment period). A, standard regimen (200 mg BDQ three times weekly); B, standard regimen and concomitant EFV; C, alternative 1 (200 mg BDQ daily) and concomitant EFV; D, alternative 2 (400 mg BDQ three times weekly) and concomitant EFV.
Alternative structural assumptions.
The magnitude of the induction effect was found to be independent of the time point for onset of induction effect. Allowing the induction to affect both bioavailability and clearances did not significantly improve the fit (ΔOFV, −3.3). The range of models with alternative structural assumptions regarding the fraction of BDQ that is metabolized to M2 and the fraction of M2 that is metabolized to M3 resulted in estimated typical RelCss,av of BDQ, M2, and M3 ranging between 48 and 64%, 48 and 60%, and 85 and 110%, respectively. None of the alternative models offered a markedly better fit to data.
Simulations of alternative dosing regimens.
Evaluation of weekly AUC and Cmax shows that two proposed alternative regimens can mitigate the estimated decrease in exposure of BDQ at chronic administration without increasing exposure to M2 above that for a standard regimen administered in the absence of EFV (Fig. 5). The exposure to M3 would, however, be increased about 2-fold. Increasing dosing frequency to daily (alternative 1) would not increase Cmax of BDQ, while doubling the dose but maintaining three-times-weekly dosing (alternative 2) would. Cmax of M2 would not be significantly affected by either alternative, while Cmax of M3 would be increased about 2-fold by both alternatives.
DISCUSSION
This modeling exercise indicates that the observed reduction in exposure to BDQ based on a single-dose study (19) might underestimate the actual effect during long-term treatment; in particular, these analyses show that we should expect a reduction in exposure to BDQ of about 50% when it is chronically coadministered with EFV. Studies in a murine model have demonstrated that AUC (or, equivalently, average concentration) is the main PK-pharmacodynamics (PD) driver for BDQ and is the parameter on which dose optimization should be based (29). Though the PK-PD relationship for BDQ in humans is not well characterized, it is likely that a reduction of this magnitude would be of clinical importance. In mice, a 50% reduction in BDQ dose, mimicking the inductive effects of a companion drug like rifampin or EFV, reduces its sterilizing activity, but not markedly (30, 31). From a safety standpoint, it is reassuring that the model predicts the elimination of M2 to be affected by EFV induction to the same extent as the elimination of BDQ; thus, the interaction is not expected to increase M2 overall or maximum exposures after multiple doses. To our knowledge, there have been no in vitro experiments investigating which metabolic enzyme(s) is responsible for conversion of M2 to M3, but due to the similarities of the compounds and the metabolic reaction (N demethylation), it is reasonable to postulate that CYP3A4 is the main metabolizing enzyme for M2, just as for BDQ. This hypothesis is also supported by in silico structure-based analysis (32, 33). If it is true that BDQ and M2 metabolisms are governed by the same enzyme, we would expect similar effects of induction on the two compounds, which is what our model predicts.
The parameters of the developed model were estimated with good precision, and the goodness-of-fit plots are satisfactory. The VPC indicates a slight overprediction of the variability. Evaluation of individual plots revealed one subject with a strongly deviating profile at the second dosing occasion: concentrations of all three compounds were substantially lower than expected. Reestimating model parameters without this individual decreased the estimates of BOV and BSV in bioavailability from 23.6% to 16.2% and 24.3% to 17.8%, respectively, while no other parameters were notably changed. The VPC of the model with reestimated parameters shows substantially less overprediction of the variability. One could hypothesize that something went wrong with administration of the second dose for this individual (for example, if one or more of the four 100-mg pills was not ingested despite observed dosing). As an experiment, we tested fitting the model assuming that three, two, one, or no pills were actually ingested and found the best fit with a dose corresponding to one pill. Nonetheless, since such a hypothesis is impossible to prove at this time and since none of the fixed-effect parameters which are important for the conclusions of this analysis were impacted, the data from this individual were retained in the analysis. However, when applying this population model to other data, we would consider using parameters obtained without this subject's data (provided in Table S2 in the supplemental material). M3 data were added to the analysis during a later stage of the model development process. Inclusion of M3 data did not significantly change the model properties for BDQ and M2, but it affirmed the estimations of M2 clearance and induction effect on M2. It also enabled testing of models with different assumptions regarding the structure of the induction effect on M2 clearance, which could not have been done without information about this secondary metabolite.
The anatomical or physiological mechanisms driving the compartments of the model are currently unknown. The PK data were generated in healthy subjects, as is commonly done in initial DDI studies. The difference in PK between healthy individuals and patients with TB or with HIV and TB has not been extensively studied for BDQ, but initial comparisons of BDQ PK parameters comparing healthy subjects to patients with TB did not demonstrate significant differences (16). BDQ, though, is extensively bound to plasma proteins, >99.9% (16), and it is known that levels of certain proteins are altered in patients with active TB. In general, the albumin level is decreased, while the level of α1-acid glycoprotein (AAG) is increased (34). It has also been reported that albumin levels are even further decreased in TB patients coinfected with HIV (35). For drugs like BDQ with a large steady-state volume of distribution and low intrinsic clearance compared to liver blood flow, both the volume of distribution and the clearance will be approximately proportional to the unbound fraction (fu) of the drug. The fu in patients can be described by equation 4, where P is the plasma protein level in patients or healthy individuals (hv) (36).
| (4) |
It is easily demonstrated that, at low fu (<0.01), the plasma protein levels (P) can impact the relative fu. For example, a decrease in albumin (when assuming it to be the only relevant plasma protein) from 4.5 g/dl to 3.5 g/dl would result in a 30% increase in fu. Thus, among patients with low albumin, the volume of distribution and clearance would be increased accordingly. Furthermore, the impact of TB and/or HIV disease on BDQ concentrations at the site of infection is unknown. Few individuals of races other than white were included in this study, and race was therefore not investigated as a covariate. It has previously been found that apparent CL of BDQ is 52% higher in black patients than in subjects of other races (18), which could be important to consider before applying the developed model in other populations.
Elegant and mechanistic models of enzyme induction have previously been published (37–39). Our simplistic implementation of the induction effect as an instantaneous change in clearance does not fully represent the physiological process, but it is good enough in this case where the data do not cover the first 2 weeks of the induction process. The time point for the onset of the induction effect was not found to impact the magnitude of the effect and was, therefore, chosen as 1 week after the start of EFV treatment. This corresponds to somewhat less than 50% of full induction according to the kinetics of autoinduction of CYP3A4 by EFV as estimated by Zhu et al. (38). The magnitude of the induction effect was based on 600 mg EFV once nightly and should not be expected to be the same at other EFV doses. Neither CYP2B6 metabolizer status nor individual EFV PK were found to significantly impact the magnitude of the induction. However, it should be noted that this study included few patients who were slow metabolizers, and therefore, we cannot rule out the possibility that these covariates could have an impact in a broader patient population.
A limitation to the modeling work performed is that the data did not cover full PK profiles of BDQ or the metabolites. Due to their extremely long terminal half-life, less than half of the predicted AUC0–infinity after a single dose was typically covered during the 14 days of sampling after the first dose (Fig. 6). If the characteristics of the profiles were to change at a later stage, for example, through a fourth elimination phase, there is no way that a model developed using 2-week data could capture that. The observation that concentrations of BDQ could be measured in patients participating in a phase II clinical trial almost 2 years after the last dose (13) while our model predicts that concentrations will be below the limit of quantification after about 9 months for the typical individual with the same dosing regimen as that in the above-mentioned trial may indicate that the 2-week PK sampling was not enough to capture information to support a fully correct model structure. To investigate the impact of a fourth slowly equilibrating compartment, we simulated PK data using a four-compartment model with the terminal phase having an impact after the first 2 weeks. The three-compartment structure of the developed model was applied to the simulated data, and parameters were reestimated. We found that the magnitude of the induction effect was somewhat underestimated with the three-compartment structure: an actual 2-fold increase in clearance was estimated to a 1.7-fold increase. Hence, if BDQ PK truly has four phases, the induction effect might be larger than what we predict with the three-compartment model. Nonetheless, we expect that the magnitude of the potential underestimation is small and will not significantly impact the conclusions given that the error is small (less than 15% in the evaluated examples).
Fig 6.

Fraction of AUC observed (AUC0–336/AUCinf) for BDQ and M2 without and with coadministration of EFV.
In simulations of long-term BDQ treatment with concomitant EFV introduced after 2 weeks, total weekly BDQ exposures (AUC0–168) and Cmax during the third week and during the final week of TB treatment were regarded as most important. Given the way that TB and HIV treatment are often given in the clinical setting (TB treatment initiated and then HIV treatment started 2 weeks later), week 3 is when the risk of elevated BDQ concentrations under the alternative regimens compared to the standard regimen is largest, since the induction effect of EFV has only just started. The last week is representative of a large proportion of the treatment period, when induction by EFV is at its maximum or near-maximum. The results from the extreme case (week 3) show that typical AUC0–168 would be about 50% higher than normal for both the alternative regimens, while the Cmax would be notably affected only for alternative 2. The typical AUC0–168 and Cmax for M2 and M3 would not be notably increased for either alternative. Since AUC0–168 and Cmax for all three compounds during week 3 with the alternative regimens would be lower than exposures experienced by patients during the first 2 weeks of treatment when BDQ is administered daily, we do not believe that the short period of increased exposures during the initial phase of the alternative regimens is an important safety concern. With the full induction effect by EFV (for example, during the last treatment week [Fig. 5]), BDQ and M2 exposures would be expected to be reduced by half if no dose adjustments are made. Both alternative regimens can mitigate the reduction without increasing the exposure to M2. The increase in exposure to M3 is about 2-fold for both alternatives. Little is known about M3 toxicity, but some in vitro data suggest that M3 is more cytotoxic and is a stronger inducer of phospholipidosis than BDQ (18). When considering the alternative regimens, it should also be noted that nonclinical toxicity studies found intermittent dosing to be better tolerated than daily dosing of the same weekly dose, potentially due to the smaller extent of tissue distribution (16).
We successfully developed a population PK model of the promising new TB drug BDQ that includes the inductive effects of EFV, one of the most commonly used antiretrovirals to treat HIV. Coadministration of EFV with BDQ is expected to reduce concentrations of BDQ and its main metabolite by about 50%. At first look, this seems troubling given that concurrent treatment of TB and HIV is now the standard of care. However, simulations performed using this model suggest that simple adjustments of the standard BDQ dosing regimen during EFV coadministration can prevent reduced exposure to BDQ in individuals taking EFV. Further, the suggested alternative regimens would not be expected to increase exposures to the M2 metabolite, which is reassuring from a safety standpoint. The potential clinical implications of increased M3 levels must be carefully considered. Alternative BDQ regimens for patients on ART must be further evaluated and studied in clinical trials to ensure appropriate dosing, dosing frequency, and safety profile. Including patients with HIV on ART in clinical trials of BDQ will be important to ensure early access to BDQ for HIV-infected patients with TB. The developed model could potentially be applied to data from other DDI studies to better characterize the impact of the studied drugs, like other antiretrovirals (ARVs), on BDQ exposure during long-term treatment.
Supplementary Material
ACKNOWLEDGMENTS
We gratefully thank the individuals who participated in the study. We are also grateful to the Janssen team, especially Peter Vis (no longer employed by Janssen) and Italo Poggesi, for providing raw data from other studies of BDQ to the study team for purposes of building the model and for their invaluable input on study design and review of modeling results. Tibotec (now Janssen) Pharmaceuticals and Bristol-Myers Squibb provided study drug for the original study. For the time-efficient coding of the dynamic transit compartment model, we thank Paolo Denti, Division of Clinical Pharmacology, Department of Medicine, University of Cape Town. Lastly, we thank Gabriele Cruciani at the Laboratory for Chemometrics and Cheminformatics, Università degli Studi di Perugia, for the in silico predictions of the M2-to-M3 metabolic pathway.
The content of the manuscript is solely the responsibility of the authors and does not necessarily represent the official views of the National Institute of Allergy and Infectious Diseases or the National Institutes of Health.
The parent (ACTG 5267) study was supported by the AIDS Clinical Trials Group sponsored by the National Institute of Allergy and Infectious Diseases. Assay of M3 was performed specifically for this substudy (NWCS 354) in the Drug Research Unit, Department of Clinical Pharmacology, at the University of California at San Francisco. This study was supported in part by NIH grants AI068636 (ACTG Leadership) and AI068634 (J.-G.P.). The efforts of K.E.D. were supported by K23AI080842. Financial support for the model development work (E.M.S.) was provided by the Swedish Research Council (521-2011-3442) and the Innovative Medicines Initiative Joint Undertaking (www.imi.europa.eu) under grant agreement 115337 for the PreDiCT-TB consortium, resources of which are composed of financial contribution from the European Union's Seventh Framework Programme (FP7/2007-2013) and EFPIA companies' in-kind contribution.
Footnotes
Published ahead of print 9 April 2013
Supplemental material for this article may be found at http://dx.doi.org/10.1128/AAC.00191-13.
REFERENCES
- 1. World Health Organization 2012. Global tuberculosis report 2012. World Health Organization, Geneva, Switzerland [Google Scholar]
- 2. Kwan CK, Ernst JD. 2011. HIV and tuberculosis: a deadly human syndemic. Clin. Microbiol. Rev. 24:351–376 [DOI] [PMC free article] [PubMed] [Google Scholar]
- 3. Havlir DV, Kendall MA, Ive P, Kumwenda J, Swindells S, Qasba SS, Luetkemeyer AF, Hogg E, Rooney JF, Wu X, Hosseinipour MC, Lalloo U, Veloso VG, Some FF, Kumarasamy N, Padayatchi N, Santos BR, Reid S, Hakim J, Mohapi L, Mugyenyi P, Sanchez J, Lama JR, Pape JW, Sanchez A, Asmelash A, Moko E, Sawe F, Andersen J, Sanne I, AIDS Clinical Trials Group Study A5221 2011. Timing of antiretroviral therapy for HIV-1 infection and tuberculosis. N. Engl. J. Med. 365:1482–1491 [DOI] [PMC free article] [PubMed] [Google Scholar]
- 4. McIlleron H, Meintjes G, Burman WJ, Maartens G. 2007. Complications of antiretroviral therapy in patients with tuberculosis: drug interactions, toxicity, and immune reconstitution inflammatory syndrome. J. Infect. Dis. 196(Suppl 1):S63–S75 doi:10.1086/518655 [DOI] [PubMed] [Google Scholar]
- 5. Koul A, Dendouga N, Vergauwen K, Molenberghs B, Vranckx L, Willebrords R, Ristic Z, Lill H, Dorange I, Guillemont J, Bald D, Andries K. 2007. Diarylquinolines target subunit c of mycobacterial ATP synthase. Nat. Chem. Biol. 3:323–324 [DOI] [PubMed] [Google Scholar]
- 6. Andries K, Verhasselt P, Guillemont J, Gohlmann HW, Neefs JM, Winkler H, Van Gestel J, Timmerman P, Zhu M, Lee E, Williams P, de Chaffoy D, Huitric E, Hoffner S, Cambau E, Truffot-Pernot C, Lounis N, Jarlier V. 2005. A diarylquinoline drug active on the ATP synthase of Mycobacterium tuberculosis. Science 307:223–227 [DOI] [PubMed] [Google Scholar]
- 7. Huitric E, Verhasselt P, Andries K, Hoffner SE. 2007. In vitro antimycobacterial spectrum of a diarylquinoline ATP synthase inhibitor. Antimicrob. Agents Chemother. 51:4202–4204 [DOI] [PMC free article] [PubMed] [Google Scholar]
- 8. Huitric E, Verhasselt P, Koul A, Andries K, Hoffner S, Andersson DI. 2010. Rates and mechanisms of resistance development in Mycobacterium tuberculosis to a novel diarylquinoline ATP synthase inhibitor. Antimicrob. Agents Chemother. 54:1022–1028 [DOI] [PMC free article] [PubMed] [Google Scholar]
- 9. Zhang T, Li SY, Williams KN, Andries K, Nuermberger EL. 2011. Short-course chemotherapy with TMC207 and rifapentine in a murine model of latent tuberculosis infection. Am. J. Respir. Crit. Care Med. 184:732–737 [DOI] [PMC free article] [PubMed] [Google Scholar]
- 10. Veziris N, Ibrahim M, Lounis N, Andries K, Jarlier V. 2011. Sterilizing activity of second-line regimens containing TMC207 in a murine model of tuberculosis. PLoS One 6:e17556 doi:10.1371/journal.pone.0017556 [DOI] [PMC free article] [PubMed] [Google Scholar]
- 11. Shang S, Shanley CA, Caraway ML, Orme EA, Henao-Tamayo M, Hascall-Dove L, Ackart D, Lenaerts AJ, Basaraba RJ, Orme IM, Ordway DJ. 2011. Activities of TMC207, rifampin, and pyrazinamide against Mycobacterium tuberculosis infection in guinea pigs. Antimicrob. Agents Chemother. 55:124–131 [DOI] [PMC free article] [PubMed] [Google Scholar]
- 12. Diacon AH, Pym A, Grobusch M, Patientia R, Rustomjee R, Page-Shipp L, Pistorius C, Krause R, Bogoshi M, Churchyard G, Venter A, Allen J, Palomino JC, De Marez T, van Heeswijk RP, Lounis N, Meyvisch P, Verbeeck J, Parys W, de Beule K, Andries K, McNeeley DF. 2009. The diarylquinoline TMC207 for multidrug-resistant tuberculosis. N. Engl. J. Med. 360:2397–2405 [DOI] [PubMed] [Google Scholar]
- 13. Diacon AH, Donald PR, Pym A, Grobusch M, Patientia RF, Mahanyele R, Bantubani N, Narasimooloo R, De Marez T, van Heeswijk R, Lounis N, Meyvisch P, Andries K, McNeeley DF. 2012. Randomized pilot trial of eight weeks of bedaquiline (TMC207) treatment for multidrug-resistant tuberculosis: long-term outcome, tolerability, and effect on emergence of drug resistance. Antimicrob. Agents Chemother. 56:3271–3276 [DOI] [PMC free article] [PubMed] [Google Scholar]
- 14. Rustomjee R, Diacon AH, Allen J, Venter A, Reddy C, Patientia RF, Mthiyane TC, De Marez T, van Heeswijk R, Kerstens R, Koul A, De Beule K, Donald PR, McNeeley DF. 2008. Early bactericidal activity and pharmacokinetics of the diarylquinoline TMC207 in treatment of pulmonary tuberculosis. Antimicrob. Agents Chemother. 52:2831–2835 [DOI] [PMC free article] [PubMed] [Google Scholar]
- 15. Lounis N, Veziris N, Chauffour A, Truffot-Pernot C, Andries K, Jarlier V. 2006. Combinations of R207910 with drugs used to treat multidrug-resistant tuberculosis have the potential to shorten treatment duration. Antimicrob. Agents Chemother. 50:3543–3547 [DOI] [PMC free article] [PubMed] [Google Scholar]
- 16. Janssen Pharmaceutical Companies 28 November 2012. Briefing document, TMC207 (bedaquiline), treatment of patients with MDR-TB, NDA 204–384. Janssen Pharmaceutical Companies, Titusville, NJ [Google Scholar]
- 17. Mesens N, Verbeeck J, Rouan M. 2007. Elucidating the role of M2 in the preclinical safety profile of TMC207, abstr PS-71291–11. Proc. 38th World Conf. Lung Health, Cape Town, South Africa [Google Scholar]
- 18. FDA Office of Antimicrobial Products 28 November 2012. Briefing package, NDA 204-384, Sirturo (bedaquiline 100-mg tablets), for the treatment of adults (≥18 years) as part of combination therapy of pulmonary multi-drug-resistant tuberculosis (MDRTB). FDA Anti-Infective Drugs Advisory Committee Meeting FDA Office of Antimicrobial Products, Silver Spring, MD [Google Scholar]
- 19. Dooley KE, Park JG, Swindells S, Allen R, Haas DW, Cramer Y, Aweeka F, Wiggins I, Gupta A, Lizak P, Qasba S, van Heeswijk R, Flexner C, ACTG 5267 Study Team 2012. Safety, tolerability, and pharmacokinetic interactions of the antituberculous agent TMC207 (bedaquiline) with efavirenz in healthy volunteers: AIDS Clinical Trials Group study A5267. J. Acquir. Immune Defic. Syndr. 59:455–462 [DOI] [PMC free article] [PubMed] [Google Scholar]
- 20. Haas DW, Gebretsadik T, Mayo G, Menon UN, Acosta EP, Shintani A, Floyd M, Stein CM, Wilkinson GR. 2009. Associations between CYP2B6 polymorphisms and pharmacokinetics after a single dose of nevirapine or efavirenz in African Americans. J. Infect. Dis. 199:872–880 [DOI] [PMC free article] [PubMed] [Google Scholar]
- 21. Savic RM, Jonker DM, Kerbusch T, Karlsson MO. 2007. Implementation of a transit compartment model for describing drug absorption in pharmacokinetic studies. J. Pharmacokinet. Pharmacodyn. 34:711–726 [DOI] [PubMed] [Google Scholar]
- 22. Cabrera SE, Santos D, Valverde MP, Dominguez-Gil A, Gonzalez F, Luna G, Garcia MJ. 2009. Influence of the cytochrome P450 2B6 genotype on population pharmacokinetics of efavirenz in human immunodeficiency virus patients. Antimicrob. Agents Chemother. 53:2791–2798 [DOI] [PMC free article] [PubMed] [Google Scholar]
- 23. Bonate PL. 2011. Pharmacokinetic-pharmacodynamic modeling and simulation, 2nd ed Springer, New York, NY [Google Scholar]
- 24. Beal S, Sheiner LB, Boeckmann A, Bauer RJ. 2010. NONMEM user's guides (1989–2010). Icon Development Solutions, Ellicott City, MD [Google Scholar]
- 25. Lindbom L, Ribbing J, Jonsson EN. 2004. Perl-speaks-NONMEM (PsN)—a Perl module for NONMEM related programming. Comput. Methods Programs Biomed. 75:85–94 [DOI] [PubMed] [Google Scholar]
- 26. Lindbom L, Pihlgren P, Jonsson EN. 2005. PsN-Toolkit—a collection of computer intensive statistical methods for non-linear mixed effect modeling using NONMEM. Comput. Methods Programs Biomed. 79:241–257 [DOI] [PubMed] [Google Scholar]
- 27. Jonsson EN, Karlsson MO. 1999. Xpose—an S-PLUS based population pharmacokinetic/pharmacodynamic model building aid for NONMEM. Comput. Methods Programs Biomed. 58:51–64 [DOI] [PubMed] [Google Scholar]
- 28. Keizer RJ, van Benten M, Beijnen JH, Schellens JH, Huitema AD. 2011. Pirana and PCluster: a modeling environment and cluster infrastructure for NONMEM. Comput. Methods Programs Biomed. 101:72–79 [DOI] [PubMed] [Google Scholar]
- 29. Rouan MC, Lounis N, Gevers T, Dillen L, Gilissen R, Raoof A, Andries K. 2012. Pharmacokinetics and pharmacodynamics of TMC207 and its N-desmethyl metabolite in a murine model of tuberculosis. Antimicrob. Agents Chemother. 56:1444–1451 [DOI] [PMC free article] [PubMed] [Google Scholar]
- 30. Lounis N, Gevers T, Van Den Berg J, Andries K. 2008. Impact of the interaction of R207910 with rifampin on the treatment of tuberculosis studied in the mouse model. Antimicrob. Agents Chemother. 52:3568–3572 [DOI] [PMC free article] [PubMed] [Google Scholar]
- 31. Andries K, Gevers T, Lounis N. 2010. Bactericidal potencies of new regimens are not predictive of their sterilizing potencies in a murine model of tuberculosis. Antimicrob. Agents Chemother. 54:4540–4544 [DOI] [PMC free article] [PubMed] [Google Scholar]
- 32. Cruciani G, Baroni M, Benedetti P, Goracci L, Fortuna GL. 2013. Exposition and reactivity optimization to predict sites of metabolism in chemicals. Drug Discov. Today Technol. 10:e155–e165 http://dx.doi.org/10.1016/j.ddtec.2012.11.001 [DOI] [PubMed] [Google Scholar]
- 33. Carosati E. Modelling cytochrome p450 binding modes to predict P450 inhibition, metabolic stability and isoform selectivity. Drug Discov. Today Technol., in press [DOI] [PubMed] [Google Scholar]
- 34. Peresi E, Silva SM, Calvi SA, Marcondes-Machado J. 2008. Cytokines and acute phase serum proteins as markers of inflammatory regression during the treatment of pulmonary tuberculosis. J. Bras. Pneumol. 34:942–949 [DOI] [PubMed] [Google Scholar]
- 35. Ramakrishnan K, Shenbagarathai R, Kavitha K, Uma A, Balasubramaniam R, Thirumalaikolundusubramanian P. 2008. Serum zinc and albumin levels in pulmonary tuberculosis patients with and without HIV. Jpn. J. Infect. Dis. 61:202–204 [PubMed] [Google Scholar]
- 36. McNamara PJ, Alcorn J. 2002. Protein binding predictions in infants. AAPS PharmSci. 4(1):E4 doi:10.1208/ps040104 [DOI] [PMC free article] [PubMed] [Google Scholar]
- 37. Smythe W, Khandelwal A, Merle C, Rustomjee R, Gninafon M, Bocar Lo M, Sow OB, Olliaro PL, Lienhardt C, Horton J, Smith P, McIlleron H, Simonsson US. 2012. A semimechanistic pharmacokinetic-enzyme turnover model for rifampin autoinduction in adult tuberculosis patients. Antimicrob. Agents Chemother. 56:2091–2098 [DOI] [PMC free article] [PubMed] [Google Scholar]
- 38. Zhu M, Kaul S, Nandy P, Grasela DM, Pfister M. 2009. Model-based approach to characterize efavirenz autoinduction and concurrent enzyme induction with carbamazepine. Antimicrob. Agents Chemother. 53:2346–2353 [DOI] [PMC free article] [PubMed] [Google Scholar]
- 39. Hassan M, Svensson US, Ljungman P, Bjorkstrand B, Olsson H, Bielenstein M, Abdel-Rehim M, Nilsson C, Johansson M, Karlsson MO. 1999. A mechanism-based pharmacokinetic-enzyme model for cyclophosphamide autoinduction in breast cancer patients. Br. J. Clin. Pharmacol. 48:669–677 [DOI] [PMC free article] [PubMed] [Google Scholar]
Associated Data
This section collects any data citations, data availability statements, or supplementary materials included in this article.