

Abstract
The ability to measure endogenous metabolites of retinoids (vitamin A and its derivatives) in biological samples is key to understanding the crucial physiological actions of vitamin A. Over the years, many assays and methods have been developed to analyze different retinoids in biological samples. Liquid chromatography is the best analytical technique for routine analysis of these compounds. However, due to their different chemical properties, different retinoid metabolites cannot be accurately separated and quantified in a single chromatographic run. Here, we will describe a reverse-phase HPLC isocratic method that enables extraction, separation, identification, and quantification of all-trans-retinol and different molecular species of retinyl ester with high accuracy, sensitivity, and reliability.
Keywords: Reverse-phase HPLC, retinol, retinyl ester, quantification, separation, mouse, tissues, retinoids, vitamin A
1. Introduction
Vitamin A is a lipid-soluble hormone that regulates the transcription of a number of genes that are crucial for many important biological functions (1). Adequate levels of retinoids (vitamin A and its derivatives) in serum and tissues are essential to maintain the health of the body (2). Retinoid homeostasis is achieved through a series of complex mechanisms that regulate absorption, storage, transport, and metabolism of this nutrient. Mammals obtain all vitamin A and its derivatives from the diet as preformed dietary vitamin A (retinyl esters, retinol, and very small amounts of retinoic acid) from animal products or as β-carotene from vegetables and fruits (3). Within the intestinal mucosa, all retinol, regardless of its dietary origin, is enzymatically re-esterified with long-chain fatty acids and, together with other dietary lipids, packaged into chylomicrons and secreted into the lymphatic system (4). Once in the general circulation, chylomicrons undergo lipolysis of the triglycerides giving rise to free fatty acids and smaller lipoprotein particles called chylomicron remnants, still retaining retinyl ester (5, 6). Approximately 75% of retinoids within chylomicron remnants are cleared by the liver, the major site of vitamin A storage and metabolism, while the remaining can be taken up by extrahepatic tissues (7–9). To meet tissue retinoid needs, the liver secretes retinol into the circulation, bound to its sole-specific transport protein retinol-binding protein (RBP; also known as RBP4) (10, 11). Upon recognition of the serum retinol–RBP complex by Stra6, its recently identified specific membrane receptor (12), target tissues acquire retinol which can be subsequently oxidized to retinoic acid, the active form of vitamin A (4). Retinoic acid acts as a ligand for specific nuclear receptors that, in turn, control gene transcription (1).
The levels of circulating retinol and retinyl ester reflect the whole-body vitamin A status, which is determined by both the concentration of retinoids within the stores and the recent dietary retinoid intake. Therefore, the ability to measure endogenous retinoid levels in serum and tissues is pivotal to elucidate the regulatory mechanisms that maintain retinoid homeostasis and, ultimately, to overcome many pathological conditions and diseases that have been associated with alterations in retinoid metabolism (13–19). For routine assessment and characterization of retinoids in biological samples, liquid chromatography is the best analytical technique. The different chemical properties of the retinoid metabolites do not allow accurate quantification of retinol, its isomers, retinal, retinyl esters, and retinoic acid in a single chromatographic run (20). In addition, the levels of retinoic acid in biological samples are extremely low, thus requiring sophisticated methods for their accurate quantification (21, 22). Herein, we will describe the extraction, separation, identification, and quantification of all-trans retinol and retinyl esters in murine serum and tissues. The mouse is the most commonly used experimental animal model to study whole-body vitamin A metabolism. However, this method can also be used to measure retinoid concentrations in cell culture system or in human samples.
To date, many assays have been developed to analyze retinol and retinyl ester levels in biological samples (23–28). Some of the previously described methods focus on separation of the different molecular species, but either do not offer a rigorous quantification or do not have high sensitivity. Others provide precise identification and robust quantification of several retinoid compounds, but do not allow separation of the different molecular species of retinyl ester (20). In this chapter, we describe a reverse-phase high-performance liquid chromatography (HPLC) isocratic method that allows the accurate extraction, separation, identification, and quantification of all-trans-retinol and different molecular species of retinyl ester with a high analytical performance. The sample requirement (from 50 to 200 mg tissue and 80–100 μl serum), the high recovery during extraction (ranging from 75 to 95%), the lower limits of detection (defined as signal/noise ratio of 3:1) of 0.35 and 0.95 pmol for retinol and retinyl palmitate, respectively, and the relatively short run time (35 min) make this method comparable to others recently reported in detail (20). In addition, this method is also suitable for simultaneous analysis and quantification of retinoid and carotenoids from biological samples (29). This methodology, routinely used in our laboratory (30), was originally established by Blaner and colleagues (29).
2. Materials
2.1. Preparation of the Standards
Ethanol (ACS grade).
Retinol (Sigma).
Retinyl acetate (Sigma).
Retinyl palmitate (Sigma).
Amber vials with cap.
2.2. Retinoid Extraction
Fresh or frozen serum or tissues (see Note 1).
Internal standard (retinyl acetate).
Ethanol (ACS grade).
Hexane (HPLC grade).
H2O (HPLC grade).
PVDF filter membrane (0.22 μm, 47 mm).
All-glass filtration unit.
Phosphate buffer saline (PBS), for tissues only.
N2 gas, Evap-O-Rac System (Cole-Parmer).
PRO200 Homogenizer (PROscientific), for tissues only.
Glass Pasteur pipettes (9 in.) and rubber bulbs.
Polypropylene tubes (12 mm × 75 mm).
Glass test tubes (13 mm × 100 mm; 16 mm × 100 mm).
2.3. Retinoid Analysis
High-performance liquid chromatography system (see Note 2).
Column (see Section 3.4.2, Beckman, Part. no. 235329; see Note 3).
Guard column (PerkinElmer, Part. no. 0711-0092).
Amber vials (National scientific, cat. no. C4000-2 W; see Note 2).
Capacity glass vial inserts (300 μl; National scientific, cat. no. C4010-630; see Note 4).
Vial caps with PTFE/Silicon septa (National scientific, cat. no. C4000-54A; see Note 5).
Methanol (HPLC grade).
Acetonitrile (HPLC grade).
Methylenechloride (HPLC grade).
3. Methods
Due to the light-sensitive nature of retinoids, all the following experimental procedures should be performed “in the dark” (see Note 6).
3.1. Preparation of the Standards
Prepare stock solutions of standards by dissolving each standard into the appropriate solvent as follows: ethanol for retinol and retinyl acetate; hexane for retinyl palmitate.
Stock standard solutions should be prepared in amber vials and kept at −20°C (see Note 7).
Dilute each standard solution up to approximately 1 ng/μl (see Note 8).
Measure the absorbance of the diluted standard solutions by spectrophotometer at 325 nm (see Note 9).
- Calculate the concentration of each standard solution based on the O.D. and the specific extinction coefficient (see Note 10).
Aliquot the diluted standard solutions in small amber vials and keep them at −20°C (see Note 8).
3.2. Determination of the Calibration Curves
3.2.1. Detection Limits
Prepare a series of dilutions with different amounts for each standard (retinol, retinyl acetate, and retinyl palmitate) (see Note 11).
Inject the dilutions into the HPLC column (see Note 12).
Integrate the peak signals detected by UV absorbance at 325 nm and obtain the peak areas. Generate a standard curve by plotting the amount of each standard dilution on the x-axis and the corresponding peak area on the y-axis (Fig. 15.1a).
Figure 15.1.

Examples of limit of detection and standard curve. (a) Representative calibration curve for all-trans-retinol (at-ROL). On the x-axis, retinol mass is expressed in picomoles. On the y-axis the peak area is expressed as absorbance units (mAU). (b) Representative standard curve for retinol:retinyl acetate. On the x-axis are the molar ratios of all-trans-retinol (at-ROL) and retinyl acetate (Rac). On the y-axis the peak area is expressed as absorbance units (mAU). All r2 values are greater than 0.99.
3.2.2. Standard Curves
-
Prepare two series of standard solutions with different molar ratio of retinol–retinyl acetate and retinyl palmitate–retinyl acetate in HPLC amber vials as follows (see Note 13):
Retinol:retinyl acetate (m:m) = 0.1:1, 0.25:1, 0.5:1, 1:1, 2:1 (retinyl acetate concentration should be approximately 1 ng/μl)
Retinyl palmitate:retinyl acetate (m:m) = 0.1:1, 0.25:1, 0.5:1, 1:1, 2:1, 3:1, 4:1, 5:1 (retinyl acetate concentration should be approximately 2 ng/μl)
Inject the different standard solutions on the HPLC column (see Note 12).
Integrate the peak signals detected by UV absorbance at 325 nm and obtain the peak areas. Generate a standard curve by plotting the molar ratio between the retinoid compound of interest and the internal standard on the x-axis and the corresponding peak area on the y-axis (Fig. 15.1b).
3.3. Retinoid Extraction
3.3.1. Serum Extraction (See Note 6)
Add 100 μl of serum into a glass test tube.
Add 25 μl of the internal standard retinyl acetate and add ethanol so that the ratio between the total volume of ethanol and the total volume of serum used for the extraction is 1:1 (for example, if 150 μl of serum is used, 25 μl of the internal standard and 125 μl of ethanol will be added) (see Note 14).
Vortex the tube briefly.
Add 4 ml of hexane (see Note 15) and vortex for 30 s two times (see Note 16).
Centrifuge at 3,000 rpm for 3 min in a tabletop low-speed centrifuge (see Note 17).
By using a glass Pasteur pipette, transfer the upper phase into a new glass test tube containing 500 μl of H2O.
Vortex the new tube briefly.
Repeat step 5 and transfer the supernatant into a new glass test tube with a glass Pasteur pipette (see Note 18).
Dry the supernatant under a gentle stream of N2, by using the Evap-O-Rac System (Cole-Parmer).
Dissolve the sample in 50 μl of mobile phase (see Note 19) and transfer into a vial for injection on the HPLC column.
3.3.2. Tissue Extraction (See Note 6)
The weight of the tissue for extraction will depend on its retinoid content. For the purpose of explaining the procedure, we will describe retinoid extraction from liver, for which we recommend to use 100 mg (see Note 20).
Place 100 mg of liver into a polypropylene tube containing 2 ml of PBS (see Note 21).
Homogenize at medium speed for 10 s (see Note 22).
Transfer 200 μl of the homogenate into a glass test tube (see Note 23).
Add 100 μl of internal standard retinyl acetate and 100 μl of ethanol (see Note 14).
Vortex the tube briefly.
Follow the procedure described for serum extraction from step 4 (see Note 24).
3.4. High-Performance Liquid Chromatography (HPLC) Analysis (See Note 25)
3.4.1. Preparation
Prepare the mobile phase according to the protocol below (see of the Mobile Phase Note 26):
| Acetonitrile | 70% |
| Methanol | 15% |
| Methylenechloride | 15% |
3.4.2. Chromatography Conditions
| Column | Beckman Ultrasphere C18 (5 μm), 4.6 mm × 250 mm |
| Guard column | C18 (7 μm), 15 mm × 3.2 mm |
| Flow rate | 1.8 ml/min |
| Run time | 35 min |
| Injection volume | 20 μl |
| PDA detection wavelength | 325 nm |
3.4.3. Determination of the Retinoid Concentration
Integrate the peak signals detected by UV absorbance at 325 nm and obtain the peak areas for each of the different retinoids separated and identified upon the chromatographic run. The mass of each retinoid compound present under its HPLC peak will be determined from the area under the peak, using the equation of the standard curve generated as described above (see Note 27). A typical liver retinoid HPLC chromatogram is shown in Fig. 15.2.
Figure 15.2.
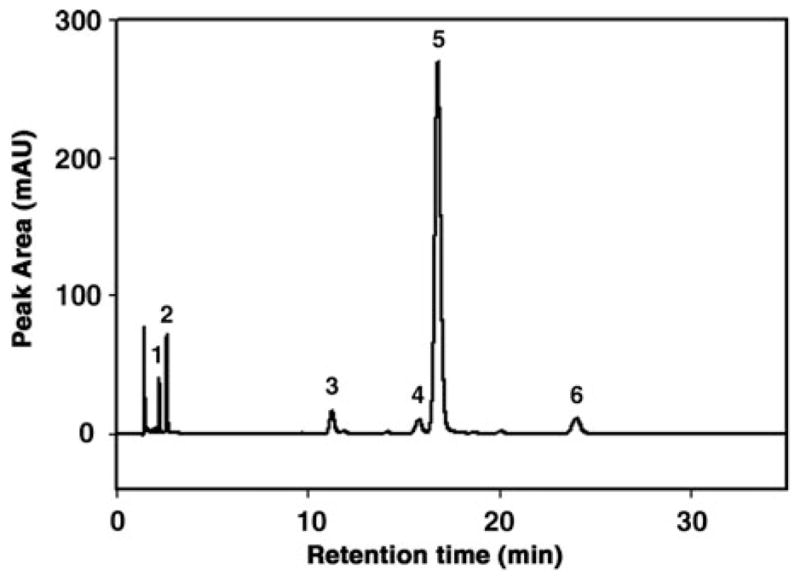
Representative chromatogram from reverse-phase HPLC analysis of retinol and retinyl esters in mouse liver. Retinoids were detected by UV absorbance at 325 nm and retinol and retinyl esters (retinyl palmitate, oleate, linoleate, and stearate) were identified by comparing peak integrated areas for unknowns against those of known amounts of purified standards, according to previous reports (29). On the x-axis, the retention time is expressed as minutes. On the y-axis the peak area is expressed as absorbance units (mAU). Peak 1, retinol; peak 2, internal standard retinyl acetate; peak 3, retinyl linoleate; peak 4, retinyl oleate; peak 5, retinyl palmitate; peak 6, retinyl stearate.
Footnotes
All samples will be flash-frozen in liquid N2 immediately after dissection and stored at −80°C until analysis will be performed. If possible, dissection should be carried “in the dark” (see Note 6) to minimize losses of light-sensitive retinoids.
All the HPLC accessories such as amber vials, vial inserts, and caps described in this chapter are compatible with the Dionex Ultimate 3000 series HPLC instrument. Different HPLC systems might require other types of accessories.
In our experience, this Beckman column has shown reproducible results (consistent retention times) over time.
These glass inserts are held into the vial by a spring that provides a cushion against needle contact. Once the sample analysis is completed, we recommend saving the spring for further assembly of new vials.
These vial caps and septa can also be purchased separately (cap w/o septa, National Scientific, cat. no. C4000-98BLK; septa, National Scientific, cat. no. C4000-60).
The extraction of retinoids from serum and tissues must be carried out rapidly “in the dark,” and all the extraction steps should be performed on ice or in a cold room. Laboratory windows should be covered with appropriate materials such as aluminum foil or heavy curtains (a room with no windows is the ideal setting to perform this procedure). Artificial lighting should be provided by yellow light bulbs sold in retail stores. Alternatively, use dim light and never expose the samples to direct illumination.
Highly concentrated retinoid standard stock solutions may degrade over time, even if stored at −20°C. The optimal recommended concentration of stock solutions is approximately 1 mg/ml. 30 mL is the suggested volume for a stock solution. Standard solutions prepared as indicated can be kept for several months at −20°C.
Diluted standard solutions are kept in amber vials. We recommend preparing small aliquots of 3–4 ml of the diluted standard solutions. Degradation or losses of the compounds can be minimized by flushing the headspace of the vial with N2 gas every time before closing the cap. It is recommended to analyze each aliquot of the diluted standards by HPLC before use, to check its quality.
Use 1-cm-width quartz cuvette (1 ml).
The extinction coefficient ( ) depends upon the compound and the solvent in which it is dissolved. The extinction coefficient for retinyl acetate dissolved in ethanol is 1550, for retinol dissolved in ethanol is 1835, and for retinyl palmitate dissolved in ethanol is 975.
The detection limit depends upon the detector and the column used. The range of concentrations tested should be chosen based on the retinoids content of the tissue analyzed. See Fig. 15.1a for a typical example of a detection limit curve.
How to operate the HPLC system will depend on the type of instrument and the description of this procedure does not pertain to this work. We only recommend monitoring the column pressure and the baseline of the target wavelength prior to loading the samples. Each dilution is run on the HPLC in triplicate. The injection volume varies according to the HPLC system and/or the protocol used. Twenty microliter is the standard injection volume for this protocol.
After adding the appropriate volume (according to the molar ratio) of the different retinoid compounds into a glass test tube, dry out each solution under a gentle stream of N2 gas and re-suspended in mobile phase. Vortex well and transfer into the insert of the HPLC amber vial immediately.
The suggested concentration of internal standard is 1 ng/μl. Note that the internal standard is dissolved in ethanol, and therefore its volume should be taken into account when calculating the total ethanol volume required to perform the extraction.
Once hexane is added, retinoids are stable. In other words, extraction procedures must be performed rapidly until the addition of hexane.
During this step, it is recommended to increase the speed of the vortex slowly so as to avoid spill over of solvent. One should also hold the glass tube from the side. Placing a finger on top of the tube may cause impurities to contaminate the sample, should the solvent overflows while mixing.
After this centrifugation step, the sample will consist of two layers: the bottom layer is the aqueous phase and it is slightly cloudy; the top, clear layer is the solvent phase containing retinoids. At the interface between the two layers and/or at the bottom of the tube, white or pinky colored tissue residues can be present.
After this centrifugation step, the sample will consist of two layers: the bottom layer contains water and the top layer contains the solvent. Both layers are clear and no residues are visible. Carefully transfer only the upper layer without touching the lower layer.
This step should be performed rapidly to avoid sample evaporation. Assemble the HPLC vials (insert vials, cap with septa, etc) ahead. In addition to serum, most tissues can be easily re-suspended in mobile phase. Should this not be the case, the sample appears cloudy and should not be injected on the HPLC column. For example, adipose tissue should be re-suspended in an alternative solvent, such as benzene, mobile phase:benzene (3:2, v:v), acetonitrile.
For adipose, we recommend to perform the extraction with less than 50 mg of tissue. For embryos at 14.5 dpc (approximately 200 mg), we suggest using the whole embryo and for adult prostate tissue the whole organ (about 40–50 mg).
Different volumes of PBS may be chosen to homogenize different tissues due to their different retinoid content. For example, 1 ml of PBS is recommended to homogenize a 14.5 dpc embryo, 2 ml of PBS for 50 mg of adipose tissue, and 1 ml of PBS for an adult prostate.
To avoid contaminations during the homogenization step, remember to wash the probe carefully with clean PBS between each samples.
Liver is a tissue with a high concentration of retinoids. Therefore, we recommend to perform the extraction with only one-tenth of the homogenate. However, the optimal homogenate volume for the extraction may vary, depending on the retinoid content of the tissue. For example, in the case of retinoid extraction from embryo, we recommend performing the extraction with the entire (or one-half) volume of the homogenate (1 ml). We also suggest using the whole volume of homogenate to perform the extraction from adipose (2 ml) or from prostate (1 ml).
It is not recommended to perform retinoid extraction from tissue homogenates previously stored at −20°C, as degradation of retinoids may occur. Freshly prepared tissue homogenates are preferred.
When assembling the samples for injection on the HPLC column, we recommended inserting a blank sample (mobile phase only) every 5–6 samples to clean the column from potential impurities.
Filter the mobile phase with the glass filter unit under vacuum by using the PVDF filter membrane. This step helps proper mixing of the different solvents and removes potential impurities. Furthermore, the mobile phase should be placed in an ultrasonicator for 30 min to degas it.
To obtain the peak areas, integration of the peak signals can be performed automatically through the HPLC system software or manually. Loss during extraction is accounted for by the addition of a known amount of internal standard (retinyl acetate) to the sample prior to extraction. The standard curve generated with retinyl palmitate and retinyl acetate (m/m) will be used to calculate the concentration of the different molecular species of retinyl ester. To obtain the final retinoid concentration, the volume of serum extracted or the percent of homogenate volume extracted vs. the total homogenate volume will also be taken into account.
References
- 1.Balmer JE, Blomhoff R. Gene expression regulation by retinoic acid. J Lipid Res. 2002;43:1773–1808. doi: 10.1194/jlr.r100015-jlr200. [DOI] [PubMed] [Google Scholar]
- 2.Blomhoff R, Blomhoff HK. Overview of retinoid metabolism and function. J Neurobiol. 2006;66:606–630. doi: 10.1002/neu.20242. [DOI] [PubMed] [Google Scholar]
- 3.Sporn MB, Roberts AB, Goodman DS. The Retinoids, Biology, Chemistry, and Medicine. 2. Raven Press; New York: 1994. [Google Scholar]
- 4.Vogel S, Gamble MV, Blaner WS. Biosynthesis, absorption, metabolism and transport of retinoids. In: Nau H, Blaner WS, editors. Handbook of Experimental Pharmacology, Retinoids, the Biochemical And Molecular Basis of Vitamin A and Retinoid Action. Springer Verlag Publishing; Heidelberg, Germany: 1999. pp. 31–95. [Google Scholar]
- 5.Olivecrona T, Bengtsson-Olivecrona G. Lipoprotein lipase and hepatic lipase. Curr Opin Lipidol. 1993;4:187–196. [Google Scholar]
- 6.Goldberg IJ. Lipoprotein lipase and lipolysis: Central roles in lipoprotein metabolism and atherogenesis. J Lipid Res. 1996;37:693–707. [PubMed] [Google Scholar]
- 7.Goodman DS, Huang HS, Shiratori T. Tissue distribution of newly absorbed vitamin A in the rat. J Lipid Res. 1965;6:390–396. [PubMed] [Google Scholar]
- 8.Cooper AD. Hepatic uptake of chylomicron remnants. J Lipid Res. 1997;38:2173–2192. [PubMed] [Google Scholar]
- 9.Blaner WS, Olson JA. Retinol and retinoic acid metabolism. In: Sporn MB, Roberts AB, Goodman DS, editors. The Retinoids, Biology, Chemistry and Medicine. Raven Press; New York: 1994. pp. 229–256. [Google Scholar]
- 10.Soprano DR, Blaner WS. Plasma retinol-binding protein. In: Sporn MB, Roberts AB, Goodman DS, editors. The Retinoids, Biology, Chemistry and Medicine. Raven Press; New York: 1994. pp. 257–282. [Google Scholar]
- 11.Quadro L, Hamberger L, Colantuoni V, Gottesman ME, Blaner WS. Understanding the physiological role of retinol-binding protein in vitamin A metabolism using transgenic and knockout mouse models. Mol Aspect Med. 2003;24:421–430. doi: 10.1016/s0098-2997(03)00038-4. [DOI] [PubMed] [Google Scholar]
- 12.Kawaguchi R, Yu J, Honda J, Hu J, Whitelegge J, Ping P, Wiita P, Bok D, Sun H. A membrane receptor for retinol binding protein mediates cellular uptake of vitamin A. Science. 2007;315:820–825. doi: 10.1126/science.1136244. [DOI] [PubMed] [Google Scholar]
- 13.Yang Q, Graham TE, Mody N, Preitner F, Peroni OD, Zabolotny JM, Kotani K, Quadro L, Kahn BB. Serum retinol binding protein 4 contributes to insulin resistance in obesity and type 2 diabetes. Nature. 2005;436:356–362. doi: 10.1038/nature03711. [DOI] [PubMed] [Google Scholar]
- 14.Ziouzenkova O, Orasanu G, Sharlach M, Akiyama TE, Berger JP, Viereck J, Hamilton JA, Tang G, Dolnikowski GG, Vogel S, Duester G, Plutzky J. Retinaldehyde represses adipogenesis and diet-induced obesity. Nat Med. 2007;13:695–702. doi: 10.1038/nm1587. [DOI] [PMC free article] [PubMed] [Google Scholar]
- 15.Fields AL, Soprano DR, Soprano KJ. Retinoids in biological control and cancer. J Cell Biochem. 2007;102:886–898. doi: 10.1002/jcb.21530. [DOI] [PubMed] [Google Scholar]
- 16.Goodman AB. Retinoid receptors, transporters, and metabolizers as therapeutic targets in late onset Alzheimer disease. J Cell Physiol. 2006;209:598–603. doi: 10.1002/jcp.20784. [DOI] [PubMed] [Google Scholar]
- 17.Golzio C, Martinovic-Bouriel J, Thomas S, Mougou-Zrelli S, Grattagliano-Bessieres B, Bonniere M, Delahaye S, Munnich A, Encha-Razavi F, Lyonnet S, Vekemans M, Attie-Bitach T, Etchevers HC. Matthew-Wood syndrome is caused by truncating mutations in the retinol-binding protein receptor gene STRA6. Am J Hum Genet. 2007;80:1179–1187. doi: 10.1086/518177. [DOI] [PMC free article] [PubMed] [Google Scholar]
- 18.Pasutto F, Sticht H, Hammersen G, Gillessen-Kaesbach G, Fitzpatrick DR, Nürnberg G, Brasch F, Schirmer-Zimmermann H, Tolmie JL, Chitayat D, Houge G, Fernández-Martínez L, Keating S, Mortier G, Hennekam RC, von der Wense A, Slavotinek A, Meinecke P, Bitoun P, Becker C, Nürnberg P, Reis A, Rauch A. Mutations in STRA6 cause a broad spectrum of malformations including anophthalmia, congenital heart defects, diaphragmatic hernia, alveolar capillary dysplasia, lung hypoplasia, and mental retardation. Am J Hum Genet. 2007;80:550–560. doi: 10.1086/512203. [DOI] [PMC free article] [PubMed] [Google Scholar]
- 19.Clagett-Dame M, DeLuca HF. The role of vitamin A in mammalian reproduction and embryonic development. Annu Rev Nutr. 2002;22:347–381. doi: 10.1146/annurev.nutr.22.010402.102745E. [DOI] [PubMed] [Google Scholar]
- 20.Kane MA, Folias AE, Napoli JL. HPLC/UV quantitation of retinal, retinol, and retinyl esters in serum and tissues. Anal Biochem. 2008;378:71–79. doi: 10.1016/j.ab.2008.03.038. [DOI] [PMC free article] [PubMed] [Google Scholar]
- 21.Kane MA, Chen N, Sparks S, Napoli JL. Quantification of endogenous retinoic acid in limited biological samples by LC/MS/MS. Biochem J. 2005;388:363–369. doi: 10.1042/BJ20041867. [DOI] [PMC free article] [PubMed] [Google Scholar]
- 22.Kane MA, Folias AE, Wang C, Napoli JL. Quantitative profiling of endogenous retinoic acid in vivo and in vitro by tandem mass spectrometry. Anal Chem. 2008;80:1702–1708. doi: 10.1021/ac702030f. [DOI] [PMC free article] [PubMed] [Google Scholar]
- 23.Packer L. Retinoids: Part A – molecular and metabolic aspects. Methods Enzymol. 1990;189:3–583. [PubMed] [Google Scholar]
- 24.Roberts AB, Nichols MD, Frolik CA, Newton DL, Sporn MB. Assay of retinoids in biological samples by reverse-phase high-pressure liquid chromatography. Cancer Res. 1978;38:3327–3332. [PubMed] [Google Scholar]
- 25.Blaner WS, Hendriks HF, Brouwer A, de Leeuw AM, Knook DL, Goodman DS. Retinoids, retinoid-binding proteins, and retinyl palmitate hydrolase distributions in different types of rat liver cells. J Lipid Res. 1985;26:1241–1251. [PubMed] [Google Scholar]
- 26.Napoli JL, Horst RL. Quantitative analyses of naturally occurring retinoids. Methods Mol Biol. 1998;89:29–40. doi: 10.1385/0-89603-438-0:29. [DOI] [PubMed] [Google Scholar]
- 27.Harrison EH, Blaner WS, Goodman DS, Ross AC. Subcellular localization of retinoids, retinoid-binding proteins, and acyl-CoA:retinol acyltransferase in rat liver. J Lipid Res. 1987;28:973–981. [PubMed] [Google Scholar]
- 28.Furr HC, Cooper DA, Olson JA. Separation of retinyl esters by non-aqueous reversed-phase high-performance liquid chromatography. J Chromatogr. 1986;378:45–53. doi: 10.1016/s0378-4347(00)80698-2. [DOI] [PubMed] [Google Scholar]
- 29.Redlich CA, Grauer JN, Van Bennekum AM, Clever SL, Ponn RB, Blaner WS. Characterization of carotenoid, vitamin A, and alpha-tocopheral levels in human lung tissue and pulmonary macrophages. Am J Respir Crit Care Med. 1996;154:1436–1443. doi: 10.1164/ajrccm.154.5.8912761. [DOI] [PubMed] [Google Scholar]
- 30.Kim YK, Wassef L, Hamberger L, Piantedosi R, Palczewski K, Blaner WB, Quadro L. Retinyl ester formation by lecithin:retinol acyltransferase (LRAT) is a key regulator of retinoid homeostasis in mouse embryogenesis. J Biol Chem. 2008;283:5611–5621. doi: 10.1074/jbc.M708885200. [DOI] [PMC free article] [PubMed] [Google Scholar]