

Abstract
Context
Healthcare Electronic Syndromic Surveillance (ESS) is the systematic collection, analysis and interpretation of ongoing clinical data with subsequent dissemination of results, which aid clinical decision-making.
Objective
To evaluate, classify and analyze the diagnostic performance, strengths and limitations of existing acute care ESS systems.
Data Sources
All available to us studies in Ovid MEDLINE, Ovid EMBASE, CINAHL and Scopus databases, from as early as January 1972 through the first week of September 2012.
Study Selection: Prospective and retrospective trials, examining the diagnostic performance of inpatient ESS and providing objective diagnostic data including sensitivity, specificity, positive and negative predictive values.
Data Extraction
Two independent reviewers extracted diagnostic performance data on ESS systems, including clinical area, number of decision points, sensitivity and specificity. Positive and negative likelihood ratios were calculated for each healthcare ESS system. A likelihood matrix summarizing the various ESS systems performance was created.
Results
The described search strategy yielded 1639 articles. Of these, 1497 were excluded on abstract information. After full text review, abstraction and arbitration with a third reviewer, 33 studies met inclusion criteria, reporting 102,611 ESS decision points. The yielded I2 was high (98.8%), precluding meta-analysis. Performance was variable, with sensitivities ranging from 21% –100% and specificities ranging from 5%-100%.
Conclusions
There is significant heterogeneity in the diagnostic performance of the available ESS implements in acute care, stemming from the wide spectrum of different clinical entities and ESS systems. Based on the results, we introduce a conceptual framework using a likelihood ratio matrix for evaluation and meaningful application of future, frontline clinical decision support systems.
Keywords: Alert, decision support systems, EMR, false, IC, monitor, sniffers, computer systems, computer-assisted, medical informatics applications, computerized medical records systems, surveillance, diagnostic
Introduction
Langmuir first described the fundamental principles of surveillance in 1963, as the systematic collection, analysis and consolidation of pertinent data and the subsequent dissemination of the results to the appropriate agents, who can take further actions [1, 2]. In many places and in many circumstances, electronic adjuncts are taking over components of syndromic surveillance. This is evident in healthcare, where information technology has improved patient safety in the hospital setting through primary and secondary prevention [3].
Medical records in the United States have become progressively more computerized after the incentives from the Health Information Technology for Economic and Clinical Health (HITECH) Act [4], which has created tremendous opportunities and challenges for coordinating local electronic surveillance efforts with national systems. The HITECH act also recognizes the importance of electronic syndromic surveillance (ESS) through the “meaningful use” regulatory framework [4].
Despite this national effort, there is still insufficient evidence about the overall performance and applicability of ESS tools in the everyday inpatient setting, particularly in the intensive care unit [ICU] setting. Several studies in this area often fail to compare the systems to the gold standard, of the human decision-making; instead they use surrogate markers and introduce incorporation bias.
The aims of this systematic review is to evaluate, classify and analyze the diagnostic performance of ESS systems, and introduce a conceptual framework through which we can standardize and deliver ESS tools more effectively and efficiently to the bedside.
Methods
The present systematic review was consistent with the methods prescribed by the Preferred Reporting Items for Systematic Reviews and Meta-Analyses (PRISMA) statement [5], and the Cochrane handbook for systematic reviews and intervention [6].
Institutional Review and Human Subjects Determination
The present study was exempt by the institutional review board approval is it did not involve active human subject research. No individual patients participated in the current study.
Study eligibility and participants
The main objective of this systematic review was to evaluate the performance of ESS in the acute care setting. For the purposes of this study, the “gold standard” used for comparison was the human expert opinion, either sought, or provided in the clinical chart. Included studies systematically evaluated the diagnostic performance of an ESS method against the gold standard, and reported the sensitivity and specificity of their ESS. In many situations, a quantitative or qualitative gold standard did not exist [7]. However, even in those cases, the perception of two individual practitioners served as a useful benchmark. An accountable human provider will eventually provide the final clinical diagnosis and treatment. Such measures are widely used in syndromes like sepsis or ventilator associated events, where consensus guidelines and definitions are used in the place of objective instruments for diagnosis. These clinical definitions are not ideal [8], but practical enough to guide clinical decision-making at the bedside.
Exclusion criteria were non-English language studies, pediatric population studies, and studies which did not systematically evaluate their ESS against an acceptable gold standard. Studies that included ESS tools as part of their gold standard definition were also excluded because of high risk of incorporation bias.
Search strategy
An expert librarian (P.J.E.) contributed with a methodical, comprehensive review of the literature in Ovid MEDLINE and Ovid EMBASE (from May 1975), CINAHL (from January 1992) and Scopus (from January 1972), through the first week of September 2012. No publication date restrictions were applied. The earliest chronological result was from January 1972. The detailed librarian search protocol is available in supplementary file Appendix 1. A synopsis of the utilized keywords can be found in ► Table 1.
Table 1.
Summary of used keywords
| Summary of used key words |
|---|
|
Study selection and data analysis
Two independent reviewers (M.G.K and J.C.O.) manually examined all study abstracts and retrieved potentially relevant articles for full text review. Each constructed a list of studies meeting criteria. A third reviewer (V.H.) resolved any discordance by arbitration. Using a standardized form, reviewers abstracted information from each study including (a) year, country and setting (b) the study type, population characteristics and sample size (c) the type and the area of intervention (d) the sensitivity, specificity, positive and negative predictive value of the ESS system and (e) a compiled summary of the reviewers’ comments and risk for bias after evaluating the strength of evidence for each given study.
All statistical and mathematical calculations were performed using a meta-analysis package [9] for the STATA software (StataCorp. 2009. Stata Statistical Software: Release 11.2 College Station, TX: StataCorp LP). Using STATA, the authors evaluated the diagnostic performance of different ESS systems and calculated the sensitivity, specificity, positive (LR+) and negative (LR-) likelihood ratios of each system. Four-quadrant likelihood matrices were generated incorporating all selected studies. ESS systems in the left upper quadrant (LUQ) can be used for ruling out (exclusion) and ruling in (confirmation) of syndromes, systems in the right upper quadrant (RUQ) for confirmation only, whereas systems in the left lower quadrant (LLQ) for exclusion only. Systems that fell in the right lower quadrant (RLQ) are systems, which had inferior performance, either in ruling in, or ruling out disorders of interest.
ESS tools are known to be highly heterogeneous and standard taxonomy systems have been used for their classification, like the one suggested from Berlin et al [10]. Studies were not stratified by formal quality scores, as current evidence suggests against employing quality scores in the analysis of diagnostic accuracy studies in systematic reviews [11].
Results
The above search strategy yielded 1639 abstracts of which 1497 were excluded based on abstract information. After abstraction and arbitration with a third reviewer, 33 ultimately met inclusion criteria. This is summarized in a PRISMA flow diagram (► Fig. 1). Nineteen studies were retrospective in design, while 13 were prospective, nonrandomized studies. One study was a prospective randomized controlled trial [12] (► Table 2).
Fig. 1.

Flow diagram of the study selection process.
Table 2.
Summary of performance of ESS studies in comparison with the gold standard. Study ID numbers correspond to the labels in the likelihood matrix (Figure 2)
| Study ID | Author and Year | Electronic Syndromic Surveillance Purpose | Type of Study | N of decision points | Sensitivity | Specificity | Positive Likelihood Ratio | Negative Likelihood Ratio | ||||
|---|---|---|---|---|---|---|---|---|---|---|---|---|
| 95% CI | 95% CI | 95% CI | 95% CI | |||||||||
| 1 | Slooter et al 2006 (19) | Seizures (distinguish between seizure and nonseizure epochs) | Retrospective | 150 | 0.89 | 0.75 to 0.97 | 0.50 | 0.40 to 0.60 | 1.79 | 1.44 to 2.22 | 0.21 | 0.08 to 0.54 |
| 2 | Kho et al 2007 (20) | Identification of rapid patient deterioration | Prospective, nonrandomized | 1878 | 0.54 | 0.39 to 0.68 | 0.71 | 0.69 to 0.73 | 1.86 | 1.43 to 2.43 | 0.65 | 0.48 to 0.88 |
| 3 | Azzam et al 2009 (13) | Acute Lung Injury | Retrospective | 199 | 0.87 | 0.75 to 0.95 | 0.89 | 0.83 to 0.94 | 7.92 | 4.93 to 2.72 | 0.15 | 0.07 to 0.30 |
| 4 | Mojoli et al 2010 (17) | Patient-Ventilator asynchrony | Retrospective | 3016 | 0.99 | 0.98 to 1.00 | 0.98 | 0.97 to 0.99 | 49.09 | 36.76 to 65.56 | 0.01 | 0.01 to 0.02 |
| 5 | Garcia-Esquirol et al 2010 (16) | Patient-Ventilator asynchrony | Retrospective | 1001 | 0.91 | 0.88 to 0.94 | 0.92 | 0.89 to 0.94 | 11.03 | 8.60 to 14.14 | 0.09 | 0.07 to 0.14 |
| 6 | Herasevich et al 2011 (18) | Ventilator-Induced Lung Injury | Retrospective | 304 | 1.00 | 0.97 to 1.00 | 0.81 | 0.74 to 0.86 | 5.11 | 3.79 to 6.90 | < 0.01 | < 0.01 to 0.08 |
| 7 | Koenig et al 2011 (14) | Acute Lung Injury | Prospective, nonrandomized | 1269 | 0.98 | 0.92 to 1.00 | 0.98 | 0.97 to 0.98 | 41.34 | 28.62 to 59.70 | 0.02 | 0.01 to 0.10 |
| 8 | Schmicki et al 2012 (15) | Acute Lung Injury | Retrospective | 161 | 0.47 | 0.37 to 0.57 | 0.92 | 0.80 to 0.98 | 5.63 | 2.16 to 4.68 | 0.58 | 0.48 to 0.70 |
| 9 | Hooper et al 2012 (12) | Systemic Inflammatory Response Syndrome | Prospective,- randomized | 529 | 0.99 | 0.97 to 1.00 | 0.92 | 0.88 to 0.95 | 11.65 | 7.88 to 17.22 | 0.01 | < 0.01 to 0.04 |
| 10 | Leth et al 2006 (22) | Septicemia, UTI, pneumonia, postoperative wound infection | Prospective, nonrandomized | 2820 | 0.77 | 0.70 to 0.83 | 0.99 | 0.99 to 0.99 | 85.13 | 56.71 to 27.79 | 0.23 | 0.17 to 0.30 |
| 11 | Pokorny et al 2006 (21) | Various types of nosocomial infections | Retrospective | 1044 | 1.00 | 0.98 to 1.00 | 0.54 | 0.50 to 0.57 | 2.14 | 2.00 to 2.31 | < 0.01 | < 0.01 to 0.08 |
| 12 | Schurink et al 2007 (24) | Ventilator Associated Pneumonia | Prospective, nonrandomized | 872 | 0.78 | 0.70 to 0.84 | 0.78 | 0.75 to 0.81 | 3.54 | 3.01 to 4.16 | 0.29 | 0.21 to 0.38 |
| 13 | Bellini et al 2007 (23) | Bloodstream Infections | Prospective, nonrandomized | 350 | 0.68 | 0.59 to 0.76 | 0.94 | 0.91 to 0.97 | 12.10 | 7.03 to 20.80 | 0.34 | 0.26 to 0.44 |
| 14 | Woeltje et al 2008 (25) | Central Line Associated Bloodstream Infections | Retrospective | 771 | 0.94 | 0.91 to 0.96 | 0.62 | 0.57 to 0.67 | 2.50 | 2.20 to 2.83 | 0.09 | 0.06 to 0.14 |
| 15 | Klompas et al 2008 (26) | Ventilator Associated Pneumonia | Prospective, nonrandomized | 455 | 0.95 | 0.76 to 1.00 | 0.96 | 0.94 to 0.98 | 25.83 | 15.82 to 42.18 | 0.05 | 0.01 to 0.33 |
| 16 | Claridge et al 2009 (27) | Central Line Associated Bloodstream Infections | Prospective, nonrandomized | 769 | 0.55 | 0.38 to 0.71 | 1.00 | 0.99 to 1.00 | 400.95 | 55.44 to 2899.8 | 0.45 | 0.32 to 0.63 |
| 17 | Wright et al 2009 (28) | Nosocomial Infections | Retrospective | 1068 | 0.75 | 0.58 to 0.88 | 0.97 | 0.95 to 0.98 | 21.50 | 14.82 to 31.20 | 0.26 | 0.15 to 0.46 |
| 18 | Wright et al 2009 (28) | Central Line Associated Bloodstream Infections | Retrospective | 700 | 0.99 | 0.98 to 1.00 | 0.98 | 0.95 to 0.99 | 45.84 | 20.77 to 01.15 | 0.01 | < 0.01 to 0.02 |
| 19 | Hota et al 2010 (22) | Prediction of central venous catheter use | Retrospective | 1386 | 0.90 | 0.88 to 0.92 | 1.00 | 0.99 to 1.00 | 929.12 | 58.19 to 14835.67 | 0.10 | 0.08 to 0.12 |
| 20 | McGrane et al 2010 (29) | Sepsis | Prospective, nonrandomized | 688 | 0.75 | 0.70 to 0.80 | 0.74 | 0.69 to 0.78 | 2.88 | 2.41 to 3.46 | 0.34 | 0.28 to 0.42 |
| 21 | Thiel et al 2010 (32) | Septic Shock | Retrospective | 41459 | 0.21 | 0.19 to 0.23 | 0.96 | 0.96 to 0.96 | 5.38 | 4.84 to 5.98 | 0.83 | 0.81 to 0.85 |
| 22 | Koller et al 2010 (30) | Sepsis, Central Line Associated Bloodstream Infections Pneumonia, UTI | Prospective, nonrandomized | 99 | 1.00 | 0.88 to 1.00 | 0.96 | 0.88 to 0.99 | 20.22 | 7.27 to 56.23 | 0.02 | < 0.01 to 0.28 |
| 23 | Woeltje et al 2011 (34) | Central Line Associated Bloodstream Infections | Retrospective | 330 | 0.96 | 0.88 to 0.99 | 0.98 | 0.95 to 0.99 | 41.21 | 18.66 to 91.00 | 0.04 | 0.01 to 0.13 |
| 24 | Choduri et al 2011 (33) | Catheter Associated Urinary Tract Infections | Retrospective | 204 | 0.86 | 0.75 to 0.94 | 0.94 | 0.89 to 0.97 | 13.93 | 7.34 to 26.43 | 0.14 | 0.08 to 0.28 |
| 25 | Bouzbid et al 2011 (35) | Nosocomial Infections | Retrospective | 1499 | 0.77 | 0.72 to 0.82 | 0.87 | 0.85 to 0.89 | 6.04 | 5.15 to 7.09 | 0.26 | 0.21 to 0.33 |
| 26 | Jonsbu et al 1993 (40) | Prediction of Coronary Care Unit Admission | Prospective, nonrandomized | 1251 | 0.96 | 0.94 to 0.97 | 0.56 | 0.52 to 0.60 | 2.18 | 1.97 to 2.41 | 0.07 | 0.05 to 0.10 |
| 27 | van Gils et al 1997 (36) | Heart Failure | Retrospective | 26362 | 1.00 | 1.00 to 1.00 | 0.99 | 0.99 to 1.00 | 185.00 | 142.47 to 240.22 | < 0.01 | < 0.01 to < 0.01 |
| 28 | Kennedy et al 1997 (41) | Acute Myocardial Infarcion | Prospective, nonrandomized | 89 | 0.91 | (0.71 to 0.99) | 0.90 | 0.80 to 0.96 | 8.70 | 4.26 to 7.76 | 0.10 | 0.03 to 0.38 |
| 29 | Lorenzoni et al 2006 (43) | Chest Pain | Prospective, nonrandomized | 473 | 0.90 | (0.86 to 0.94) | 0.87 | 0.82 to 0.91 | 6.83 | 4.88 to 9.55 | 0.11 | 0.08 to 0.16 |
| 30 | Helfenbein et al 2006 (37) | QT Interval monitoring | Retrospective | 116 | 0.99 | (0.94 to 1.00) | 0.05 | < 0.01 to 0.26 | 1.04 | 0.94 to 1.16 | 0.20 | 0.01 to 3.00 |
| 31 | Eshelman et al 2008 (42) | Hemodynamic Instability | Retrospective | 1125 | 0.72 | (0.65 to 0.78) | 0.77 | 0.74 to 0.79 | 3.09 | 2.67 to 3.58 | 0.37 | 0.29 to 0.46 |
| 32 | Aboukhalil et al 2008 (39) | Life Threatening Arrhythmias | Retrospective | 9772 | 0.40 | (0.39 to 0.42) | 0.50 | 0.49 to 0.51 | 1.19 | 1.15 to 1.24 | 0.81 | 0.77 to 0.84 |
| 33 | Gharaviri et al 2008 (38) | Myocardial Ischemia (ST/T wave changes) | Prospective, nonrandomized | 402 | 1.00 | (0.75 to 1.00) | 1.00 | 0.99 to 1.00 | 250.71 | 50.60 to 1242.2 | 0.04 | < 0.01 to 0.55 |
The majority of the selected ESS studies came from the USA (20 studies). The study selection algorithm included two studies each from Italy, Spain and the Netherlands. Seven studies additional studies originated from Austria, Denmark, Finland, France, Norway, Switzerland and the UK. Twenty-five studies involved academic institutions, three involved community hospitals and five studies were performed in a mixed community and academic setting. A thematic abundance of ESS systems was identified, covering a wide spectrum of clinical areas encompassing acute lung injury [13-15], patient-ventilator interaction [16-18], identification of seizures[19], rapid patient deterioration [20] nosocomial infection surveillance [21-35], heart failure [36], life-threatening electrocardiographic changes [37-39] and hemodynamic stability monitoring [40-42].
The diagnostic performance of the ESS tools was highly variable (► Table 2). Included studies totaled 102,611 ESS decision points for systematic evaluation [12-43]. Sensitivities of the ESS under examination ranged from 21% [32] to 100% [18, 21, 30, 36, 38]. Specificities ranged from 5% [37] to 100% [27, 31, 38]. Calculated positive likelihood ratios were as low as 1.04 [37] and as high as 929.12 [31]; the negative likelihood ratios ranged from 0.83 [32] to zero [36].
Forest plots of sensitivity, specificity and likelihood ratios can be found in the Appendix. High statistical heterogeneity (I2 = 98.8%) rendered pooled sensitivities, specificities and likelihood ratios inconsistent for collective meaningful use, thus no meta-analysis could be performed.
The construction of a likelihood ratio matrix (► Fig. 2), demonstrates which of the chosen methodologies were robust for ESS. The right, upper quadrant (RUQ) of the matrix illustrates the cluster of ESS tools with superior diagnostic performance in confirming diseases or syndromes. The left, lower quadrant (LLQ) displays more powerful diagnostic tools in excluding diseases/syndromes and the left, upper quadrant (LUQ) contains ESS tools with superior diagnostic performance in both confirming and excluding clinical disease entities or syndromes. The portion of ESS tools that were not as robust, are displayed collectively in the right, lower quadrant (RLQ) of the matrix.
Fig. 2.
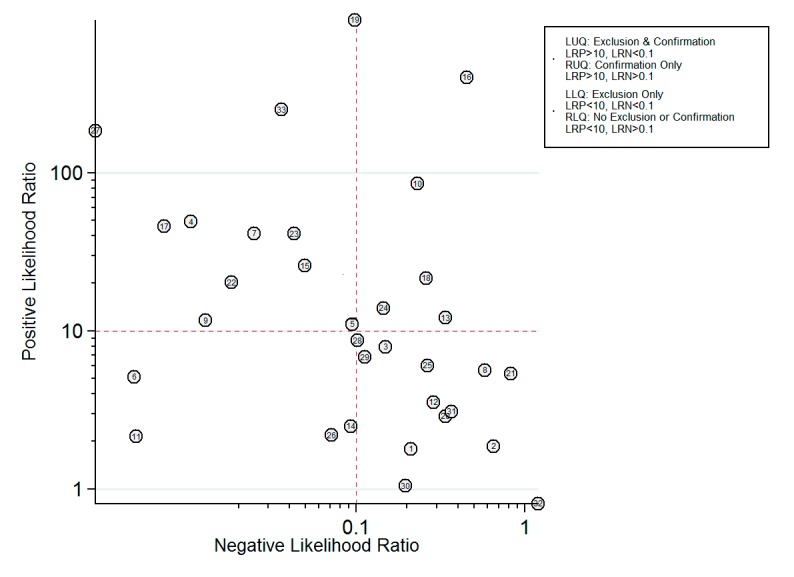
The likelihood matrix
Superior tools in the LUQ of the matrix include the study of van Gilis et al. [36], (#27 in ► Fig. 2). This study preselected ICU patients who already had high clinical probability to develop drastically different outcomes. van Gils et al. used artificial neural networks and self-organizing maps to analyze data obtained from pulmonary arterial catheters, including pulmonary catheter wedge pressure, cardiac index and other hemodynamic measures [36]. The investigators found an average LR+ of 185 (142.47 to 240.22) and an average LR- of < 0.01. The self-organizing maps employed the unique opportunity of applying complex vectorial data to direct physiological numbers, obtained through invasive methods. Another exceptional ESS tool was described in Gharaviri et al. [38], (#33 in ► Fig. 2), with an average LR+ 250.71 (50.60 to 1242.2) and an average LR- of 0.04 (< 0.01 to 0.55). This study employed adaptive neuro-fuzzy interface system to detect myocardial ischemia from electro-cardiographic data [38].
A study from the author’s institution, Herasevich et al. [18], (#6 in ► Fig. 2), was useful for the exclusion, but not diagnosis, of ventilator induced lung injury (VILI). The average LR+ was 5.11 (3.79 to 6.90) and the average LR- was < 0.01 (< 0.01 to 0.08). The tool incorporated a combination of arterial blood gas, ventilator and chest x-ray results and Boolean logic to alert providers that the patient was at risk for VILI, but was not sufficiently specific to “rule in” VILI.
The study of Claridge et al. [27], (#16 in ► Fig. 2) is representative of studies in the RUQ of the matrix, where the ESS tool can rule-in, but cannot effectively rule out disorders. This ESS tool evaluated the odds of nosocomial infection, and had an average LR+ of 400.95 (55.44 to 2899.8) which means that it can increase the pre-test clinical odds of having a central line blood stream infection or ventilator-associated pneumonia by 400 times. However, the LR- was 0.45 (0.32 to 0.63), indicating low capacity for ruling out nosocomial infection.
Studies in the RLQ of the matrix represent tools with suboptimal diagnostic capabilities for either ruling in, or ruling out disorders of interest. For example, the study of Aboukhalil et al. [39], (#32 in ► Fig. 2), undertook the difficult task of reducing false alarms from electrocardiographic monitoring in the ICU. With such challenging topic, it is unsurprising that the study had an average LR+ of 1.19 (1.15 to 1.24) and an average LR- 0.81 (0.77 to 0.84).
Discussion
Substantial variability was seen in the diagnostic capabilities of ESS systems. The identified lack of diagnostic consistency of the ESS surveillance systems from our study is concordant with the findings of Govindan et al., who described similar variability in the diagnostic performance of harm detection surveillance systems [44].
The likelihood matrix (► Fig. 2) is a helpful aid in understanding the ways in which the heterogeneous ESS systems can aid clinical decision-making in a meaningful way. The likelihood ratio is particularly important for summarizing diagnostic accuracy and is more directly applicable to the clinical environment [45]. The LLQ section of the graph identifies a subgroup of surveillance systems with enhanced diagnostic capabilities in excluding clinical entities or syndromes [18, 21, 25, 40]. Given a patient with a pretest probability of less than 50%, the application of Bayes’ theorem would allow a negative test to reduce post-test probability to less than 1%. In a similar fashion the clustered studies in the RUQ of ► Fig. 2, represent tools with high positive likelihood ratios and low negative likelihood ratios, useful for “ruling in” a diagnostic entity. The tools clustered on the LUQ of the likelihood matrix in ► Fig. 2 are the ones with the best combined diagnostic performance in both confirming and excluding clinical scenarios. Finally, a significant percentage of ESS tools aggregated in the RLQ of the likelihood matrix, which is an area for suboptimal tests in both confirming and excluding clinical entities or syndromes. ESS systems should be evaluated and used in a manner equivalent to diagnostic tests used in everyday clinical practice.
The fundamental question about ESS is “do ESS systems have the ability to improve the quality of care?” The answer would seem to be a priori positive, given that computers are readily available to handle large quantities of data cheaply and without error. Electronic decision support should be able to supplement provider’s diagnostic and therapeutic decisions, but optimal tool for the right person is still a work in progress. The five rights of medication safety may be extrapolated to a “five rights” of a computerized decision support system, e.g. “the right patient, the right problem, the right tool, the right time and the right route” [46]. More importantly, ESS systems can assume the role of realtime “sniffers”, notifying providers when time-sensitive conditions [47] are occurring and avoid catastrophic failures to rescue because of failures to recognize. The heterogeneity found in this review seems to indicate that in many areas, this potential has as of yet to be fully realized.
The most significant limitation of the present systematic review is the narrow selection of studies comparing ESS systems with the gold standard. Several high quality studies were excluded because of their use of a different comparator, such as patient outcomes or cost of care, and thus were excluded from this review. A second limitation is that the high heterogeneity between the selected studies rendered reaching an overall, pooled diagnostic performance, inappropriate. This heterogeneity, confirms the opinions and findings of other authors, highlights the wide variety of ESS systems [10, 44] and reflects the anticipated diversity of clinical entities and syndromes. A final limitation is the exclusion of pediatric studies. None of the authors has significant experience with pediatric acute care, and did not feel qualified to critically appraise this body of literature.
Strengths of this study include the comprehensive literature search, the analytical review of the included studies and the performance of calculations to obtain missing diagnostic indices. The extensive final database contains more than a hundred thousand diagnostic decision support points (► Table 2). Moreover, this study offers a subtle, yet clear message. Several studies located in the RLQ of the likelihood matrix, with inferior diagnostic capacities to rule in disorders, delivered alerts to practitioners. However, systems located in the LLQ of the matrix, may still have diagnostic value in aiding the exclusion of catastrophic disorders or they can be utilized as tools for screening and enrollment of eligible patients in clinical investigations. For example, a study that wants to enroll patients who have not yet developed, and are at risk for developing ventilator-induced lung injury, may utilize an ESS tool which has superior capabilities in excluding this disorder [47].
We recommend that the output of ESS systems should be approached in the same manner as any other results of diagnostic tests, such as laboratory or radiologic results. Explanations of their significance, based on likelihood ratio performance, should be readily available to the bedside provider, explaining the diagnostic strength in ruling in or ruling out disorders and the severity of the result [positive, negative, critical]. ESS-generated alerts can be carefully crafted to follow the same triage notification mechanism for critical laboratory results. Care should be taken when setting thresholds to send alerts, in order to avoid “alarm fatigue” [48].
The benefits of optimally functioning ESS systems can be substantial for individual patients and the broader community. The incentives from the HITECH act and the meaningful use momentum, create unique opportunities [4] in terms of regulation, guideline development and application of future state-of-the-art electronic syndromic surveillance systems. In the present study, by providing a bird-eye’s view and classifying the several different ESS systems based on their diagnostic performance, we deliver further insight for the meaningful use of those systems in the everyday clinical practice.
Conclusion
When taken together, our results suggest that there is a wide spectrum of diagnostic ESS systems capabilities. This high heterogeneity reflects the diversity of clinical entities and syndromes, as well as the diversity of the respective systems’ performance. ESS data can be employed in a manner similar to radiologic and laboratory tests and this could guide the presentation and regulation of ESS systems. The visual classification of these systems in the likelihood matrix is a conceptual benefit, which can aid their clinical application and interpretation. Based on our knowledge, this is the first study to suggest this framework for ESS systems. Clinical decision support committees, journals and developers, having frontline practitioners in mind, could consider adopting the likelihood matrix framework early on in the development, appraisal and application of their systems.
Conflict of Interest Statement
All authors report no research grants or conflicts of interest exist for this stud
Human Subjects Statement
The present study was exempt by the institutional review board. It is a systematic review of the literature and did not involve any human subjects.
Author Contributions
Drs. Markos Kashiouris and John O’Horo had full access to the data and take responsibility for the data integrity and analysis.
Study Concept and Design: Dr. Vitaly Herasevich and Dr. Brian Pickering
Collection and Management of Data: Drs. Vitaly Herasevich, Markos Kashiouris and John O’Horo.
Preparation, review of the Manuscript: Vitaly Herasevich, Markos Kashiouris, John O’Horo and Dr.
Brian Pickering
Grant Number: N/A
Supplementary Material
Acknowledgements
The authors thank Patricia J. Erwin, librarian for constructing the search strategy.
References
- 1.Langmuir AD. The surveillance of communicable diseases of national importance. N Engl J Med 1963; 268: 182-192 [DOI] [PubMed] [Google Scholar]
- 2.Teutsch SM, Thacker SB. Planning a public health surveillance system. Epidemiol Bull 1995; 16: 1-6 [PubMed] [Google Scholar]
- 3.Chaudhry B, et al. Systematic review: impact of health information technology on quality, efficiency, and costs of medical care. Ann Intern Med 2006; 144: 742-752 [DOI] [PubMed] [Google Scholar]
- 4.Lenert L, Sundwall DN. Public health surveillance and meaningful use regulations: a crisis of opportunity. Am J Public Health 2012; 102: e1-e7 [DOI] [PMC free article] [PubMed] [Google Scholar]
- 5.Moher D, Liberati A, Tetzlaff J, Altman DG. Preferred reporting items for systematic reviews and metaanalyses: the PRISMA statement. Ann Intern Med 2009; 151: 264-269, W64 [DOI] [PubMed] [Google Scholar]
- 6.Higgins JPT, Green S, Cochrane Collaboration. Cochrane handbook for systematic reviews of interventions. Chichester, England; Hoboken, NJ: Wiley-Blackwell; 2008 [Google Scholar]
- 7.Martus P. A measurement model of disease severity in absence of a gold standard. Methods Inf Med 2001; 40: 265-271 [PubMed] [Google Scholar]
- 8.Fàbregas N, et al. Clinical diagnosis of ventilator associated pneumonia revisited: comparative validation using immediate post-mortem lung biopsies. Thorax 1999; 54: 867-873 [DOI] [PMC free article] [PubMed] [Google Scholar]
- 9.Dwamena BA. MIDAS: A program for Meta-analytical Integration of Diagnostic Accuracy Studies in Stata. Division of Nuclear Medicine, Department of Radiology, University of Michigan Medical School, Ann Arbor, Michigan; 2007 [Google Scholar]
- 10.Berlin A, Sorani M, Sim I. A taxonomic description of computer-based clinical decision support systems. J Biomed Inform 2006; 39: 656-667 [DOI] [PubMed] [Google Scholar]
- 11.Whiting P, Harbord R, Kleijnen J. No role for quality scores in systematic reviews of diagnostic accuracy studies. BMC Med Res Methodol 2005; 5: 19. [DOI] [PMC free article] [PubMed] [Google Scholar]
- 12.Hooper MH, et al. Randomized trial of automated, electronic monitoring to facilitate early detection of sepsis in the intensive care unit. Crit Care Med 2012; 40: 2096-2101 [DOI] [PMC free article] [PubMed] [Google Scholar]
- 13.Azzam HC, et al. Validation study of an automated electronic acute lung injury screening tool. J Am Med Inform Assoc 2009; 16: 503-508 [DOI] [PMC free article] [PubMed] [Google Scholar]
- 14.Koenig HC, et al. Performance of an automated electronic acute lung injury screening system in intensive care unit patients. Crit Care Med 2011; 39: 98-104 [DOI] [PubMed] [Google Scholar]
- 15.Schmickl CN, et al. Decision support tool for early differential diagnosis of acute lung injury and cardiogenic pulmonary edema in medical critically ill patients. Chest 2012; 141: 43-50 [DOI] [PMC free article] [PubMed] [Google Scholar]
- 16.Garcia-Esquirol O, et al. Validation of an automatic continuous system to detect expiratory asynchronies during mechanical ventilation. Intensive Care Medicine 2010; 36: S349 [Google Scholar]
- 17.Mojoli F, et al. Automatic detection of patient-ventilator asynchronies during pressure support ventilation. Intensive Care Medicine 2010; 36: S111 [Google Scholar]
- 18.Herasevich V, et al. Limiting ventilator-induced lung injury through individual electronic medical record surveillance. Crit Care Med 2011; 39: 34-39 [DOI] [PubMed] [Google Scholar]
- 19.Slooter AJC, et al. Seizure detection in adult ICU patients based on changes in EEG synchronization likelihood. Neurocritical Care 2006; 5: 186-192 [DOI] [PubMed] [Google Scholar]
- 20.Kho A, et al. Utility of commonly captured data from an EHR to identify hospitalized patients at risk for clinical deterioration. AMIA Annu Symp Proc 2007; Annual Symposium Proceedings/AMIA Symposium.: 404-408 [PMC free article] [PubMed] [Google Scholar]
- 21.Pokorny L, et al. Automatic detection of patients with nosocomial infection by a computer-based surveillance system: A validation study in a general hospital. Infection Control and Hospital Epidemiology. 2006; 27: 500-503 [DOI] [PubMed] [Google Scholar]
- 22.Leth RA, Moller JK. Surveillance of hospital-acquired infections based on electronic hospital registries. J Hosp Infect 2006; 62: 71-79 [DOI] [PubMed] [Google Scholar]
- 23.Bellini C, et al. Comparison of automated strategies for surveillance of nosocomial bacteremia. Infection Control & Hospital Epidemiology 2007; 28: 1030-1035 [DOI] [PubMed] [Google Scholar]
- 24.Schurink CAM, et al. A Bayesian decision-support system for diagnosing ventilator-associated pneumonia. Intensive Care Medicine 2007; 33: 1379-1386 [DOI] [PubMed] [Google Scholar]
- 25.Woeltje KF, et al. Automated surveillance for central line-associated bloodstream infection in intensive care units. Infection Control & Hospital Epidemiology 2008; 29: 842-846 [DOI] [PMC free article] [PubMed] [Google Scholar]
- 26.Klompas M, Kleinman K, Platt R. Development of an algorithm for surveillance of ventilator-associated pneumonia with electronic data and comparison of algorithm results with clinician diagnoses. Infection Control & Hospital Epidemiology 2008; 29: 31-37 [DOI] [PubMed] [Google Scholar]
- 27.Claridge JA, et al. Who is monitoring your infections: shouldn’t you be? Surg Infect 2009; 10: 59-64 [DOI] [PMC free article] [PubMed] [Google Scholar]
- 28.Wright MO, Komutanon V, Peterson LR, Robicsek A. Automated central line-associated bloodstream infection surveillance. American Journal of Infection Control 2009; 37: E176 [Google Scholar]
- 29.McGrane T, et al. Electronic SIRS alert facilitating recognition of sepsis by housestaff. Crit Care Med 2010; 38: A170 [Google Scholar]
- 30.Koller W, et al. Electronic surveillance of healthcare-associated infections with MONI-ICU – a clinical breakthrough compared to conventional surveillance systems. Stud Health Technol Inform 2010; 160: 432-436 [PubMed] [Google Scholar]
- 31.Hota B, et al. Electronic algorithmic prediction of central vascular catheter use. Infection Control & Hospital Epidemiology 2010; 31: 4-11 [DOI] [PubMed] [Google Scholar]
- 32.Thiel SW, et al. Early prediction of septic shock in hospitalized patients. J Hosp Med 2010; 5: 19-25 [DOI] [PubMed] [Google Scholar]
- 33.Choudhuri JA, et al. An electronic catheter-associated urinary tract infection surveillance tool. Infection Control & Hospital Epidemiology 2011; 32: 757-762 [DOI] [PubMed] [Google Scholar]
- 34.Woeltje KF, et al. Electronic surveillance for healthcare-associated central line-associated bloodstream infections outside the intensive care unit. Infection Control & Hospital Epidemiology 2011; 32: 1086-1090 [DOI] [PubMed] [Google Scholar]
- 35.Bouzbid S, et al. Automated detection of nosocomial infections: evaluation of different strategies in an intensive care unit 2000-2006. J Hosp Infect 2011; 79: 38-43 [DOI] [PubMed] [Google Scholar]
- 36.van Gils M, et al. Using artificial neural networks for classifying ICU patient states. IEEE Eng Med Biol Mag 1997; 16: 41-47 [DOI] [PubMed] [Google Scholar]
- 37.Helfenbein ED, et al. An algorithm for continuous real-time QT interval monitoring. J Electrocardiol 2006; 39: S123-S127 [DOI] [PubMed] [Google Scholar]
- 38.Gharaviri A, Teshnehlab M, Moghaddam HA. Ischemia detection via ECG using ANFIS. Conf Proc IEEE Eng Med Biol Soc 2008; 2008: 1163-1166 [DOI] [PubMed] [Google Scholar]
- 39.Aboukhalil A, et al. Reducing false alarm rates for critical arrhythmias using the arterial blood pressure waveform. Journal of Biomedical Informatics 2008; 41: 442-451 [DOI] [PMC free article] [PubMed] [Google Scholar]
- 40.Jonsbu J, et al. Prospective evaluation of an EDB-based diagnostic program to be used in patients admitted to hospital with acute chest pain. Eur Heart J 1993; 14: 441-446 [DOI] [PubMed] [Google Scholar]
- 41.Kennedy RL, et al. An artificial neural network system for diagnosis of acute myocardial infarction (AMI) in the accident and emergency department: evaluation and comparison with serum myoglobin measurements. Comput Methods Programs Biomed 1997; 52: 93-103 [DOI] [PubMed] [Google Scholar]
- 42.Eshelman LJ, et al. Development and evaluation of predictive alerts for hemodynamic instability in ICU patients. AMIA Annu Symp Proc 2008; 379-383 [PMC free article] [PubMed] [Google Scholar]
- 43.Lorenzoni R, et al. A computer protocol to evaluate subjects with chest pain in the emergency department: a multicenter study. J Cardiovasc Med (Hagerstown) 2006; 7: 203-209 [DOI] [PubMed] [Google Scholar]
- 44.Govindan M, et al. Automated detection of harm in healthcare with information technology: a systematic review. Qual Saf Health Care 2010; 19: e11. [DOI] [PubMed] [Google Scholar]
- 45.Deeks JJ, Altman DG. Diagnostic tests 4: likelihood ratios. BMJ 2004; 329: 168-169 [DOI] [PMC free article] [PubMed] [Google Scholar]
- 46.HIMSS. Overview of CDS five rights. AHRQ; 2009[updated 2009; cited 2012 09/05/2012]; Available from:http://healthit.ahrq.gov/images/mar09_cds_book_chapter/CDS_MedMgmnt_ch_1_sec_2_five_rights.htm
- 47.Herasevich V, et al. Informatics infrastructure for syndrome surveillance, decision support, reporting, and modeling of critical illness. Mayo Clin Proc 2010; 85: 247-254 [DOI] [PMC free article] [PubMed] [Google Scholar]
- 48.Embi PJ, Leonard AC. Evaluating alert fatigue over time to EHR-based clinical trial alerts: findings from a randomized controlled study. JAMIA 2012; 19: e145-e148 [DOI] [PMC free article] [PubMed] [Google Scholar]
Associated Data
This section collects any data citations, data availability statements, or supplementary materials included in this article.