

Abstract
Objective:
We examined the incidence of mild cognitive impairment (MCI) and its potential vascular risk factors in a prospective population-based study.
Methods:
An age-stratified random population-based cohort (baseline n = 1,982), followed for up to 4 years, was annually assessed for cognitive and everyday functioning. Incidence rates were calculated for both cognitive (neuropsychological [NP]-MCI) and functional (Clinical Dementia Rating [CDR] = 0.5) definitions of MCI. Several measures of vascular, metabolic, and inflammatory risk were assessed at baseline. Risk factor analyses used interval censoring survival models, followed by joint modeling of both MCI and attrition due to mortality and illness.
Results:
Incidence rates for NP-MCI and CDR = 0.5 were 95 and 55 per 1,000 person-years. In individual joint models, risk factors for NP-MCI were diabetes and adiposity (waist: hip ratio), while APOE ε4 genotype and heart failure increased risk of attrition. Adiposity, stroke, heart failure, and diabetes were risk factors for nonamnestic MCI. For CDR = 0.5, risk factors were stroke and heart failure; heart failure and adiposity increased risk of attrition. In multivariable joint models combining all risk factors, adiposity increased risk of NP-MCI, while stroke and heart failure increased risk for CDR = 0.5. Current alcohol use appeared protective against all subtypes.
Conclusion:
Incidence of MCI increased with age regardless of definition and did not vary by sex or education. Several vascular risk factors elevated the risk of incident MCI, whether defined cognitively or functionally, but most were associated with nonamnestic MCI and CDR = 0.5. Controlling vascular risk may potentially reduce risk of MCI.
Mild cognitive impairment (MCI) is a cognitive state intermediate between normal cognitive aging and dementia, a definition implying neither a specific outcome nor a specific etiology. In specialty clinical settings, where MCI is typically an early manifestation of progressive neurodegenerative disorders such as Alzheimer disease (AD), it progresses to dementia at an annual rate of 10%–15%.1 At the population level, MCI is identified not by patients seeking care but by systematic assessment of defined samples; here, the majority remain mildly impaired, some progress to dementia, while others improve or even revert to normal. Like prevalence, outcomes of MCI vary according to its definition.2–7
Clearly, “source matters.”8 MCI at the population level is more heterogeneous than MCI in the specialty clinic, where there may be less vascular comorbidity. In community studies, several vascular factors are associated with concurrent cognition and MCI, and predict progression to cognitive decline, dementia, and brain changes9–12; the most common neuropathologic picture is mixed vascular and degenerative disease.13
There is minimal literature on vascular risk factors for incident MCI,14–16 based on prospective follow-up of initially healthy individuals. Prospective studies suffer inevitable attrition, with some participants dropping out before they can develop MCI. Attrition itself can be a source of bias due to competing risks, if the same factors elevate both risk of MCI and likelihood of attrition.6,17,18
From a population-based cohort study of older adults, we report 1) the incidence of MCI in previously normal older adults and 2) the associations of several premorbid vascular risk factors with incident MCI, adjusting for attrition bias by jointly modeling MCI and attrition.19,20
METHODS
Study site and population.
Our study cohort, the Monongahela-Youghiogheny Healthy Aging Team, is an age-stratified random population sample drawn from the publicly available voter registration lists for a small-town region of Pennsylvania.21
Standard protocol approvals, registrations, and consents.
Community outreach, recruitment, and assessment protocols were approved by the University of Pittsburgh institutional review board for protection of human subjects. All participants provided written informed consent.
Recruitment criteria were age 65 years or older, living within the selected towns, and not already in long-term care institutions. Individuals were ineligible if they were too ill to participate, had severe vision or hearing impairments, or were decisionally incapacitated. We recruited 2,036 individuals over a 2-year period. Since the project was designed to study MCI, we screened out those who exhibited substantial impairment by scoring <21/30 on the age- and education-corrected Mini-Mental State Examination.22,23 The remaining 1,982 individuals were representative of older adults in the targeted communities (mean [SD] age 77.6 [7.4] years; 61.1% women; 94.8% of mixed European descent; median educational level of high school graduate).21 They underwent a detailed in-home assessment including, but not limited to, the elements below.
Assessments.
At baseline and at each annual data collection cycle, we assessed cognitive functioning using a comprehensive test battery tapping the cognitive domains of attention/processing speed, executive function, memory, language, and visuospatial functions. For each domain, we created a composite score (mean age- and education-adjusted Z score).4 We also assessed several aspects of everyday cognitively driven functioning to rate participants on the Clinical Dementia Rating (CDR) scale.4,24
Mild cognitive impairment definitions.
At each data collection wave, we classified participants as to the presence of MCI according to a purely cognitive classification4 and the purely functional CDR,24,25 disregarding previous years' classifications of the same individuals.
Cognitive classification.
We classified individuals as cognitively normal if all of their cognitive domain scores fell within 1.0 SD of the appropriate mean, based on our previously published norms21; as severely cognitively impaired if 2 or more domain scores fell 2 or more SDs below the appropriate mean; and as MCI if one or more scores fell 1.0 SD below the mean without meeting criteria for severe cognitive impairment.4 We further classified cognitive (neuropsychologically defined) MCI (NP-MCI) into amnestic and nonamnestic subtypes based on the presence or absence of memory impairment.4 At baseline (cycle 1), of 1,982 participants assessed, 697 (35.1%) were classified as prevalent MCI, 54 (2.7%) as severely cognitively impaired, and 41 (1.2%) as having insufficient cognitive data for classification; 1,190 (60%) were cognitively normal and thus at risk for future incident NP-MCI.
Clinical Dementia Rating.
Based solely on cognitively driven functional decline, independent of neuropsychological test scores, we designated as MCI those participants who received CDR ratings of 0.5.24,25 At baseline, 546 (27.8%) were rated as mildly impaired (CDR = 0.5), 23 (1.2%) as having at least mild dementia (CDR ≥ 1), and 1,413 (71.3%) as normal (CDR = 0) and thus at risk for incident functional MCI (CDR = 0.5).
Incidence.
During the 4 annual follow-up assessments (cycles 2–5), incident NP-MCI cases were those who transitioned to NP-MCI from normal cognition at baseline, and incident CDR = 0.5 cases were those who progressed to CDR = 0.5 from baseline CDR = 0.
We excluded 5 incident cases who progressed directly from normal cognition to severe cognitive impairment and 4 incident cases who progressed directly from CDR = 0 to CDR ≥1 without being observed at the MCI state.
We censored observation at the point when participants were classified as incident cases. However, since the study is ongoing, we have follow-up data on some individuals beyond their development of MCI. We are thus able to identify “fluctuators” whose MCI status subsequently reverted to normal cognition (n = 186) or CDR = 0 (n = 49). Since they were likely contributing to MCI heterogeneity, we removed them from the incidence and risk factor analyses reported here. In post hoc analyses, we repeated the analyses including these fluctuators.
Potential baseline vascular risk factors.
Potential baseline vascular risk factors are detailed in table 1.
Table 1.
Vascular/metabolic/inflammatory risk variables
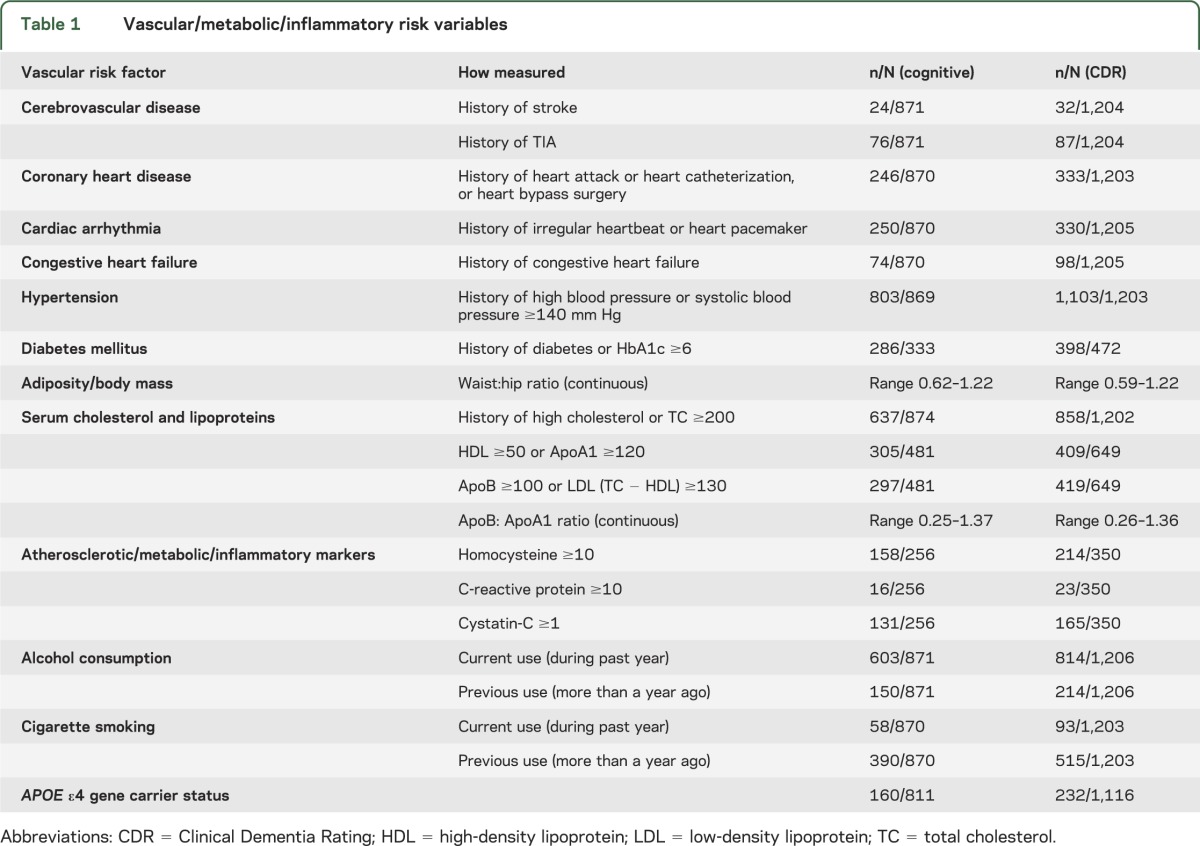
History.
We asked participants about health history using a standardized questionnaire for each item, i.e., “Has a health care professional ever told you that you had ____ (stroke, TIA, heart attack/myocardial infarction, congestive heart failure, irregular heart rhythm, diabetes mellitus, high blood pressure/hypertension, high cholesterol?).” We asked whether they had ever undergone heart pacemaker insertion, heart catheterization, or coronary bypass surgery, and about current and past smoking and alcohol consumption. Self-reported health history, typical of population surveys, is sufficiently reliable in cognitively intact individuals; we lacked medical record information to confirm self-report and neuroimaging data to identify silent infarcts.
Examination.
The physical examination protocol in all participants included measurement of systolic and diastolic blood pressure in mm Hg and measurement of waist and hip circumference in inches. We calculated waist:hip ratio (WHR), a measure of central adiposity26 that, unlike body mass index (BMI), does not require the individual to stand on a scale to be weighed or stand fully upright to have height measured.
Laboratory tests.
We requested all participants, with specific informed consent, to provide nonfasting blood samples for measurement of cholesterol, for APOE ε4 genotyping, and for banking for unspecified future tests related to aging and health. We assayed total cholesterol (TC) and high-density lipoprotein (HDL) cholesterol, calculating low-density lipoprotein (LDL) cholesterol as (TC − HDL).
To examine vascular risk in finer-grained detail, we conducted an exploratory study of 6 vascular/metabolic/inflammatory markers: ApoA1 (the lipoprotein for HDL cholesterol), ApoB (the lipoprotein for LDL cholesterol),27 cystatin-C (a measure of glomerular function that is unaffected by race, sex, muscle mass, or diet, and in older adults primarily reflects atherosclerotic burden),28 HbA1c (glycosylated hemoglobin, which measures glycemic control over the preceding 3 months),29 homocysteine (an amino acid whose elevation is associated with atherosclerosis),30 and C-reactive protein (an inflammatory marker also associated with atherosclerosis).31 These assays were performed at baseline in banked serum specimens drawn from a randomly selected subgroup of 559 participants with and without MCI. Here we include data from the 257 of them who had baseline normal cognition or CDR = 0 and at least one follow-up, acknowledging that the resulting models would have limited power to detect small effects.
Tracking and attrition.
We contacted participants by telephone every 3 months to ascertain their status and update key information between annual visits. We excluded from these analyses the early dropouts who were lost to follow-up after their baseline assessment and contributed no follow-up data. Those lost after at least one follow-up assessment, due to death or illness, were designated as informative dropouts, while dropouts for other reasons (e.g., relocation) were designated as random dropouts. As expected, the early dropouts and the informative dropouts were older, more likely to have MCI at baseline, and more likely to have more vascular risk factors, than the random dropouts and those who continued to participate (table e-1 on the Neurology® Web site at www.neurology.org).
Statistical analyses.
Incidence rates for NP-MCI and CDR = 0.5 were estimated per 1,000 person-years of follow-up, by age, overall, separately for men and women, for 3 educational levels, and separately for amnestic and nonamnestic MCI (figure, table e-2), using statistical software STATA v.12.
Figure. Mild cognitive impairment incidence rate by sex and by education.

Age-specific mild cognitive impairment (MCI) incidence rate (per 1,000 person-years) for the overall sample, and by sex and education, as defined by neuropsychological classification (A and B) and Clinical Dementia Rating (C and D).
Risk modeling.
Risk modeling is detailed in tables 2–4.
Table 2.
Individual vascular risk factors for incidence of neuropsychologically defined mild cognitive impairment
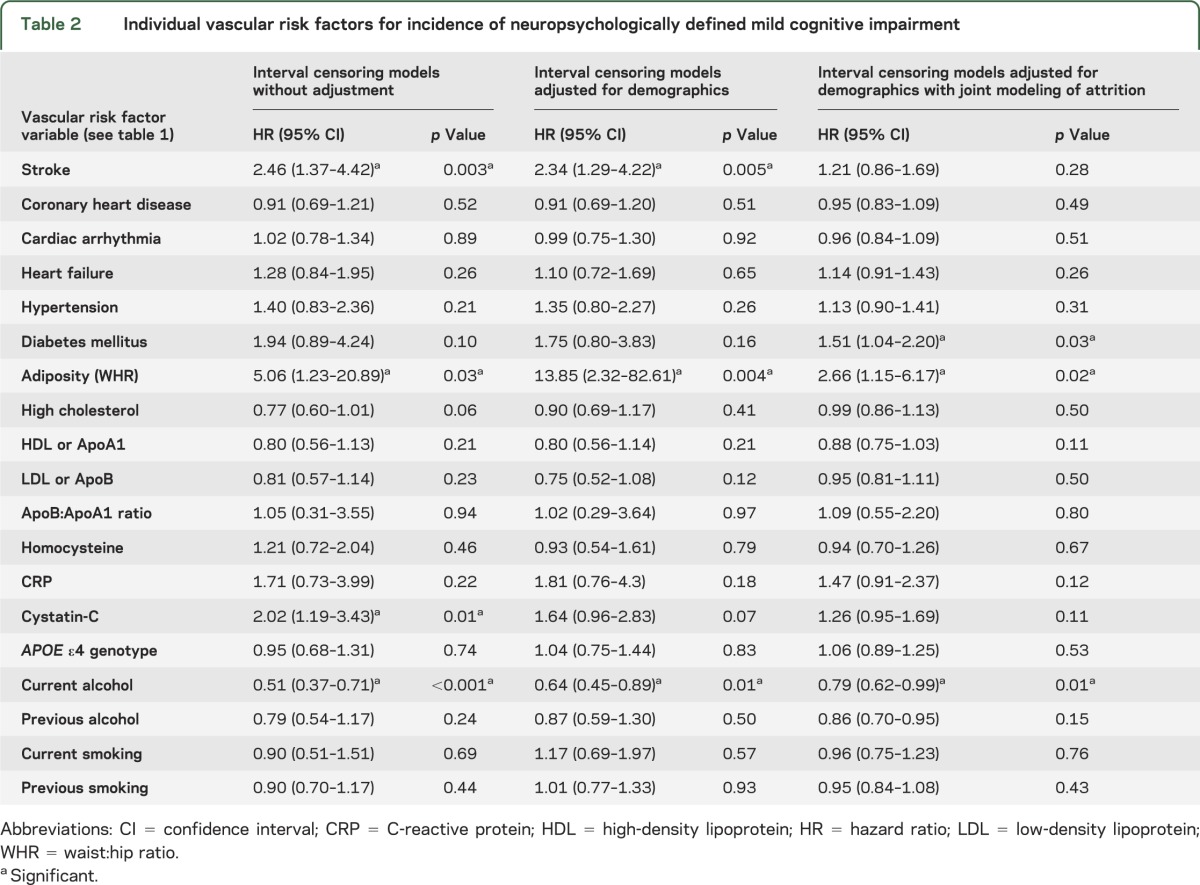
Table 3.
Individual vascular risk factors for incidence of functionally defined mild cognitive impairment (CDR = 0.5)
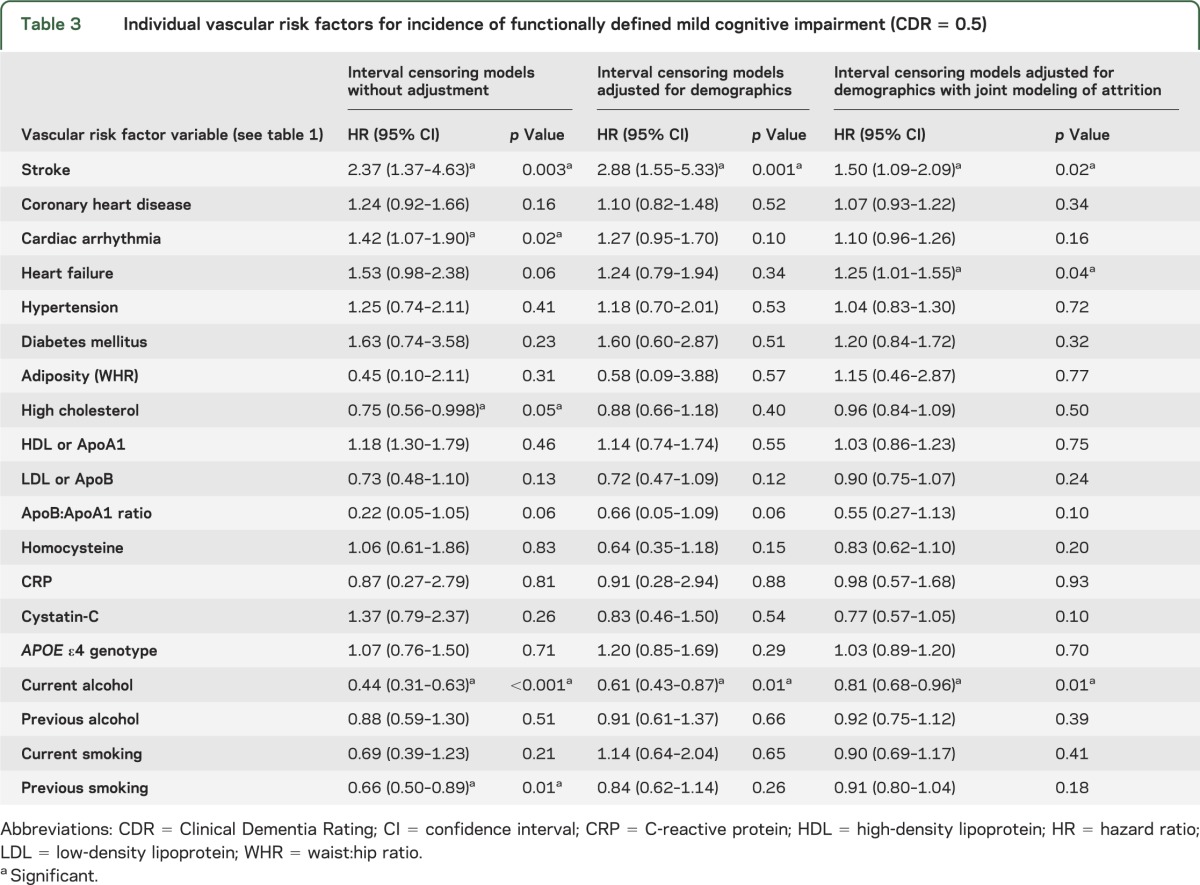
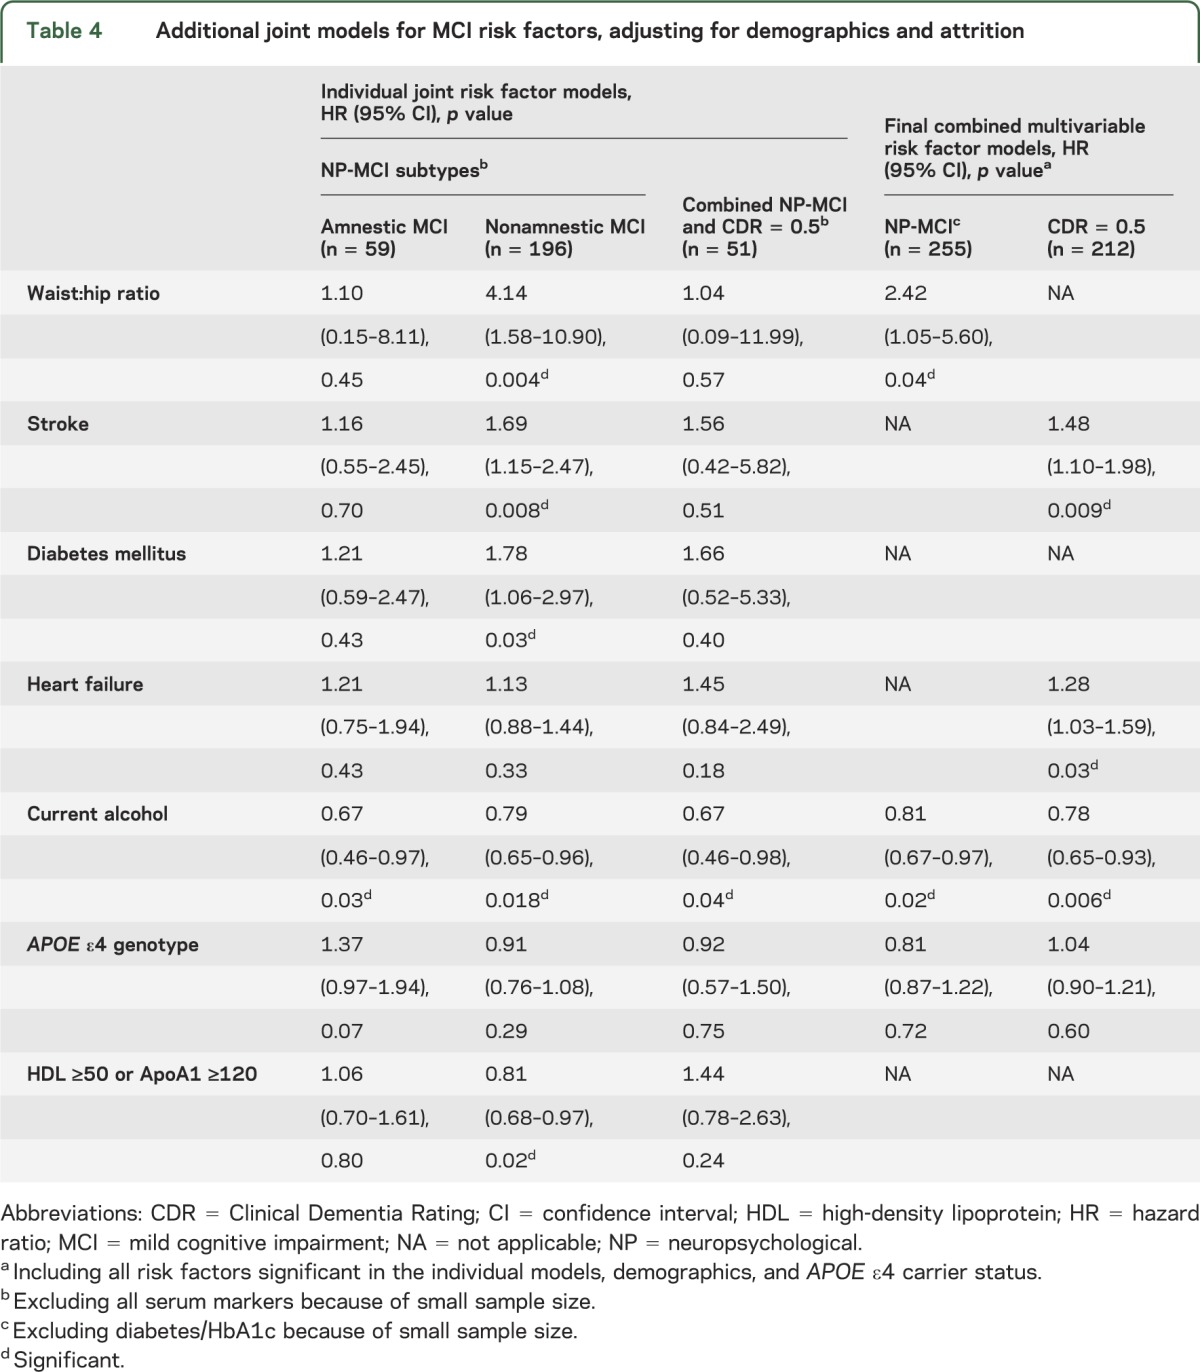
Table 4.
Additional joint models for MCI risk factors, adjusting for demographics and attrition
Rather than a specific date of onset of MCI, we have the assessment cycle when incident MCI was first detected. Therefore, we employed interval censoring survival models32 to identify the hazard ratio for incident cognitive impairment associated with each risk factor, using statistical software SAS v. 9.2. We first fit individual models unadjusted for covariates, and then adjusted for demographics (age, sex, education) (tables 2 and 3).
Next, using joint modeling,19,20 we simultaneously modeled risks of MCI and attrition, thereby adjusting for potential bias due to the same risk factor influencing the hazards of both MCI and attrition. For each risk factor, we fit individual joint models for NP-MCI, CDR = 0.5, and combined NP-CDR MCI (tables 2 and 3). Where significant associations were found, we included interaction terms for risk factor × demographic factor (age, sex, education). We also fit separate models for incident amnestic and nonamnestic MCI (table 4).
Finally, we fit combined multivariable joint models for NP-MCI and CDR = 0.5, including all variables significant in the individual models, adjusting for demographics and APOE ε4 genotype (table 4).
To identify risk factors independently associated with attrition from death or illness, we also fit joint models including variables found associated with attrition in a separate backward selection model.
In post hoc analyses, we refit the joint models for NP-MCI, amnestic MCI, nonamnestic MCI, and CDR = 0.5 including the “fluctuators” who subsequently reverted to normal.
RESULTS
Over 4 annual assessments (cycles 2–5), 255 individuals (24.9%) developed incident NP-MCI, while 346 (33.41%) were lost to follow-up. Based on 2,737.476 person-years of follow-up, the overall incidence rate for NP-MCI was 95 per 1,000 person-years. Similarly, 212 individuals (15.84%) developed incident CDR = 0.5, while 226 (16.57%) were lost to follow-up. Based on 3,909.261 person-years of follow-up, the overall incidence rate for CDR = 0.5 was 55 per 1,000 person-years. We also calculated age-specific incidence rates for subtypes and subgroups (figure, table e-2). Of 692 individuals normal at baseline in both cognition and CDR, 51 participants developed both incident NP-MCI and CDR = 0.5.
Risk and protective factors for cognitively defined NP-MCI.
In the individual models (table 2), unadjusted for demographics or attrition, we found stroke, WHR, and cystatin-C significantly increased risk, while current alcohol use reduced risk. After adjustment for demographics, cystatin-C lost statistical significance while stroke, WHR, and alcohol remained significant. With further adjustment for attrition bias (joint modeling), stroke lost significance, WHR and alcohol remained significant, and diabetes mellitus/HbA1c became a significant risk factor. No interactions with demographics were significant. Heart failure and APOE ε4 carrier status significantly increased risk of attrition (not in table).
In the final combined multivariable joint model (table 4) for NP-MCI, including all the covariates significant in the individual models, adjusting for demographics and APOE ε4 genotype, WHR increased risk while alcohol reduced risk.
For NP-MCI subtypes (table 4), the joint models revealed no significant risk factors for amnestic MCI, although APOE ε4 genotype approached significance. Risk of nonamnestic MCI was increased by stroke, diabetes, and WHR, and reduced by elevation of HDL or its lipoprotein ApoA1. Current drinking reduced risk for both subtypes.
Risk and protective factors for functionally defined MCI (CDR = 0.5).
In the unadjusted individual models (table 3), stroke and cardiac arrhythmia increased risk, while high cholesterol, current drinking, and previous smoking reduced risk. After adjustment for demographics, only stroke and current drinking remained significant. In the joint models, stroke, arrhythmia, and heart failure were significant risk factors, while alcohol remained significant (table 3).
When the models with significant associations were refit to include interaction terms for age × risk factor and sex × risk factor, the age × heart failure interaction was significant (hazard ratio [HR] 0.964, confidence interval [CI] 0.94–0.99, p = 0.017), i.e., the association between heart failure and CDR = 0.5 weakened with increasing age, with heart failure exerting no effect after age 81. Heart failure and WHR both significantly increased attrition risk (not in table).
In the final combined joint model including all the covariates significant in the individual models and adjusting for demographics and APOE ε4 genotype, stroke and heart failure increased risk while current drinking reduced risk (table 4).
Combined cognitive-functional MCI.
To explore risk associations for the incidence of combined NP-MCI and CDR = 0.5, with only 51 cases over 4 years, we included only the variables that were collected from all participants, as the subsample with data on serum markers was too small (n = 14). Adjusting for demographics and attrition, the only significant association was a protective effect for current alcohol use (table 4).
Post hoc analyses including “MCI fluctuators.”
Inclusion of “fluctuators,” who reverted to normal after developing MCI, resulted in an expanded sample in which the effects of vascular variables appeared diluted. For incident NP-MCI, no significant associations were found in the joint models. For amnestic MCI, risk was increased by APOE ε4 genotype (HR 1.47, CI 1.05–2.07, p = 0.03) and reduced by current drinking (HR 0.69, CI 0.48–0.99, p = 0.05). Stroke increased risk of nonamnestic MCI (HR 1.57, CI 1.12–2.20, p = 0.01) and CDR = 0.5 (HR 1.51, CI: 1.09–2.10, p = 0.014).
DISCUSSION
In a large population-based cohort of older adults, carefully characterized at enrollment and reassessed annually over 4 years of follow-up, MCI incidence rates increased with age and were unaffected by age and education. Our estimates were within the ranges reported by others,2 but we did not find sex differences, as others have done.33 Direct comparisons are precluded by the variation among studies in their precise operational definitions of MCI, although most definitions include both cognitive and functional components, which we separated for this study. NP-MCI had a higher incidence rate than functionally defined MCI (CDR = 0.5), consistent with a model of progressive disease in which objective cognitive impairment precedes clinically apparent functional impairment.34 Also consistent with this model, risk factors for vascular disease (diabetes and adiposity) predicted incidence of NP-MCI, while overt vascular disease with end-organ damage (stroke and heart failure) predicted incidence of CDR = 0.5 MCI. Only the relationship between heart failure and CDR = 0.5 weakened with age. No significant risk factors were found for amnestic MCI, which is often an early stage of AD. Small sample size may be relevant; the effect of the APOE ε4 genotype approached significance, and was significant when fluctuators were included, but APOE ε4 also increased risk of attrition. Nonamnestic MCI likely also includes early stages of vascular or mixed vascular-degenerative brain disease as well as nonprogressive conditions, potentially explaining the protective effect of HDL cholesterol. Possibly, individuals with stroke and heart failure also had physical impairments that exacerbated the functional impairment detected by the CDR. Current alcohol consumption appeared protective against all MCI definitions, potentially reflecting the known cardioprotective effects of moderate alcohol use35; previous drinking likely reflects those who quit drinking for health-related reasons with adverse cognitive consequences. Remarkably, adiposity as measured by WHR was the strongest risk factor for NP-MCI; abdominal obesity and diabetes are components of the metabolic syndrome, which increases risk of heart disease36 and AD risk.37,38 Adjustment of models for demographics and attrition weakened all the significant associations, suggesting that MCI and attrition share many common risk factors.6,17,18
Our prospective, population-based study used operational criteria to define MCI in 2 distinct and independent ways and simultaneously examined multiple vascular risk factors for incident MCI. Uniquely, we adjusted for attrition bias and possible competing risks through joint modeling. We also identified individuals whose cognitive status fluctuated after initial development of MCI. Their inclusion in the models appeared to dilute the findings, perhaps due to underlying conditions that themselves fluctuate or are transient, increasing etiologic heterogeneity. Measurement error can also occur in the detection of mild deficits, particularly when forcing inherently continuous variables like cognition and everyday functioning into discrete categories like MCI. For example, relatively small changes could shift individuals initially performing at the high end of the MCI range into the low end of the normal range, and vice versa. Longer follow-up of the cohort, and expansion of the exploratory study of serum markers, would increase power to detect smaller risk effects. Replication in more ethnically diverse cohorts would enhance external validity. Only cohort studies beginning in early adulthood can examine midlife risk factors and test for the nonlinear relationships of vascular factors previously observed with dementia in decades-long studies.9
Growing evidence suggests that, outside the specialty referral clinical setting, MCI is a heterogeneous entity with a range of outcomes,3 implying multiple etiologic factors. Numerous cross-sectional studies show that various vascular, metabolic, and inflammatory markers are concurrently associated with MCI and dementia, while longitudinal studies show that these factors predict cognitive decline and progression from MCI to dementia.9–12 Clusters of vascular risk factors, such as the metabolic syndrome36,38 and the stroke risk profile,11,39 have proven informative. A few previous studies have also reported vascular risk factors predicting the incidence of new-onset MCI in individuals who were previously cognitive intact.14–16 The underlying mechanisms likely involve both direct ischemic-hypoxic damage and interactions between vascular and degenerative pathology.
Taken together, the evidence seems incontrovertible that vascular factors contribute to the majority of cases of MCI in the population. Without detracting from critically important work in modifying the amyloid cascade of AD,40 focus must be expanded on potential clinical and public health impact of improved detection and control of vascular risk. As life expectancy improves for individuals with vascular disease, e.g., stroke survivors, the incidence of MCI and dementia will rise. Whether better management of vascular risk will reduce MCI, or prevent or delay progression of MCI to dementia, remains to be investigated.
Supplementary Material
ACKNOWLEDGMENT
The authors thank all MYHAT study personnel and participants for their contributions to the study and also the Chemistry and Nutrition Laboratory of the University of Pittsburgh Graduate School of Public Health.
GLOSSARY
- AD
Alzheimer disease
- BMI
body mass index
- CDR
Clinical Dementia Rating
- CI
confidence interval
- HDL
high-density lipoprotein
- HR
hazard ratio
- LDL
low-density lipoprotein
- MCI
mild cognitive impairment
- NP
neuropsychological
- TC
total cholesterol
- WHR
waist:hip ratio
Footnotes
Supplemental data at www.neurology.org
AUTHOR CONTRIBUTIONS
Dr. Ganguli was responsible for study supervision, concept, and design, acquisition of funding and data, interpretation of data, and writing of the manuscript. Mr. Fu was responsible for statistical analyses under the supervision of Dr. Chang, interpretation of the data, and critical revision of the manuscript for important intellectual content. Dr. Hughes was responsible for study coordination, creation of analytic datasets, interpretation of the data, and critical revision of the manuscript for important intellectual content. Dr. Snitz was responsible for neuropsychological input, interpretation of the data, and critical revision of the manuscript for important intellectual content. Dr. Chang was responsible for statistical analysis, supervision of Mr. Fu, interpretation of the data, and critical revision of the manuscript for important intellectual content.
STUDY FUNDING
Supported in part by grants R01 AG023651, K24 AG022035, and K23AG038479 from the National Institute on Aging, NIH, US DHHS.
DISCLOSURE
M. Ganguli is funded in part by grants AG023651 and K24 AG022035 from NIA. B. Fu is a graduate student supported in part by grant AG023651 from NIA. B.E. Snitz is funded in part by grants K23AG038479 and AG023651 from NIA. T. Hughes is funded by grant AG023651 from NIA. C.-C.H. Chang is funded in part by grant AG023651 from NIA. Go to Neurology.org for full disclosures.
REFERENCES
- 1.Petersen RC, Roberts RO, Knopman DS, et al. Mild cognitive impairment: ten years later. Arch Neurol 2009;66:1447–1455 [DOI] [PMC free article] [PubMed] [Google Scholar]
- 2.Ward A, Arrighi HM, Michels S, Cedarbaum JM. Mild cognitive impairment: disparity of incidence and prevalence estimates. Alzheimers Dement 2012;8:14–21 [DOI] [PubMed] [Google Scholar]
- 3.Mitchell AJ, Shiri-Feshki M. Rate of progression of mild cognitive impairment to dementia: meta-analysis of 41 robust inception cohort studies. Acta Psychiatr Scand 2009;119:252–265 [DOI] [PubMed] [Google Scholar]
- 4.Ganguli M, Chang C-CH, Snitz BE, et al. Prevalence of mild cognitive impairment by multiple classifications: the MYHAT Project. Am J Geriatr Psychiatry 2010;18:674–768 [DOI] [PMC free article] [PubMed] [Google Scholar]
- 5.Ganguli M, Snitz BE, Saxton JA, et al. Outcomes of mild cognitive impairment by definition: a population study. Arch Neurol 2011;68:761–767 [DOI] [PMC free article] [PubMed] [Google Scholar]
- 6.Lopez OL, Becker JT, Chang Y-F, et al. Incidence of mild cognitive impairment in the Pittsburgh Cardiovascular Health Study–Cognition Study. Neurology 2012;79:1599–1606 [DOI] [PMC free article] [PubMed] [Google Scholar]
- 7.Farias ST, Mungas D, Reed BR, et al. Progression of mild cognitive impairment to dementia in clinic vs community-based cohorts. Arch Neurol 2009;66:1151–1157 [DOI] [PMC free article] [PubMed] [Google Scholar]
- 8.Petersen RC. Does the source of subjects matter? Absolutely! Neurology 2010;74:1754–1755 [DOI] [PubMed] [Google Scholar]
- 9.Duron E, Hanon O. Vascular risk factors, cognitive decline, and dementia. Vasc Health Risk Manag 2008:4:363–381 [DOI] [PMC free article] [PubMed] [Google Scholar]
- 10.Sahathevan R, Brodtmann A, Donnan GA. Dementia, stroke, and vascular risk factors: a review. Int J Stroke 2012;7:61–73 [DOI] [PubMed] [Google Scholar]
- 11.Unverzagt FW, Ogunniyi A, Taler V, et al. Incidence and risk factors for cognitive impairment no dementia and mild cognitive impairment in African Americans. Alzheimer Dis Assoc Disord 2011;25:4–10 [DOI] [PMC free article] [PubMed] [Google Scholar]
- 12.Knopman DS, Penman AD, Catellier DJ, et al. Vascular risk factors and longitudinal changes on brain MRI: the ARIC study. Neurology 2011;76:1879–1885 [DOI] [PMC free article] [PubMed] [Google Scholar]
- 13.Schneider JA, Arvanitakis Z, Leurgans SE, Bennett DA. The neuropathology of probable Alzheimer’s disease and mild cognitive impairment. Ann Neurol 2009;66:200–208 [DOI] [PMC free article] [PubMed] [Google Scholar]
- 14.Luchsinger JA, Reitz C, Patel B, et al. Relation of diabetes to mild cognitive impairment. Arch Neurol 2007;64:570–575 [DOI] [PubMed] [Google Scholar]
- 15.Reitz C, Tang MX, Manly J, et al. Hypertension and the risk of mild cognitive impairment. Arch Neurol 2007;64:1734–1740 [DOI] [PMC free article] [PubMed] [Google Scholar]
- 16.Tervo S, Kivilpelto M, Hanninen T, et al. Incidence and risk factors for mild cognitive impairment: a population-based three-year follow-up study of cognitively healthy elderly subjects. Dement Geriatr Cogn Disord 2004;17:196–203 [DOI] [PubMed] [Google Scholar]
- 17.Chang C-CH, Yang H-C, Tang G, Ganguli M. Minimizing attrition bias: a longitudinal study of depressive symptoms in an elderly cohort. Int Psychogeriatr 2009;21:869–878 [DOI] [PMC free article] [PubMed] [Google Scholar]
- 18.Chang C-CH, Zhao Y, Lee C-W, Ganguli M. Smoking, death, and Alzheimer’s disease: a case of competing risks. Alzheimer Dis Assoc Disord 2012;26:300–306 [DOI] [PMC free article] [PubMed] [Google Scholar]
- 19.Wulfsohn MS, Tsiatis AA. A joint model for survival and longitudinal data measured with error. Biometrics 1997;53:330–339 [PubMed] [Google Scholar]
- 20.Little RJA. Pattern-mixture models for multivariate incomplete data. J Am Stat Assoc 1993;88:125–134 [Google Scholar]
- 21.Ganguli M, Snitz BE, Lee C-W, et al. Age and education effects and norms on a cognitive test battery from a population-based cohort: the Monongahela-Youghiogheny Healthy Aging Team (MYHAT). Aging Ment Health 2010;14:109–116 [DOI] [PMC free article] [PubMed] [Google Scholar]
- 22.Folstein MF, Folstein SE, McHugh PR. “Mini-Mental State”: a practical method for grading the cognitive state of patients for the clinician. J Psychiatr Res 1975;12:189–198 [DOI] [PubMed] [Google Scholar]
- 23.Mungas D, Marshall SC, Weldon M, et al. Age and education correction of Mini-Mental State Examination for English and Spanish-speaking elderly. Neurology 1996;46:700–706 [DOI] [PubMed] [Google Scholar]
- 24.Morris JC. The Clinical Dementia Rating (CDR): current version and scoring rules. Neurology 1994;46:2412–2414 [DOI] [PubMed] [Google Scholar]
- 25.Morris JC, Storandt M, Miller JP, et al. Mild cognitive impairment represents early stage Alzheimer’s disease. Arch Neurol 2001;58:397–405 [DOI] [PubMed] [Google Scholar]
- 26.Czernichow S, Kengne A-P, Stamatakis E, et al. Body mass index, waist circumference and waist–hip ratio: which is the better discriminator of cardiovascular disease mortality risk? Evidence from an individual-participant meta-analysis of 82 864 participants from nine cohort studies. Obes Rev 2011;12:680–687 [DOI] [PMC free article] [PubMed] [Google Scholar]
- 27.Yusuf S, Hawken S, Ounpuu S, et al. Effect of potentially modifiable risk factors associated with myocardial infarction in 52 countries (the INTERHEART study): case-control study. Lancet 2004;364:937–952 [DOI] [PubMed] [Google Scholar]
- 28.Shlipak MG, Sarnak MJ, Katz R, et al. Cystatin C and the risk of death and cardiovascular events among elderly persons. N Engl J Med 2005;352:2049–2060 [DOI] [PubMed] [Google Scholar]
- 29.Gerstein HC. Glycosylated hemoglobin: finally ready for prime time as a cardiovascular risk factor. Ann Intern Med 2004;141:475–476 [DOI] [PubMed] [Google Scholar]
- 30.Seshadri S, Beiser A, Selhub J, et al. Plasma homocysteine as a risk factor for dementia and Alzheimer's disease. N Engl J Med 2002;346:476–483 [DOI] [PubMed] [Google Scholar]
- 31.Strandberg TE, Tilvis RS. C-reactive protein, cardiovascular risk factors, and mortality in a prospective study in the elderly. Arterioscler Thromb Vasc Biol 2000;20:1057–1060 [DOI] [PubMed] [Google Scholar]
- 32.Klein JP, Moeschberger ML. Survival Analysis: Techniques for Censored and Truncated Data, 2nd ed New York, NY: Springer-Verlag; 2003 [Google Scholar]
- 33.Roberts RO, Geda GE, Knopman DS, et al. The incidence of MCI differs by subtype and is higher in men: the Mayo Clinic Study of Aging. Neurology 2012;78:342–351 [DOI] [PMC free article] [PubMed] [Google Scholar]
- 34.Jack CR, Knopman DS, Jagust WJ, et al. Hypothetical model of dynamic biomarkers of the Alzheimer’s pathologic cascade. Lancet Neurol 2010;9:119–128 [DOI] [PMC free article] [PubMed] [Google Scholar]
- 35.Agarwal DP. Cardioprotective effects of light to moderate alcohol consumption: a review of putative mechanisms. Alcohol Alcohol 2002;37:409–441 [DOI] [PubMed] [Google Scholar]
- 36.Grundy SM, Brewer HB, Cleeman JI, et al. Definition of metabolic syndrome: report of the National Heart, Lung, and Blood Institute/American Heart Association Conference on Scientific Issues Related to Definition. Circulation 2004;109:433–438 [DOI] [PubMed] [Google Scholar]
- 37.Luchsinger JA, Cheng D, Tang M-X, et al. Central obesity in the elderly is related to late-onset Alzheimer disease. Alzheimer Dis Assoc Disord 2012;26:101–105 [DOI] [PMC free article] [PubMed] [Google Scholar]
- 38.Panza F, Frisardi V, Seripa D, et al. Metabolic syndrome, mild cognitive impairment, and dementia. Curr Alzheimer Res 2011;8:492–509 [DOI] [PubMed] [Google Scholar]
- 39.Elias MF, Sullivan LM, D'Agostino RB, et al. Framingham stroke risk profile and lowered cognitive performance. Stroke 2004;35:404–409 [DOI] [PubMed] [Google Scholar]
- 40.Miller G. Stopping Alzheimer’s before it starts. Science 2012;337:790–792 [DOI] [PubMed] [Google Scholar]
Associated Data
This section collects any data citations, data availability statements, or supplementary materials included in this article.