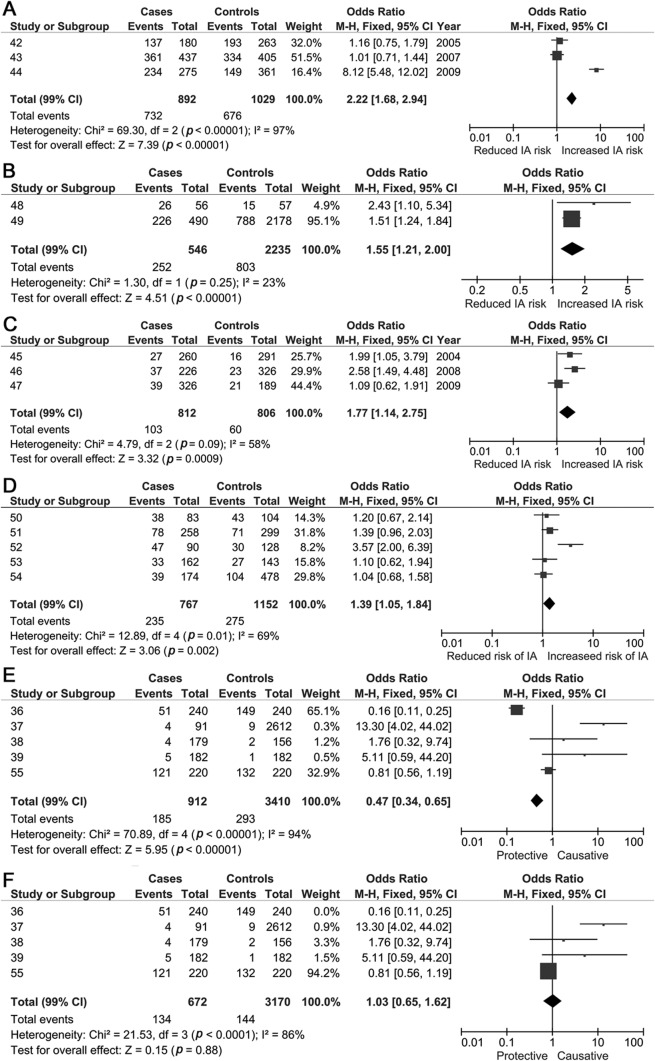
Figure 3. Forest plots for candidate gene single nucleotide polymorphisms associated with intracranial aneurysms.
(A) Dominant model forest plots for SERPINA3 single nucleotide polymorphism (SNP). (B) COL3A1 (rs1800255) dominant model forest plot. (C) COL1A2 (rs42524) dominant model forest plot. (D) ACE I/D recessive model forest plot. (E) IL6 G572C SNP recessive model forest plot before sensitivity analysis. (F) IL6 G572C SNP recessive model forest plot after sensitivity analysis. CI = confidence interval; IA = intracranial aneurysm; M-H = Mantel-Haenszel.

