

Abstract
Several methods exist for the assessment of balance. In the clinical setting, they are often assessed through qualitative tests. In the laboratory, instrumentation can quantitatively and more accurately measure balance. To date, force platforms remain one of the most commonly used tools in balance assessment. They are, however, costly and cumbersome, making them impractical in clinical settings and field studies. Utilization of accelerometers in balance assessment has been studied but has not yet become a laboratory standard due to the unknown accuracy of this method. If proven accurate, the use of accelerometers in laboratory and clinical environments would be ideal because they are inexpensive, noninvasive, and easy to transport. The purpose of this study was to compare the use of accelerometers as an inclinometer to the use of a force platform in the assessment of postural stability. A triaxial accelerometer was placed on the trunk of five subjects. The subjects stood barefoot on a force platform under various conditions which affect balance: all sensory systems intact; impaired visual feedback; impaired proprioceptive feedback; and impaired visual and proprioceptive feedback. During each trial, trunk acceleration and ground reaction forces and moments were collected. Force plate data was used to plot the path of the center of pressure and acceleration data was used to plot a projected path of the trunk acceleration. Behavioral similarities were seen in both methods of balance assessment. Therefore, balance assessment via accelerometers is feasible. This method does, however, require further investigation.
Keywords: biomechanics, locomotion, stability, balance, accelerometer, force plate
INTRODUCTION
Falling is a very real threat among the elderly population. Approximately 30 percent of community-dwelling adults fall at least once a year, and falling multiple times is not uncommon. Though most falls result in only minor injuries, the psychological effects of a fall can be severe and have a lasting negative effect on an individual’s self-confidence [1].
It is important to be able to assess an individual’s likelihood of falling so that preventive measures may be taken. The most common method of doing so is to measure an individual’s postural stability and balance. LeVeau [2] defines balance as “the ability to maintain the center of mass over the base of support” (BOS), where the BOS is the roughly trapezoidal area between the feet [3]. Stability is defined by LeVeau as “resistance to change in […] equilibrium”.
Both can be measured using several different methods. In a clinical or a field setting, qualitative tests such as the Rivermead Mobility Index, the Berg Balance Test, the Functional Reach Test, and the Timed Up and Go Test are often used. Though many different types of these tests exist, the reliability and validity of many them have yet to be established [4].
Unlike in a clinical or field setting, instrumentation can be used to quantitatively and more accurately measure balance in a laboratory environment. To date, force platforms remain one of the most commonly used tools to measure balance in labs. They are, however, costly and cumbersome, making them impractical in a clinical setting and field studies. The use of accelerometers in balance assessment has been studied [5] but has not yet become a laboratory standard due to the unknown accuracy of this method. If proven accurate, the use of accelerometers in laboratory and clinical balance assessment would be ideal because they are inexpensive, noninvasive, and easy to transport.
The goal of this study is to compare balance measures from an accelerometer attached to the trunk to balance measures from a force plate to determine the efficacy of balance assessment using accelerometers.
METHODS
Five subjects, three females and two males, (mean age= 24.2 years, height= 165.6cm, body mass= 58.5kg) were recruited to participate in this study. An AMTI force plate with a gain setting of 1 for all channels was used for this experiment. A triaxial accelerometer, centered roughly over the sternum, was secured to each subject using Velcro straps that wrapped around the subject’s torso. The distance between the accelerometer and the ground was measured. Though the accelerometer’s position is superior to the actual location of the body’s center of gravity—roughly 57% of a person’s height above the ground for males and 55% for females [6]—the location is sufficient for stability measurements [7]. When an accelerometer is used as an inclinometer, the accelerometer location is arbitrary. The accelerometer is simply tracking the sway. For example, placing the accelerometer at the hips would mostly track the motion of the lower extremities. Placing the accelerometer at the sternum, however, allows for the movement of the entire body to be tracked [7]. The orientation of the axes for this experiment is in shown Figure 1.
Figure 1.

Orientation of axes for force plate and accelerometer.
For all parts of the experiment, subjects stood on the force plate barefoot to eliminate any variance due to shoe design. Subjects’ hands were relaxed at their sides, and subjects were instructed to look straight ahead and stand as still as possible. Subjects were asked to jump at the beginning of each trial so that the force plate data and the accelerometer data could be synced. Data was then collected for 90s for four different trials: all sensory systems intact; impaired visual feedback; impaired proprioceptive feedback; and impaired visual and proprioceptive feedback. Visual feedback was impaired by having the subjects close their eyes, and proprioceptive feedback was impaired by having them stand on a 5.25 in (13.34cm) thick pad over the force plate.
The x and y coordinates of the center of pressure (COP) could then be calculated using the equations
| (1) |
| (2) |
where h is the thickness of any material covering the plate. h was 0 for the first two trials. For the third and fourth trials, where the subjects stood on a pad, h was taken to be 4.75in (12.06cm). The means of the x and y values were then calculated and subtracted from each respective set. These coordinates were then used to generate stabilograms. The COP’s mean velocity was found by summing the distance between each point and dividing this over the total collection time.
The sway path of the accelerometer was calculated using equations from Mayagoitia et al. [5]. The resultant acceleration was calculated using the equation
| (3) |
where ax, ay, and az are the x, y, and z components of the acceleration respectively.
The angles between the components of the acceleration and the resultant (Figure 2) were next calculated using the equations [5]
Figure 2.
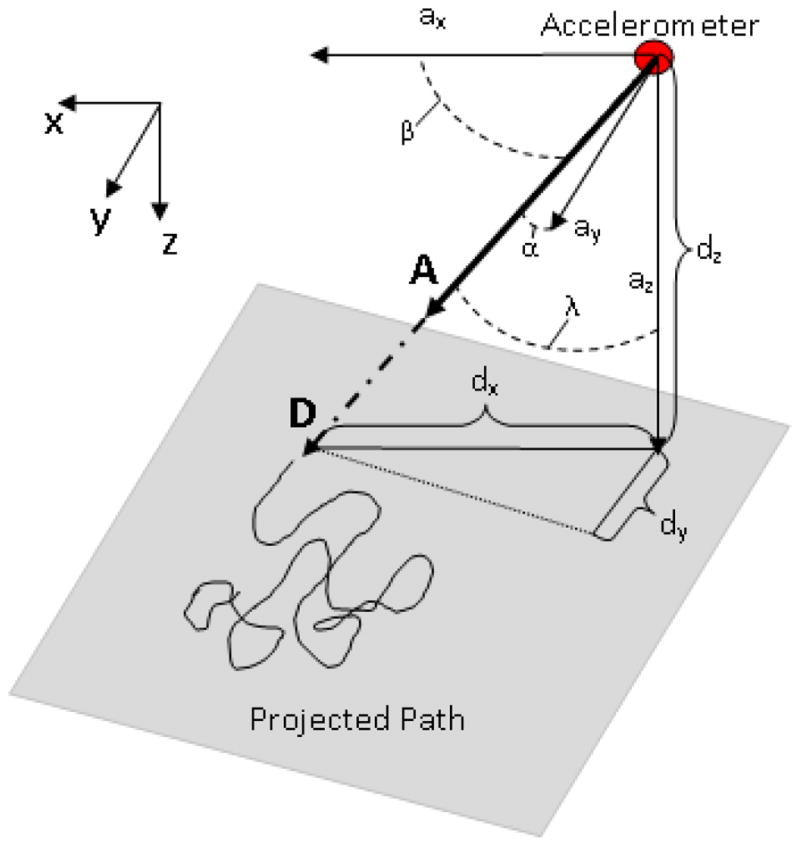
Sway diagrams illustrate the sway of a subject during postural stability tests.
| (4) |
| (5) |
| (6) |
To find the magnitude of the vector D, a vector collinear to the resultant acceleration, the height of the accelerometer above the floor, dz, was divided by −cosγ. The x- and y-components of D could then be found using the equations [5] Sway diagrams were produced by plotting dx versus dy (Figure 2), and the mean velocity of the sway was calculated in the same way as the COP’s mean velocity.
| (7) |
| (8) |
RESULTS
Stabilograms and inclinometer sway diagrams were plotted for each subject and each condition using the force plate data and accelerometer data, respectively. As seen from the stabilograms, the overall path of the COP increased in both medial-lateral (M-L) and anterior-posterior (A-P) directions as sensory systems were impaired (Figure 3). With the exception of visual impairment only, the overall sway path of the inclinometer increased in both directions with increased sensory impairment (Figure 4). Finally, the mean velocities of the COP and inclinometer sway were found for each condition (Table 1).
Figure 3.

Stabilograms obtained using force platform for Subject 1 under each testing condition: (a) all sensory systems intact; (b) impaired visual feedback; (c) impaired proprioceptive feedback; and (d) impaired visual and proprioceptive feedback.
Figure 4.

Sway diagrams obtained using accelerometer for Subject 1 under each testing condition: (a) all sensory systems intact; (b) impaired visual feedback; (c) impaired proprioceptive feedback; and (d) impaired visual and proprioceptive feedback.
Table 1.
Mean COP velocities and sway velocities for each testing condition.
| Eyes open | Eyes closed | Eyes open with foam pad | Eyes closed with foam pad | |
|---|---|---|---|---|
| Mean COP velocity (cm/s) from force plate | 0.80 | 0.72 | 27.04 | 48.32 |
| Mean sway velocity (cm/s) from accelerometer | 10.80 | 10.52 | 12.66 | 14.21 |
DISCUSSION
In this study, the visual and proprioceptive factors were impaired, independently and jointly, to compare the use of an accelerometer as an inclinometer to the use of a force plate in balance assessment. While the data acquired from each method of balance assessment are not directly comparable, the trends they exhibit are comparable. Therefore, several balance conditions were used to see how the data changes with impairment of different sensory systems needed for balance.
Similar behaviors were seen in the data collected from both methods. An increase in COP mean velocity values was seen with an increase sensory impairment. For example, the mean velocity of the COP with visual impairment only is 0.80cm/s, which is significantly lower than the mean velocity of the COP with eyes closed (with the foam pad) of 48.32cm/s, indicating a decrease in stability. Similarly, the mean sway velocity with eyes opened (without foam pad) is 10.80cm/s whereas the mean trunk sway velocity with eyes closed (with the foam pad) is 14.21cm/s. In addition, the range of motion of the COP and sway paths increase in the M-L and A-P directions as sensory impairment increased.
Similar trends were observed in a study conducted by Mayagoitia et al. In this study, an accelerometer was placed on the center of the lower back and between the hips. Subjects were also asked to stand on a force platform with shoes on. Subjects’ visual (eyes open or closed) and vestibular (feet comfortable distance apart or feet together) systems were impaired, independently and together. Mean speed and motion range of the COP and sway paths were measured. Similar to this study Mayagoitia et al. found that the mean speed of the COP and the inclinometer sway generally increased with sensory impairment. They also found an increase in the range of motion of the COP and sway paths as more sensory systems impaired the balance. [5]
CONCLUSION
Measurements of an individual’s postural stability and balance are used to assess the risk of fall induced injuries. Although force platform tests are most widely used to extract such data, the impracticality and expense of this method creates difficulty in testing mass quantities of people. Accelerometer tests, however, are inexpensive and easily transportable. After conducting tests using both methods, the inclinometer velocity and sway readings from the accelerometer have proven feasibility but further investigation is required to validate the accuracy. If further research reveals accurate results, accelerometers would be an ideal replacement to current instrumentation.
Footnotes
Presented at Rocky Mountain Bioengineering Symposium & International ISA Biomedical Sciences Instrumentation Symposium Hosted by Virginia Tech - Wake Forest School of Biomedical Engineering and Sciences Blacksburg, VA, 22–24 March 2012
References
- 1.O’Loughlin JL, et al. Incidence of and Risk Factors for Falls and Injurous Falls among the Community-dwelling Elderly. American Journal of Epidemiology. 1993;137(3):342–354. doi: 10.1093/oxfordjournals.aje.a116681. [DOI] [PubMed] [Google Scholar]
- 2.LeVeau BF. Biomechanics of Human Motion: Basics and Beyond. 1. Thorofare, NJ: Slack Incorporated; 2010. [Google Scholar]
- 3.Pai YC, Patton J. Center of mass velocity-position predictions for balance control. Journal of Biomechanics. 1997;30(4):347–354. doi: 10.1016/s0021-9290(96)00165-0. [DOI] [PubMed] [Google Scholar]
- 4.Langley FA, MacKintosh SFH. Function Balance Assessment of Older Community Dwelling Adults: A Systematic Review of the Literature. The Internet Journal of Allied Health Sciences and Practice. 2007;5(4):1–11. [Google Scholar]
- 5.Mayagoitia RE, et al. Standing balance evaluation using a triaxial accelerometer. Gait and Posture. 2002;16:55–59. doi: 10.1016/s0966-6362(01)00199-0. [DOI] [PubMed] [Google Scholar]
- 6.McGinnis PM. Human Kinetics. 2. 2004. Biomechanics of Sport and Exercise; p. 424. [Google Scholar]
- 7.Luinge HJ. Inertial sensing of human movement. University of Twente; Enschede, Netherlands: 2002. p. 88. [Google Scholar]