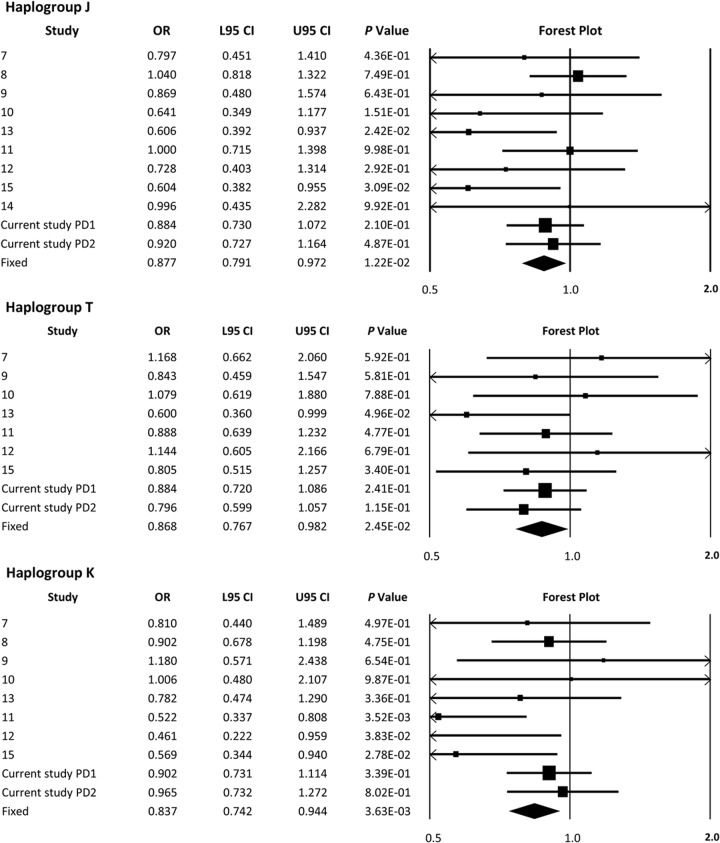
Figure 1. Meta-analysis of previously reported PD and mtDNA haplogroup associations and the data from this study.
Meta-analysis of our data and published European mtDNA haplogroup vs PD associations in isolation. Discovery = Hudson et al., PD1; replication = Hudson et al., PD2. Boxes are proportional to study size, and fixed-model meta-analysis is denoted by a diamond symbol. CI = confidence interval; L95 = lower 95% CI; mtDNA = mitochondrial DNA; OR = odds ratio; PD = Parkinson disease; U95 = upper 95% CI.

