Abstract
Transcriptional networks across all domains of life feature a wide range of regulatory architectures. Theoretical models now make clear predictions about how key parameters describing those architectures modulate gene expression, and the ability to construct genetic circuits with tunable parameters enables precise tests of such models. We dissect gene regulation through DNA looping by tuning network parameters such as repressor copy number, DNA binding strengths, and loop length in both thermodynamic models and experiments. Our results help clarify the short-length mechanical properties of DNA.
The processes of the central dogma serve as the macromolecular pipeline linking the critical genetic information hidden within DNA sequences to the active proteins that drive much of cellular life. Vast arrays of interlinked regulatory networks impose when and where different batteries of genes are turned on. But how is the output of these networks controlled by the parameters that govern a given regulatory architecture and how effective are such parameters as a substrate for evolutionary change?
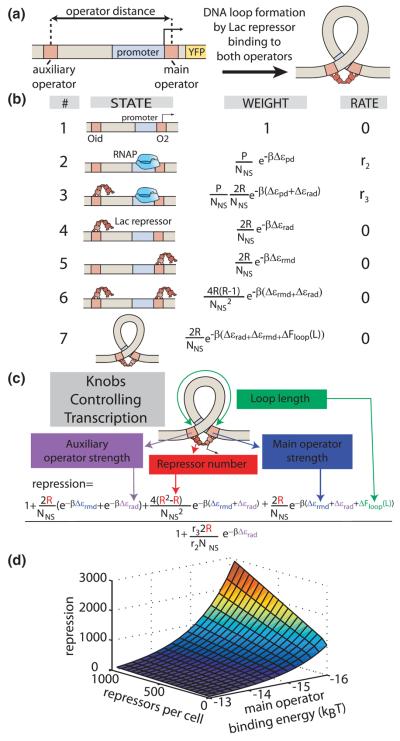
To explore these questions, we require quantitative knowledge of the transcriptional decisions made by the individual elements of these networks. Here we make a systematic theoretical and experimental study of key regulatory parameters in a common regulatory motif containing a single transcription factor. Systematic studies like this serve in several very useful capacities for understanding the evolution and engineering of genetic networks. First, from the perspective of the evolution of transcriptional networks, it is critical to know the systematic dependence of the expression on all of the parameters that can be tuned over evolutionary time [1,2], several of which are indicated in Fig. 1(a). Second, an objective of synthetic biology is to use various “parts” from the regulatory palette to assemble novel genetic networks. Analogous to the input-output functions of electronic circuits, work like ours serves as the development of understanding the “I–V curves” for these kinds of biological networks [3–5]. In this Letter, we explore one of the key conceptual building blocks of regulatory networks featuring “action at a distance”, in which DNA mechanically deforms to facilitate the activity of transcription factors bound to nonadjacent sites of a promoter region [6,7].
FIG. 1.
(color). Loop-mediated gene regulation is tuned by parameters incorporated into a thermodynamic model. (a) Lac repressor reduces gene expression by binding its operators, including binding to both operators and looping the intervening DNA. (b) A thermodynamic model of gene regulation contains the states of the two operator constructs, their associated weights, and the rates of transcription from each state. (c) The model predicts the influence of each parameter on gene expression, as captured in the experimentally measurable quantity repression defined in Eq. (1). (d) 3D plot of repression as a function of number of repressors per cell and the main operator binding energy for ΔFloop(L)=9kBT and r2 = r3. YFP, yellow fluorescent protein; RNAP, RNA polymerase.
To compute the input-output relation for such motifs we implement thermodynamic models. These models are widely used as a quantitative framework for transcriptional regulation [8–10], including in the analysis of gene regulation with DNA looping [11–15] (see Fig. S1 in the Supplemental Material [16] for comparisons to previous studies). Thermodynamic models are based upon the assumption that the probability of finding the system in a given regulatory state is a function of the free energy associated with each state of the system, which is basically in quasiequilibrium. Our objective is to test the limits of such models. Indeed, recent reports indicate that some regulatory processes require description beyond the realm of thermodynamic models [17–20], and noise in gene expression plays a critical role in some regulatory contexts [21]. We see these thermodynamic models as a starting point for quantitative descriptions of regulatory input-output functions. Such models predict experimental quantities such as the repression,
| (1) |
where R is the intracellular number of repressor molecules. In a model of repression by DNA looping, we enumerate the different states of the system and assign the corresponding weights and relative rates of transcription to each state, as shown in Fig. 1(b). The level of expression is given as
| (2) |
in which r2 and r3 are the rate constants for transcription from states 2 and 3 (for now r2 = r3, we address this assumption later in the text), P is the number of RNA polymerase molecules per cell, Δεrad is the binding energy corresponding to the auxiliary operator, Δεpd is the binding energy of RNA polymerase to the promoter, NNS is the number of nonspecific binding sites on the genome (see Supplemental Material [16] for discussion), β is the inverse of the Boltzmann constant times the temperature, and Z is the partition function which is the sum of all the weights listed in Fig. 1(b). After safely making the approximation that , the weak promoter approximation (see Supplemental Material [16] for details), this definition leads to the equation shown in Fig. 1(c), where ΔFloop(L) is the free energy needed to form a loop of length L, and Δεrmd is the binding energy of repressor to the main operator. The only free parameters remaining in the equation in Fig. 1(c) are those related to the binding energy of the Lac repressor to DNA, the DNA looping free energy and the number of repressors inside the cell. Previous experiments performed on simpler architectures have given us quantitative knowledge of the binding energies and the number of repressors [22]. The only real unknown parameter in the equation shown in Fig. 1(c) is the looping free energy.
To explore the consequences of the repression equation as a quantitative and predictive description of loop-mediated repression, we systematically measured the functional form for repression as a function of the key tunable parameters in that equation. The repression equation predicts how gene expression will scale with the number of repressors, the binding energies of the operators, and the looping free energy, as shown in Fig. 1(d). The values of the parameters used in this and subsequent calculations can be found in Table S5 of the Supplemental Material [16]. The approach of tuning these parameters in both predictive models and quantitative experiments has been implemented previously to establish the input-output function of repression from a single operator [22] and to examine the wild-type lac operon [23]. Such models have also been applied to previous measurements of Lac repressor looping [12,13,24]. Here we use the model to specify a series of experimental measurements that more rigorously explore the parameter space that influences loop formation.
In the spirit of conducting precision measurements to test the quantitative predictions of physical models, we experimentally tuned the theoretical “knobs” of the system by constructing an extensive library of E. coli strains containing fluorescent reporter constructs based on the lac operon. Repression was measured by comparing the ratio of gene expression in cells with and without the repressor, as in Eq. (1).
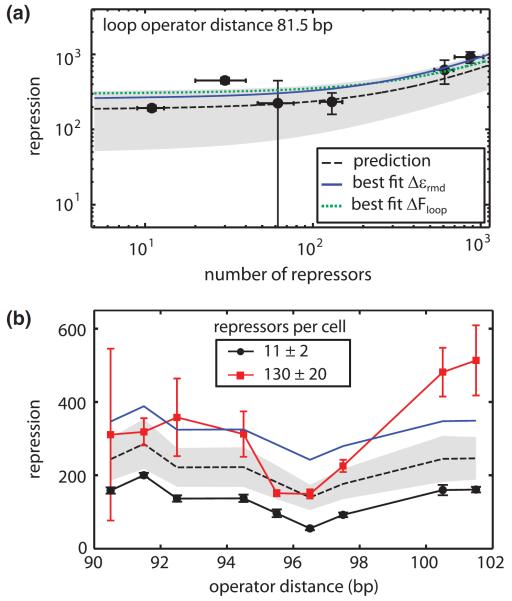
Repression in looping constructs has a nontrivial dependence on the number of repressors. However, such tests are not commonplace due to the difficulty of creating bacterial strains with known absolute numbers of repressors. We used a set of strains which varied the number of repressors per cell between 10 and 1000 [22,25] to explore the dependence of repression on the number of repressors as shown in Fig. 2. First, we titrated the number of repressors for specific looping constructs, with the data from one such construct shown in Fig. 2(a), in order to test that the functional form predicted by the equation in Fig. 1(c) held. A complementary way of probing the dependence on repressor number is shown in Fig. 2(b) where we examined repression over a full helical period of double stranded DNA for a given number of repressors per cell and used this information to predict the outcome of an experiment where the same DNA constructs are measured in the presence of a different number of repressors.
FIG. 2.
(color). Titrating the number of repressors per cell resulted in repression levels similar to predicted values. (a) To predict how repression scales with number of repressors, we first measured repression for a strain with the wild type number of repressors per cell (11 ± 2) and used the equation from Fig. 1(c) to calculate the looping energy. The prediction, as depicted by the dashed black line with the shaded region defining the 95% confidence interval, was compared to other experimental measurements. Global fits of all data points in the figure to the main operator binding energy and the looping energy are shown with the blue solid line and green dotted line respectively. (b) Repression as a function of loop length for two different values of the repressor number per cell. The black dashed line and shaded region show the parameter-free prediction for 130 repressors per cell using the best fit main operator binding energy calculated in (a). The blue solid line shows the global fit to the main operator binding energy for the 130 repressors per cell data. Error bars are standard error.
As seen in Fig. 2, the relation between the predicted and measured repression is in reasonable agreement. The predicted repression levels, as shown by the black dashed line and shaded regions in Figs. 2(a) and 2(b), were calculated using the looping energy extracted from the data at 11 repressors per cell. Some experimental measurements differed from predictions. In order to better compare the predictions with the experimental measurements, we performed global fits to all the experimental measurements to look for systematic disagreements between the data and parameter values. The best fit main operator binding energies for these data sets, shown by the blue solid lines, were −14:3kBT for Fig. 2(a) and −15:1kBT for Fig. 2(b). Both values indicate stronger binding than the previously reported value of −13:9 ± 0:2kBT [22], yet are consistent with other fits to similar data as shown in Figs. S2 and S3 and Table S6 of the Supplemental Material [16]. This discrepancy suggests that this disagreement between model predictions and experimental measurements could be largely due to uncertainty in model parameters, especially the main operator binding energy which strongly influences repression as shown in Fig. S4 in the Supplemental Material [16]. However, deviations from model predictions such as at 100.5 and 101.5 bp in Fig. 2(b) suggest a possible systematic deviation which may warrant further investigation.
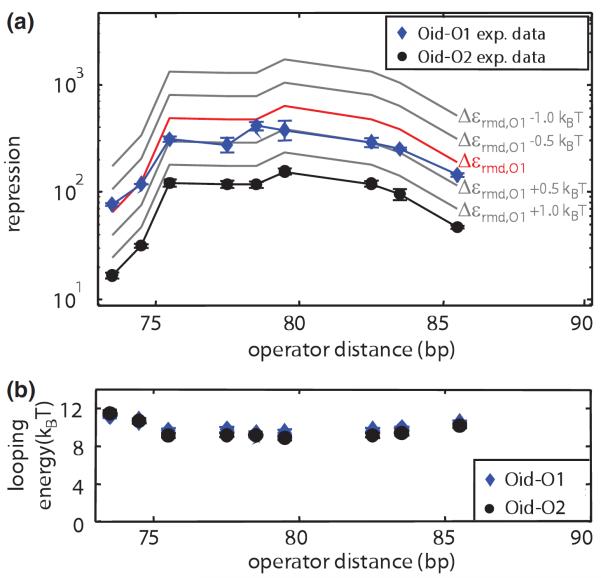
A second way of systematically tuning the parameters governing repression is by tuning the strength of the repressor binding to its operators. Figure 3(a) shows the result of taking looping constructs with different loop lengths and measuring the resulting repression for both a weak and stronger operator. Here too, the repression equation makes specific predictions about repression when the operator strengths are varied and these predictions are largely borne out. Another way to view the dependence on operator strength is by noting that the looping free energy that emerges from our repression measurements should be indifferent to which operators are present. Figure 3(b) shows that the looping free energies that emerge from different operator choices are the same to within error.
FIG. 3.
(color). The looping energy is independent of operator binding energies. (a) Repression measurements for constructs in which the main operator was O2 and the auxiliary operator was Oid (black circles) were used to predict how repression scales with the main operator binding energy. The family of curves illustrates how repression responds to 0:5kBT shifts in the binding energy of the main operator. The red line shows the prediction using the previously reported binding energy to operator O1 [22], in close agreement with measurements of Oid-O1 constructs (blue diamonds). (b) The looping energies extracted from both operator combinations are within error. Error bars represent standard error.
Next we closely examine the variation of looping energy with loop length, and address the anomalously high repression that has been observed for short loops [7,26,27]. Previous measurements of transcription factor-mediated loop formation in vivo suggested that some of the shortest DNA loops are energetically favorable in a way that appeared inconsistent with our in vitro understanding of DNA mechanics from the wormlike chain model [28]. Theoretical works have shown that the flexibility and geometry of transcription factors can help accommodate the formation of short DNA loops [29,30]. However, the precise details of the value and phasing of the predicted looping free energies can vary dramatically with the assumptions made about the mechanical properties and geometry of both the DNA and the protein [31], making it difficult to draw unequivocal conclusions about the flexibility of DNA at short distances. Additionally, a recent report suggests that a looping independent role for the upstream operator in gene regulation skews our interpretation of loop formation at short distances [27]. Adhya et al. first demonstrated that a Gal or Lac repressor in the upstream position interacts with RNA polymerase on the promoter [32–34], and this effect has been characterized using thermodynamic models in the context of an upstream operator binding Lac repressor [18]. Here we quantify this loop independent contribution to repression and examine how accounting for direct upstream repression corrects looping energies at short distances.
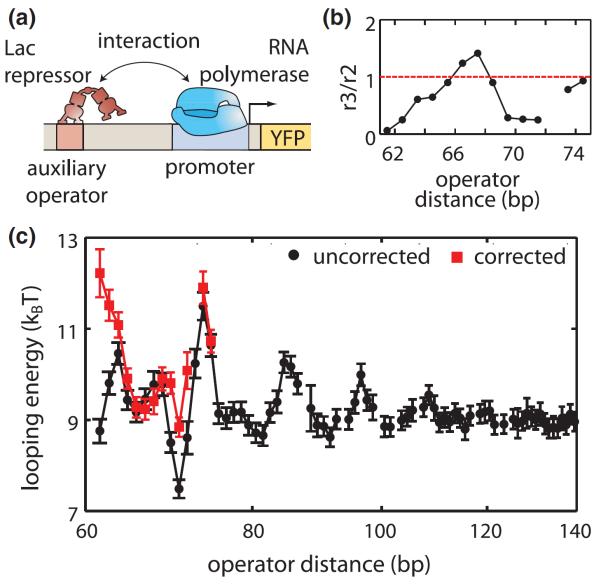
We quantified the amount of loop independent repression from the upstream operator by measuring gene expression in constructs lacking a main operator, as shown in Fig. 4(a). So far we have assumed that a Lac repressor bound to the upstream operator does not interact with the transcriptional machinery by setting r2 = r3. Now we calculate the relative rates of transcription from states 2 and 3 (see Fig. S5 and Supplemental Material [16] for derivation). As shown in Fig. 4(b), the ratio of transcription rates from states 2 and 3 varies with distance between 0.05 and 1.4, greatly reducing transcription at some lengths and acting as an activator at others, consistent with previous observations [18,32,33]. The upstream repressor interferes with promoter escape, and this interaction has been shown to be dependent upon the position and sequence of the upstream operator [18]. However, we still lack a quantitative understanding of how the sequence of the operator region influences this interaction and dictates the functional form of the curve in Fig. 4(b). By taking this effect into account, the corrected looping energy can be calculated, as shown in Fig. 4(c). At some lengths the looping energy changes several kBT, resulting in large changes in promoter occupancy as shown in Fig. S6 in the Supplemental Material [16]. These results indicate the importance of the upstream operator in gene regulation at short distances. Furthermore, this correction reveals that short loops are not of a lower energy than longer loops, and restores the approximately 12 bp periodicity of repression with loop length at short distances as shown in Fig. S5(D) in the Supplemental Material [16]. Although the scaling of the local minima of looping energies with loop length is not a clear function of operator distance over the loop lengths measured, the corrected results shown in Fig. 4(c) are more consistent with the wormlike chain model in that the local minima of the looping energies do not decrease with length for loops shorter than the ≈150 bp persistence length of DNA [35].
FIG. 4.
(color). Correcting for direct upstream repression when calculating looping energies. (a) Regulatory interactions occur between RNA polymerase and the Lac repressor bound to a nearby upstream operator, skewing in vivo measurements of looping based on gene expression. (b) To account for direct auxiliary repression in looping constructs, we measure r3=r2, at each operator distance. (c) Correcting the two operator model from Fig. 1(b) to account for direct auxiliary repression reveals increased looping energies for the shortest loops and restores a uniform periodicity of repression with length at short operator distances. Error bars represent standard error.
Transcription is a critical regulatory decision point in the central dogma. Here we provide a quantitative characterization of the way that critical regulatory parameters modulate the output of transcriptional circuits involving DNA looping. Our thermodynamic model produces falsifiable predictions that are confirmed by our measurements. Additionally, by extending the model to allow for interaction between RNA polymerase and upstream repressors, we show the dependence of repression on loop length is complicated at short distances by the presence of nonlooping induced phasing. Accounting for this interaction resolves a long-standing puzzle about the possible short length flexibility of DNA in vivo.
Supplementary Material
Acknowledgments
This work was supported by the National Institutes of Health Pioneer Award No. DP1 OD000217 (H. G. G., R. P.) and Grants No. R01 GM085286 and No. R01 GM085286-01S (J. Q. B., H. G. G., R. P.). We would like to acknowledge Jane Kondev, Jeff Gelles, Jim Maher, Jason Kahn, John Marko, Sunney Xie, Eran Segal, Sankar Adhya, Paul Wiggins, Thomas Kuhlman, David Bensimon, Jon Widom, and Stephanie Johnson for many thoughtful discussions.
References
- [1].Carroll SB. Endless Forms Most Beautiful: the New Science of Evo Devo and the Making of the Animal Kingdom. 1st ed Norton, New York: 2005. [Google Scholar]
- [2].Perez JC, Groisman EA. Cell. 2009;138:233. doi: 10.1016/j.cell.2009.07.002. [DOI] [PMC free article] [PubMed] [Google Scholar]
- [3].Endy D. Nature (London) 2005;438:449. doi: 10.1038/nature04342. [DOI] [PubMed] [Google Scholar]
- [4].Voigt CA. Curr. Opin. Biotechnol. 2006;17:548. doi: 10.1016/j.copbio.2006.09.001. [DOI] [PubMed] [Google Scholar]
- [5].Slusarczyk AL, Lin A, Weiss R. Nat. Rev. Genet. 2012;13:406. doi: 10.1038/nrg3227. [DOI] [PubMed] [Google Scholar]
- [6].Rippe K, von Hippel PH, Langowski J. Trends Biochem. Sci. 1995;20:500. doi: 10.1016/s0968-0004(00)89117-3. [DOI] [PubMed] [Google Scholar]
- [7].Garcia HG, Grayson P, Han L, Inamdar M, Kondev J, Nelson PC, Phillips R, Widom J, Wiggins PA. Biopolymers. 2007;85:115. doi: 10.1002/bip.20627. [DOI] [PMC free article] [PubMed] [Google Scholar]
- [8].Ackers GK, Johnson AD, Shea MA. Proc. Natl. Acad. Sci. U.S.A. 1982;79:1129. doi: 10.1073/pnas.79.4.1129. [DOI] [PMC free article] [PubMed] [Google Scholar]
- [9].Buchler NE, Gerland U, Hwa T. Proc. Natl. Acad. Sci. U.S.A. 2003;100:5136. doi: 10.1073/pnas.0930314100. [DOI] [PMC free article] [PubMed] [Google Scholar]
- [10].Bintu L, Buchler NE, Garcia HG, Gerland U, Hwa T, Kondev J, Phillips R. Curr. Opin. Genet. Dev. 2005;15:116. doi: 10.1016/j.gde.2005.02.007. [DOI] [PMC free article] [PubMed] [Google Scholar]
- [11].Law SM, Bellomy GR, Schlax PJ, Record MTJ. J. Mol. Biol. 1993;230:161. doi: 10.1006/jmbi.1993.1133. [DOI] [PubMed] [Google Scholar]
- [12].Vilar JM, Leibler S. J. Mol. Biol. 2003;331:981. doi: 10.1016/s0022-2836(03)00764-2. [DOI] [PubMed] [Google Scholar]
- [13].Bintu L, Buchler NE, Garcia HG, Gerland U, Hwa T, Kondev J, Kuhlman T, Phillips R. Curr. Opin. Genet. Dev. 2005;15:125. doi: 10.1016/j.gde.2005.02.006. [DOI] [PMC free article] [PubMed] [Google Scholar]
- [14].Zhang Y, McEwen AE, Crothers DM, Levene SD. Biophys. J. 2006;90:1903. doi: 10.1529/biophysj.105.070490. [DOI] [PMC free article] [PubMed] [Google Scholar]
- [15].Becker NA, Kahn JD, Maher LJ., III Nucleic Acids Res. 2007;35:3988. doi: 10.1093/nar/gkm419. [DOI] [PMC free article] [PubMed] [Google Scholar]
- [16].See Supplemental Material at http://link.aps.org/supplemental/10.1103/PhysRevLett.110.018101 for detailed calculations, additional theoretical considerations and experimental controls.
- [17].Sanchez A, Garcia HG, Jones D, Phillips R, Kondev J. PLoS Comput. Biol. 2011;7:e1001100. doi: 10.1371/journal.pcbi.1001100. [DOI] [PMC free article] [PubMed] [Google Scholar]
- [18].Garcia HG, Sanchez A, Boedicker JQ, Osborne M, Gelles J, Kondev J, Phillips R. Cell Reports. 2012;2:150. doi: 10.1016/j.celrep.2012.06.004. [DOI] [PMC free article] [PubMed] [Google Scholar]
- [19].Voss TC, Schiltz RL, Sung M-H, Yen PM, Stamatoyannopoulos JA, Biddie SC, Johnson TA, Miranda TB, John S, Hager GL. Cell. 2011;146:544. doi: 10.1016/j.cell.2011.07.006. [DOI] [PMC free article] [PubMed] [Google Scholar]
- [20].Lefstin JA, Yamamoto KR. Nature (London) 1998;392:885. doi: 10.1038/31860. [DOI] [PubMed] [Google Scholar]
- [21].Maamar H, Raj A, Dubnau D. Science. 2007;317:526. doi: 10.1126/science.1140818. [DOI] [PMC free article] [PubMed] [Google Scholar]
- [22].Garcia HG, Phillips R. Proc. Natl. Acad. Sci. U.S.A. 2011;108:12–173. doi: 10.1073/pnas.1015616108. [DOI] [PMC free article] [PubMed] [Google Scholar]
- [23].Kuhlman T, Zhang Z, Saier MH, Jr., Hwa T. Proc. Natl. Acad. Sci. U.S.A. 2007;104:6043. doi: 10.1073/pnas.0606717104. [DOI] [PMC free article] [PubMed] [Google Scholar]
- [24].Saiz L, Vilar JM. Nucleic Acids Res. 2008;36:726. doi: 10.1093/nar/gkm1034. [DOI] [PMC free article] [PubMed] [Google Scholar]
- [25].Salis HM, Mirsky EA, Voigt CA. Nat. Biotechnol. 2009;27:946. doi: 10.1038/nbt.1568. [DOI] [PMC free article] [PubMed] [Google Scholar]
- [26].Muller J, Oehler S, Muller-Hill B. J. Mol. Biol. 1996;257:21. doi: 10.1006/jmbi.1996.0143. [DOI] [PubMed] [Google Scholar]
- [27].Bond LM, Peters JP, Becker NA, Kahn JD, Maher LJ. Nucleic Acids Res. 2010;38:8072. doi: 10.1093/nar/gkq755. [DOI] [PMC free article] [PubMed] [Google Scholar]
- [28].Yamakawa H. Helical Wormlike Chains in Polymer Solutions. Springer; New York: 1997. [Google Scholar]
- [29].Swigon D, Coleman BD, Olson WK. Proc. Natl. Acad. Sci. U.S.A. 2006;103:9879. doi: 10.1073/pnas.0603557103. [DOI] [PMC free article] [PubMed] [Google Scholar]
- [30].Zhang Y, McEwen AE, Crothers DM, Levene SD. PLoS ONE. 2006;1:e136. doi: 10.1371/journal.pone.0000136. [DOI] [PMC free article] [PubMed] [Google Scholar]
- [31].Johnson S, Linden M, Phillips R. Nucleic Acids Res. 2012;40:7728. doi: 10.1093/nar/gks473. [DOI] [PMC free article] [PubMed] [Google Scholar]
- [32].Choy HE, Park SW, Aki T, Parrack P, Fujita N, Ishihama A, Adhya S. EMBO J. 1995;14:4523. doi: 10.1002/j.1460-2075.1995.tb00131.x. [DOI] [PMC free article] [PubMed] [Google Scholar]
- [33].Ryu S, Fujita N, Ishihama A, Adhya S. Gene. 1998;223:235. doi: 10.1016/s0378-1119(98)00237-6. [DOI] [PubMed] [Google Scholar]
- [34].Roy S, Semsey S, Liu M, Gussin GN, Adhya S. J. Mol. Biol. 2004;344:609. doi: 10.1016/j.jmb.2004.09.070. [DOI] [PubMed] [Google Scholar]
- [35].Bellomy GR, Mossing MC, Record MT., Jr. Biochemistry. 1988;27:3900. doi: 10.1021/bi00411a002. [DOI] [PubMed] [Google Scholar]
Associated Data
This section collects any data citations, data availability statements, or supplementary materials included in this article.


