Abstract
The interaction of dihydrofolate (H2F) and NADPH with a fluorescent derivative of H2F reductase (DHFR) was studied by using transient and single-molecule techniques. The fluorescent moiety Alexa 488 was attached to the structural loop that closes over the substrates after they are bound. Fluorescence quenching was found to accompany the binding of both substrates and the hydride transfer reaction. For the binding of H2F to DHFR, the simplest mechanism consistent with the data postulates that the enzyme exists as slowly interconverting conformers, with the substrate binding preferentially to one of the conformers. At pH 7.0, the binding reaction has a bimolecular rate constant of 1.8 × 10⁷ M-1·s-1, and the formation of the initial complex is followed by a conformational change. The binding of NADPH to DHFR is more complex and suggests multiple conformers of the enzyme exist. NADPH binds to a different conformer than H2F with a bimolecular rate constant of 2.6–5.7 × 10⁶ M-1·s-1, with the former value obtained from single-molecule kinetics and the latter from stopped-flow kinetics. Single-molecule studies of DHFR in equilibrium with substrates and products revealed a reaction with ensemble average rate constants of 170 and 470 s-1 at pH 8.5. The former rate constant has an isotope effect of >2 when NADPD is substituted for NADPH and probably is associated with hydride transfer. The results from stopped-flow and single-molecule methods are complementary and demonstrate that multiple conformations of both the enzyme and enzyme–substrate complexes exist.
Dihydrofolate (H2F) reductase (DHFR) is a key enzyme for the biosynthesis of purines, thymidylate, and a number of amino acids. Its strategic location in metabolism has also made it a target for anticancer drugs. DHFR catalyzes the reaction of 7,8-H2F and NADPH to form 5,6,7,8-tetrahydrofolate. The mechanism of action of DHFR has been extensively probed to better understand the fundamental nature of enzyme catalysis. This is because of not only its physiological importance, but also its relatively easy purification and stability. These investigations include multiple structure determinations, steady-state and transient kinetic studies, theory, and single-molecule kinetics (cf. refs. 1–5).
The structure of DHFR from Escherichia coli (molecular weight ≈18,000) is compact, with a loop that closes over the substrate binding sites. The mechanism of action of the enzyme involves multiple conformational changes that include domain rotation and interactions with structural loops (cf. refs. 1 and 2). Although the mechanism has been well characterized, it still remains an open question as to how the conformational changes that occur enhance the catalytic activity. Consequently, we have embarked on further investigation of the conformational coupling to catalysis by using transient and single-molecule kinetics.
DHFR has a structural loop that closes over the substrates after they are bound. This is revealed by the x-ray structures and dynamic NMR measurements (cf. refs. 1 and 6). The fluorescent dye Alexa 488 has been introduced into DHFR at the top of the structural loop by engineering a cysteine residue at position 18. The reaction of methotrexate with DHFR has been monitored by following fluorescence changes in Alexa 488 that accompany binding, and conformational changes of the enzyme have been characterized by stopped-flow and single-molecule fluorescence microscopy (4).
In this work, the interaction of the Alexa 488-labeled DHFR with NADPH and H2F was investigated, again using transient kinetics and single-molecule fluorescence. In addition, the kinetics of hydride transfer were studied with the fluorescent-labeled enzyme.
Experimental Methods
The preparation and characterization of the fluorescent-labeled enzyme was as described (4). At pH 7.0, the steady-state turnover number of the fluorescent-labeled enzyme is 6.4 s-1, ≈2.3-fold lower than the WT enzyme.
Stopped-flow and equilibrium studies of the enzyme were carried out at 25°C in 50 mM Mes/25 mM Tris/25 mM ethanolamine/0.l M NaCl, pH 7.0. The H2F was prepared as described (7).
The attachment of the fluorescent-labeled enzyme to the glass slide has been described (4). The enzyme is active when bound to the glass slide. Single-molecule studies of substrate binding were carried out in 0.1 M sodium phosphate/0.1 M NaCl/15 μM bovine serum albumin, pH 7.0, at room temperature. After attachment of the enzyme to the slide, NADPH or H2F was added by capillary action through the space between the slide and the cover glass. Three additions of substrate were carried out to assure that the system was at equilibrium with the desired concentration. Single molecules were observed with a home-built microscope using total internal reflection optics, and their time courses were followed with a PentaMAX ICCD camera (Roper Scientific, Trenton, NJ) for lifetimes >100 ms.
Time courses of single molecules with lifetimes <100 ms were followed with an avalanche photodiode (SPCM-AQR-16, Perkin–Elmer). For these experiments, an inverted Zeiss microscope with a nanopositioning stage was used (Polytec PI, Auburn, MA). Standard optics with an Ar laser were used, and the DHFR was attached to a coverslip instead of a slide. The samples were prepared with 3% polyethylene glycol (molecular weight 3,350) instead of BSA in the buffer, and the polyethylene glycol was washed off the slide with buffer before substrates were added. This procedure provided a considerably improved signal-to-noise ratio. The slide was moved via computer control to a position where a single molecule was located (maximum in fluorescence intensity), and the trajectory (time course) of the fluorescence was then measured.
Results
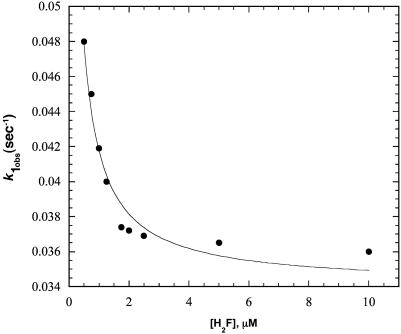
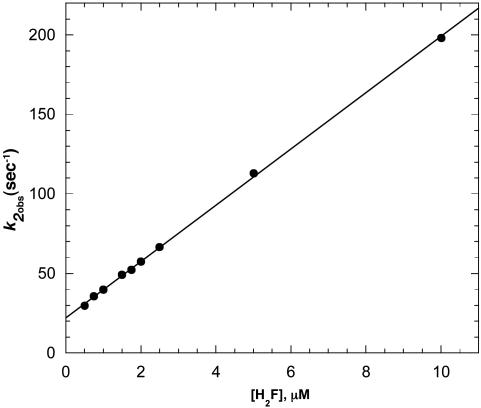
When 0.1–0.2 μM Alexa 488-labeled enzyme was mixed with 0.5–10 μM H2F in the stopped flow, two distinct time phases were observed for the decrease in fluorescence of Alexa 488 (excitation 488 nm, emission 500-nm cutoff filter). One phase occurred in the 0- to 200-ms time range, whereas the other occurred in the 0.2– to 200-s time range. Because of the disparate time scales, data were collected for each mixing with a split time base in which 500 points were collected over 200 ms and another 500 points over 200 s. Both of the kinetic traces could be well fit to a single exponential, and the pseudo first-order rate constants obtained are shown in Figs. 1 and 2 as a function of the H2F concentration. The larger first-order rate constant, k2obs, increases as the H2F concentration increases, suggesting a bimolecular reaction is being observed. The smaller first-order rate constant, klobs, decreases with increasing H2F concentration and approaches a constant value at H2F concentrations >≈2 μM.
Fig. 1.
Plot of k1obs versus the concentration of H2F for the interaction of H2F with DHFR determined from stopped-flow experiments at pH 7.0, 298 K. The line is the best fit to Eq. 3 with k1 = 0.034 s-1, k-1 = 0.068 s-1, and k-2/k2 = 0.13 μM, as described in the text.
Fig. 2.
Plot of k2obs versus the concentration of H2F for the interaction of H2F with DHFR determined from stopped-flow experiments at pH 7.0, 298 K. The line is the best fit to Eq. 2. The analysis gives k2 = 1.77 × 10⁷ M-1·s-1 and k-2 = 22.3 s-1.
These kinetics can be explained in terms of the mechanism:
 |
[1] |
For this mechanism,
 |
[2] |
A least-squares analysis of the data according to Eq. 2 gives k2 = 1.77 × 10⁷ M-1·s-1 and k-2 = 22.3 s-1. The dissociation rate constant was measured independently by mixing 1.0 μM DHFR with 100 μMH2F and reacting the resulting mixture with varying concentrations of methotrexate (250 μM—2.5 mM). The decrease in Alexa 488 fluorescence with time was exponential, and the first-order rate constant obtained, 26.8 ± 0.6 s-1, was independent of the methotrexate concentration. This result agrees well with the dissociation rate constant obtained from the kinetics of the reaction of DHFR with H2F.
The smaller pseudo first-order rate constant for the mechanism in Eq. 1 is (8)
 |
[3] |
where the concentrations are those of the unbound species. The data cannot be fit directly to this equation because the intercept with the ordinate cannot be unambiguously determined. Instead, it was observed that the amplitude of the slow process is about two times larger than that of the fast process. (The ratio is 2.2 ± 0.9 for multiple traces.) Consequently, k-1/k1 was set equal to 2 when fitting the data to Eq. 3. The fit gives k1 = 0.034 s-1, k-1 = 0.068 s-1, and k-2/k2 = 0.13 μM. The fit of the data, shown in Fig. 1, is reasonable but not unique. For example, the quality of the fit was about the same with k-1/k1 = 3, as judged from the sum of the squares of the deviations. In the fit shown, it was assumed that (E2) = 0; if (E2) = 0.1 μM, the quality of the fit is about the same. The value of k-2/k2 is significantly smaller than obtained by the analysis of the faster time process, 1 μM.
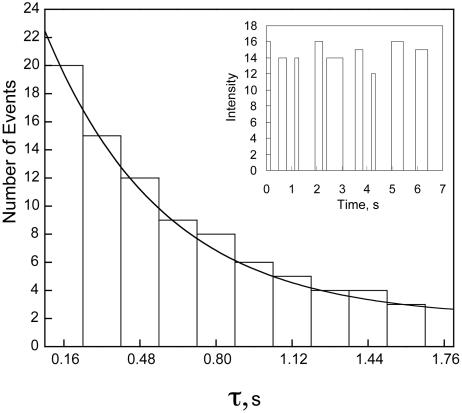
Single-molecule experiments of the H2F–enzyme interaction were also carried out. Single molecules of Alexa 488-labeled DHFR can be readily seen under the fluorescence microscope (4). The single-molecule fields were analyzed with the program nih image. This program permits the subtraction of a background and determines the intensity of the remaining individual spots (single molecules). The time evolution of individual spots was then plotted. A “blinking” of the spots can be seen in the presence of H2F, but not in its absence. A typical trajectory in the presence of H2F is shown in Fig. 3 Inset. The intensity does not actually fall to zero in the off cycle: we have used the software to subtract the minimum intensity from the data for clarity. The actual drop in intensity in the off state is estimated as ≥50%. The uncertainty/variation in the measured intensities is ≈±30%. The distribution of time constants can be measured for both the disappearance and appearance of spots. Essentially all of the single DHFR molecules blinked in the presence of H2F.
Fig. 3.
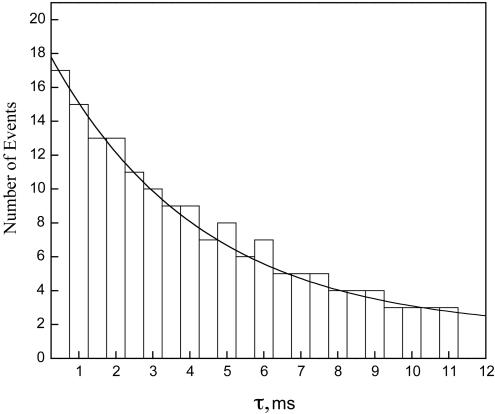
Representative distribution of single-molecule reaction times for the transition from the low-intensity state to the high-intensity state for single molecules of DHFR in the presence of 0.05 μM H2F at pH 7.0, room temperature. The number of events with a lifetime τ is plotted versus τ. The data were fit to Eq. 6 as described in the text. (Inset) Representative trajectory for the blinking of a single molecule of DHFR in the presence of 0.05 μM H2F at pH 7.0, room temperature. The fluorescence intensity in arbitrary units is plotted versus time. The fluorescence of the low-intensity state is arbitrarily set equal to zero in the computer analysis of the intensities.
The reaction times for individual molecules were tabulated for a minimum of 100 events at various H2F concentrations. The events were then sorted into ranges of lifetimes to give the distribution for the number of events occurring for each range of lifetimes. Because the single-molecule reaction (blinking) is seen only in the presence of H2F, the logical assumption is that the single-molecule quenching process is caused by the enzyme–substrate complex. The process can be represented as
 |
[4] |
where kf and kr are the ensemble average rate constants. The distribution of reaction times for the loss of the high-intensity state, A, is
 |
[5] |
where NA(τ) is the number of events with a lifetime τ and NA (0) is the total number of events. Similarly the distribution of lifetimes for the low-intensity state, B, is given by
 |
[6] |
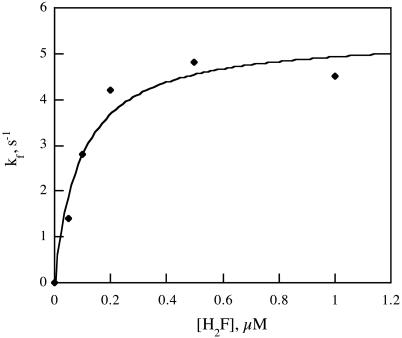
Thus the distributions of lifetimes are described by single exponential functions from which the ensemble average rate constants can be obtained. An exponential fit of a typical lifetime distribution is shown in Fig. 3. The ensemble average rate constant kf at various H2F concentrations is presented in Fig. 4. The uncertainty in these values is ≈±25%, primarily because of the limited number of events and limited time resolution of the equipment. The rate constant kr was the same at all concentrations, 4.9 ± 0.1 s-1.
Fig. 4.
Plot of the ensemble average rate constant, kf, versus the concentration of H2F, as determined from single-molecule measurements at pH 7.0, room temperature. The best fit of the data to Eq. 8 is shown. The analysis gives k3 = 5.4 s-1 and K = 0.092 μM.
The observed concentration dependence can be described by modification of Eq. 1 whereby rapid binding of H2F and enzyme is followed by a conformation change:
 |
[7] |
If the first step in the mechanism equilibrates rapidly relative to the second step
 |
[8] |
where K is the equilibrium constant of the first step. The best fit of the data to this equation is shown in Fig. 4 with k3 = 5.4 s-1 and K = 0.092 μM. For this mechanism, kr = k-3 = 4.9 s-1.
The reaction of NADPH with DHFR was also studied with stopped-flow and single-molecule experiments. In the stopped-flow experiments, the change in fluorescence after mixing again occurred in two distinct time domains, ≈0–200 ms and 0–50 s. For these experiments, the DHFR concentration was 0.1 μM and the NADPH concentration varied from 0.5 to 140 μM. The faster phase followed first-order kinetics over the entire concentration range. However, for the slower process, the fluorescence decreased at low NADPH concentrations and increased at high concentrations with the crossover concentration being between 17 and 35 μM NADPH. This behavior cannot be explained by a mechanism such as that in Eq. 1. The amplitude of the slow phase of the reaction was considerably less than that of the faster so that the kinetics of the slow phase could not be well characterized.
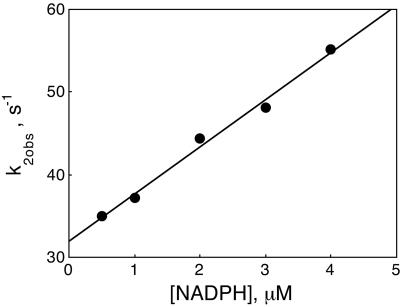
Because the slow reaction accompanying binding is unlikely to be of physiological significance, measurements were restricted to very low concentrations of NADPH and DHFR in a second set of experiments in which 96 nM DHFR was mixed with 0–4 μM NADPH. For this restricted concentration range, both the fast and slow phases of the reaction followed first-order kinetics, with the faster phase having a larger amplitude: the amplitude ratio of the fast-to-slow phase was 4.2 ± 0.4. The pseudo first-order rate constant of the fast phase was linear with respect to the NADPH concentration as shown in Fig. 5. In terms of the mechanism in Eq. 1, with NADPH substituted for H2F, k2 = 5.7 × 10⁶ M-1·s-1 and k-2 = 32 s-1. The first-order rate constant for the slow phase did not vary with the substrate concentration and was 0.055 ± 0.011 s-1. However, in view of the complicated kinetic behavior at higher NADPH concentrations, the mechanism and associated rate constants must be viewed as quite tentative. The amplitude ratio at low NADPH concentrations suggests that the isomer of the free enzyme reacting with NADPH is not the same as that reacting with H2F, i.e., E1 rather than E2.
Fig. 5.
Plot of k2obs versus the concentration of NADPH for the interaction of DHFR with NADPH determined from stopped-flow measurements at pH 7.0, 298 K. The line is the best fit to Eq. 2 with NADPH substituted for H2F. The analysis gives k2 = 5.7 × 10⁶ M-1·s-1 and k-2 = 32 s-1.
An attempt was made to determine the rate of dissociation of NADPH from the enzyme complex by incubating 0.5 μM DHFR with 10 μM NADPH and mixing the resulting solution with various concentrations of NADP+ (0–12.5 mM). Although the increase in Alexa 488 fluorescence followed first-order kinetics, the apparent first-order rate constant varied with the NADP+ concentration, decreasing from ≈45 s-1 at 1.0 mM NADP+ to ≈32 s-1 at the highest concentration. This behavior again suggests that the mechanism is more complex than embodied in Eq. 1. The stopped-flow results are discussed further below.
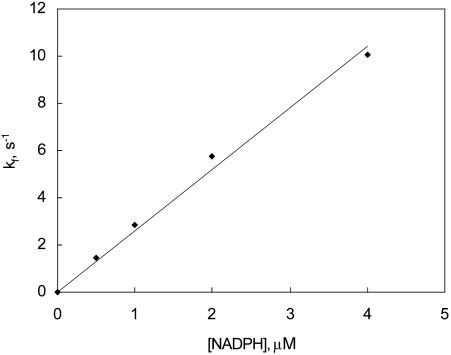
Single-molecule studies of the DHFR–NADPH interaction also were studied. Again, a blinking of the individual spots was observed, quite similar to the behavior observed with H2F. The data were analyzed as before. The ensemble average value of kf is plotted as a function of the NADPH concentration in Fig. 6. The value of kr over the same concentration range was constant, 3.8 ± 0.1 s-1. These data can be described by the mechanism:
 |
[9] |
where kf = k1(NADPH) and kr = k-1. The best fit of the data gives k1 = 2.6 × 10⁶ M-1·s-1 and k-1 = 3.8 s-1. The equilibrium dissociation constant calculated from these rate constants is 1.4 μM.
Fig. 6.
Plot of the ensemble average rate constant, kf, versus the concentration of NADPH as determined from single-molecule measurements at pH 7.0, room temperature. The best fit of the data to kf = k1(NADPH) gives k1 = 2.6 × 10⁶ M-1·s-1.
The equilibrium dissociation constant for the binding of NADPH with DHFR was determined by fluorescence titration of DHFR with NADPH. The quenching of both Alexa 488 and protein tryptophans was measured. A value of 1.5 ± 0.2 μM was determined from multiple titrations.
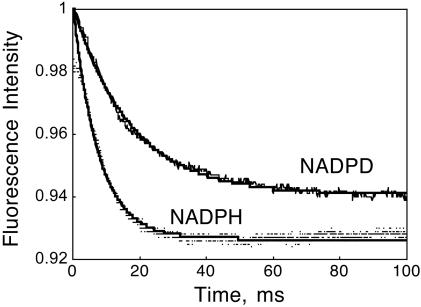
The fluorescence of Alexa 488 also changed during the hydride transfer reaction at pH 7.0, so that the hydride transfer reaction can be measured directly. The stopped-flow traces associated with hydride transfer are shown in Fig. 7. In these experiments 200 μM NADPH or NADPD was incubated with 1 μM enzyme and then mixed in the stopped flow with 200 μM H2F. The data are well fit by first-order kinetics with rate constants of 130 and 47.1 s-1 for NADPH and NADPD, respectively. The isotope rate effect of 2.8 is consistent with previous measurements (9). The hydride transfer is stereospecific with no exchange of H with the solvent.
Fig. 7.
Plot of Alexa 488 fluorescence versus time for the reaction of 1.0 μM Alexa 488-labeled DHFR with 200 μM H2F and 200 μM NADPH or NADPD, pH 7.0, 298 K. The lines are the best fits to a single exponential with hydride transfer rate constants of 130 and 47.1 s-1 for NADPH and NADPD, respectively.
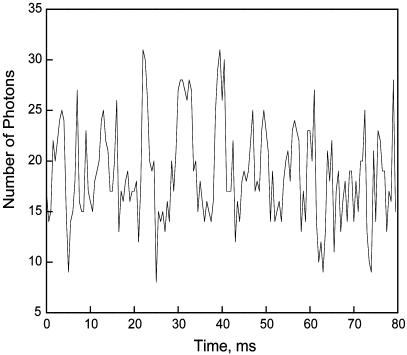
Single-molecule studies of lifetimes <100 ms were carried out in the presence of H2F, NADPH, and NADP+. When the enzyme was present with any of the substrates alone, the fluorescence intensity did not vary over times <100 ms within the experimental uncertainties. However, in the presence of all three substrates, the fluorescence fluctuated with time. The magnitude of this effect was maximized at pH 8.5 (0.1 M sodium phosphate) with 6 μM H2F, 10 μM NADPH, and 1.0 mM NADP+ and was also observed at pH 7.5. The substrates were allowed to equilibrate ≈30 min with the enzyme. This combination of substrates was selected in an attempt to maximize the concentrations of enzyme–substrate intermediates. Although the equilibrium favors tetrahydrofolate and NADP+, the equilibrium shifts toward NADPH and H2F as the pH is raised. In the absence of NADP+, some fluctuations in fluorescence intensity may be occurring, but they are within the experimental uncertainty. At higher substrate concentrations, the fluorescence was found to be severely quenched. Under the above conditions, the variation in the fluorescence was ≈30–50% and is significantly quenched relative to the enzyme in the absence of substrates. A typical trajectory is shown in Fig. 8. The results were analyzed assuming two states, high and low fluorescent. More than two fluorescent states may be present, but the precision of the data is not sufficient to resolve them.
Fig. 8.
Representative plot of the number of photons per 500 μs versus time for a single molecule of DHFR observed with an avalanche photodiode. The DHFR was incubated with 10 μM NADPH, 6 μM H2F, and 1.0 mM NADP+ at pH 8.5 (0.1 M sodium phosphate) for 30 min before measurement of the trajectory.
Lifetimes were collected for the high and low fluorescent states, with the two states defined by drawing a line through the center of the fluctuations. A representative plot of the number of events with a lifetime τ is plotted versus the lifetime of the high-intensity state in Fig. 9 with NADPH as substrate. The lifetime distributions were fit to Eqs. 5 and 6. For NADPH, the ensemble average rate constants at pH 8.5 are kf = 168 ± 23 s-1 and kr = 473 ± 16 s-1, whereas for NADPD the corresponding values are 73.3 ± 7.6 and 494 ± 44 s-1. At pH 7.5, kf = 179 ± 23 s-1 and kr = 189 ± 13 s-1 with NADPH and 75.9 ± 11 and 189 ± 19 s-1, respectively with NADPD. The rate constants are averages of three experiments with the standard deviations indicated. The uncertainty in the rate constants is ≈±25%.
Fig. 9.
Representative plot of the number of events with lifetime τ for the high fluorescent state versus τ obtained from trajectories measured at pH 7.5 under the conditions given in the legend to Fig. 8. The data were fit to Eq. 5 as described in the text.
Discussion
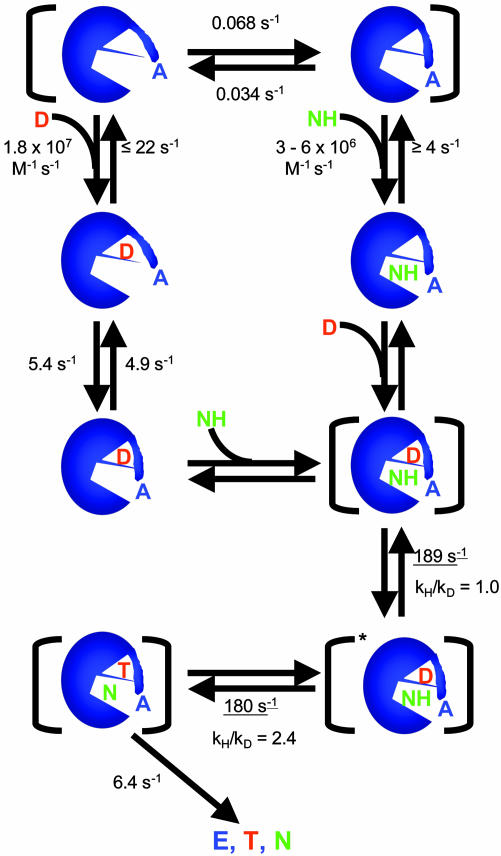
The construction of an enzyme with a fluorescent reporter group directly at the active site and the combination of transient and single-molecule studies have provided a detailed description of the interactions of DHFR with its substrates. In addition, the hydride transfer reaction can be directly studied. The results of this investigation can be summarized by the cartoon in Fig. 10. The various conformations of DHFR and the rate constants associated with their interconversions are indicated. The rationale for this cartoon is discussed below.
Fig. 10.
Summary cartoon of the minimal mechanism for Alexa-labeled DHFR with the rate constants deduced from this study. A is Alexa, D is H2F, T is tetrahydrofolate, NH is NADPH, N is NADP+, * indicates a different conformation, and the species between brackets are probably multiple conformations. A conformational gating step is shown before hydride transfer, but the data are equally consistent with it occurring after hydride transfer. Rate constants are at pH 7.0, except for those underlined, which are at pH 7.5.
The interaction of DHFR with H2F can be described by the mechanism in Eq. 1, with the addition of an additional conformational change of the enzyme–substrate complex revealed by the single-molecule measurements. The thermodynamic dissociation constant determined from equilibrium measurements is 0.2 μM. The stopped-flow studies give a value of 0.05–1 μM, depending on how the analysis is carried out. The dissociation constant determined from the single-molecule studies is <0.1 μM. It seems very likely that more than two conformers of the free enzyme exist, so that the kinetic analysis is an oversimplification.
The interaction of NADPH with DHFR proved more complex than expected. The stopped-flow studies clearly suggest that reaction steps in addition to the simple bimolecular binding reaction and interconversion of E1 and E2 are occurring. Two possibilities consistent with experimental observations are a slow conformational change of the enzyme–substrate complex and/or binding of a second NADPH to the enzyme. This complication appears to be an artifact of Alexa 488, as it is not observed with the native enzyme. The association rate constants determined from the stopped-flow and the single-molecule experiments are within a factor of 2, but the dissociation rate constants are quite different, 32 s-1 (stopped flow) versus 4 s-1 (single molecule). Two facts suggest that the estimate of the dissociation constant from the stopped-flow measurements may be too large. First, if the rate constants are used to calculate the equilibrium dissociation constant, a value of ≈7 μM is obtained, significantly larger than the independently measured value of 1.4 μM. The value obtained from the single-molecule measurements is ≈1.5 μM. Second, the dissociation rate constant for the native enzyme is ≈3 s-1 (2). A possible explanation for this difference can be found in the observation that the mechanism for NADPH appears to involve at least three phases, one relatively fast and two slower. If the mechanism in Eq. 1, with NADPH substituted for H2F, is expanded to include all possible species, namely the species, E1.NADPH, and all of the connecting arrows, three time constants characterize the system. Under first-order conditions for all reactions, (NADPH) >> (E1), (E2), the sum of the three pseudo first-order rate constants characterizing the kinetics of this mechanism is (10)
 |
[10] |
The sums are over all of the rate constants in the mechanism. Because one of the pseudo first-order rate constant is much greater than the others, it should be a linear function of the NADPH concentration, and the rate constants for the association and dissociation rate constants calculated in Results are upper bounds, because other rate constants may contribute to the sum.
A surprising result of this work is that NADPH and H2F bind to different conformers of the enzyme. However, as previously mentioned, the existence of multiple conformers of the free enzyme seems quite probable. The slow interconversion of multiple conformers of the free enzyme has been observed (7, 11, 12).
The ensemble average rate constants for the equilibrium mixture of enzyme and substrates at pH 7.5 and 8.5 are somewhat puzzling. The value of 170 s-1 for kf and the isotope effect of >2 when NADPD is substituted for NADPH suggest that hydride transfer is being observed. This is an isotope rate effect observed at the single-molecule level. However, kr does not display an isotope rate effect. The lifetime distributions are quite reproducible and occur only in the presence of all substrates and products. This finding is unlikely to be a photochemical reaction because the same phenomenon is observed at several different laser intensities and only in the presence of all substrates. The value of kf is similar to, but somewhat greater than, the hydride transfer rate constant determined with the stopped-flow measurements at pH 7.0. The hydride transfer rate constant reported for the native enzyme is pH dependent, unlike what is observed for kf (2).
At the present time, we are not able to assign these rate constants to specific steps in the overall reaction. The most probable explanation for the unidirectional isotope effect is that the single exponential deconvolution of the data is an oversimplification. In an equilibrium mixture of products and reactants, many different enzyme species are present. For example, the distribution of lifetimes for the mechanism
 |
[11] |
is the difference between two exponentials if X1 and X2 are fluorescent and X3 is not (13). The experimental precision at short time (μs) is not sufficient to resolve multiexponentials because of the low signal (number of photons). Consequently, it is likely that the rate constants kf and kr are not actually rate constants for the same single step.
These results demonstrate that the mechanism of action of DHFR involves multiple conformations of the enzyme. The hydride transfer reaction can be observed as a distinct step by using Alexa 488 as a reporter group. The transient kinetics and single-molecule results are complementary and for the most part consistent with each other. Future studies will use fluorescence energy transfer between Alexa 488 (near the active site) and sites not near the active site to determine more directly the coupling of conformational changes in the catalytic process.
Acknowledgments
T.S. is a European Molecular Biology Organization Postdoctoral Fellow 2002–2003. This work was supported by National Institutes of Health Grants GM 65128 (to G.G.H.) and GM 24129 (to S.J.B.).
Abbreviations: H2F, dihydrofolate; DHFR, H2F reductase.
References
- 1.Sawaya, M. R. & Kraut, J. (1997) Biochemistry 36, 586-603. [DOI] [PubMed] [Google Scholar]
- 2.Fierke, C. A., Johnson, K. A. & Benkovic, S. J. (1987) Biochemistry 26, 4085-4092. [DOI] [PubMed] [Google Scholar]
- 3.Agarwal, P. K., Billeter, S. R., Rajagopalan, P. T. R., Benkovic, S. J. & Hammes-Schiffer, S. (2002) Proc. Natl. Acad. Sci. USA 99, 2794-2799. [DOI] [PMC free article] [PubMed] [Google Scholar]
- 4.Rajagopalan, P. T. R., Zhang, Z., McCourt, L., Dwyer, M., Benkovic, S. J. & Hammes, G. G. (2002) Proc. Natl. Acad. Sci. USA 99, 13481-13486. [DOI] [PMC free article] [PubMed] [Google Scholar]
- 5.Benkovic, S. J. & Hammes-Schiffer, S. (2003) Science 301, 1196-1202. [DOI] [PubMed] [Google Scholar]
- 6.Kitahara, R., Sareth, S., Yamada, H., Ohamae, E., Gekko, K. & Akasaka, K. (2000) Biochemistry 39, 12789-12795. [DOI] [PubMed] [Google Scholar]
- 7.Blakley, R. L. (1960) Nature 188, 231-232. [Google Scholar]
- 8.Hammes, G. G. (1982) Enzyme Catalysis and Regulation (Academic, New York).
- 9.Chen, J.-T., Taira, K., Tu, C.-P. D. & Benkovic, S. J. (1987) Biochemistry 26, 4093-4100. [DOI] [PubMed] [Google Scholar]
- 10.Hammes, G. G. & Haslam, J. L. (1969) Biochemistry 8, 1591-1598. [DOI] [PubMed] [Google Scholar]
- 11.Cayley, P. J., Dunn, S. M. J. & King, R. W. (1981) Biochemistry 20, 874-879. [DOI] [PubMed] [Google Scholar]
- 12.Penner, M. H. & Frieden, C. (1987) J. Biol. Chem. 262, 15908-15914. [PubMed] [Google Scholar]
- 13.Lu, H. P., Xun, L. & Xie, X. S. (1998) Science 282, 1877-1882. [DOI] [PubMed] [Google Scholar]


