

Abstract
Background
Vitamin D deficiency is common in HIV-infected individuals. In adults, traditional and HIV-related factors play a role in vitamin D status, and deficiency appears to impair immune restoration and exacerbate HIV complications, like cardiovascular disease (CVD). This study sought to determine factors contributing to vitamin D status in HIV-infected youth and investigate the relationship with CVD risk, inflammation, and immune restoration.
Methods
HIV-infected subjects (1–25 years old) were enrolled prospectively along with healthy controls that were group-matched by age, sex, and race. HIV data were collected for the HIV-infected group, while traditional risk factors, including vitamin D intake, sun exposure, skin pigmentation, physical activity level, and body mass index (BMI) were collected for both groups. Fasting lipids, plasma 25-hydroxyvitamin D (25(OH)D), and inflammation markers were measured.
Results
200 HIV-infected subjects and 50 controls were enrolled. HIV group had 53% male, 95% black, and a mean age of 17.2±4.6 years. There was no difference in 25(OH)D between groups; 77% of HIV+ and 74% of controls had 25(OH)D <20 ng/mL. Only Fitzpatrick skin type was independently associated with 25(OH)D. No HIV variables were associated with 25(OH)D, even when HIV sub-populations were examined. Inflammation, CVD risk factors, and immune restoration were not independently associated with 25(OH)D.
Conclusions
Vitamin D deficiency is common among HIV-infected youth. However, HIV factors, CVD risk, inflammation, and immune restoration do not appear to have the same relationship with vitamin D as has been shown in adults. Supplementation trials are needed to determine if increasing 25(OH)D concentrations could better elucidate these relationships.
Introduction
Vitamin D deficiency is widespread among HIV-infected adults and children [1–3]. This population is at a higher risk than the general population for complications like osteoporosis, non-AIDS-defining malignancies, and cardiovascular disease (CVD)–all diseases associated with vitamin D deficiency in the general population [4–7]. We and others have shown that low vitamin D status is independently associated with higher carotid intima-media thickness (IMT), a surrogate marker for subclinical CVD, in HIV-infected adults [2, 8].
Vitamin D plays a critical role in innate and acquired immunity [9, 10], and can inhibit HIV replication by upregulation of the antimicrobial peptide, cathelicidin [11]. Moreover, data suggest that hypovitaminosis D hastens HIV disease progression [12, 13], but higher plasma 25-hydroxyvitamin D (25(OH)D) concentrations contribute to a more favorable immune restoration after antiretroviral therapy (ART) [2]. Therefore, identifying risk factors for vitamin D deficiency and investigating the association with HIV-related complications is critical, particularly in HIV-infected youth, where opportunity exists to optimize health earlier in life.
In HIV-infected adults, multiple factors contribute to vitamin D status including non-HIV-related factors like season, smoking, race, ethnicity, physical inactivity, body mass index (BMI), female sex, hypertension, and sun exposure [14, 15]. However, HIV-related variables also play a role, especially use of the non-nucleoside reverse transcriptase inhibitor (NNRTI), efavirenz (EFV) [15, 16]. For example, HIV treatment may affect vitamin D metabolism as EFV induces CYP24, an enzyme that breaks down the major circulating form of vitamin D, 25(OH)D [16, 17]. Indeed, EFV initiation is associated with a 70–80% increase in the risk of severe vitamin D deficiency, compared to non-EFV regimens [16]. Likewise, some protease inhibitors (PIs) are associated with increased plasma 25(OH)D concentrations [15].
Few studies have investigated risk factors for vitamin D deficiency in HIV-infected youth [3, 18]. In one study, risk factors included older age, African/Caribbean ethnicity, winter season, and NNRTI therapy. Those subjects on NNRTIs had twice the risk compared to those on PIs [18]. The other study showed that vitamin D status was influenced by older age, female sex, winter/spring season, higher BMI, and black race [3]. Poorer immune status was associated with vitamin D deficiency, but vitamin D status was not associated with any HIV variable, including HIV-1 RNA, ART, PI, stavudine, or tenofovir use. Neither study specifically evaluated EFV or included a matched control group. And, importantly, no pediatric HIV study has investigated the association of vitamin D status with immune restoration, inflammation, or with biomarkers known to be increased in CVD, despite evidence that this younger population is at an increased risk like their adult counterparts [19].
Thus, the primary objectives of this study were to 1) determine vitamin D status and prevalence of vitamin D deficiency in HIV-infected youth; 2) identify traditional and HIV-related risk factors for deficiency; 3) evaluate the relationship between vitamin D status and inflammation and cardiovascular biomarkers; and, 4) investigate the association between vitamin D status and immune restoration.
Methods
Study Design/Population
Individuals ages 1–25 years with documented HIV-1 infection who obtained their medical care at the Ponce Youth HIV Clinic of the Grady Health System in Atlanta, GA, USA were eligible for this prospective, cross-sectional study. Patients with acute illnesses were eligible after complete resolution of symptoms for ≥1 month, while those with active inflammatory conditions or medication use known to affect inflammation were not eligible. Eligible HIV-infected patients at the youth clinic were recruited over a 10-month period of time while they were there for their regular clinic visits. Over 95% of approached patients consented to study participation.
Healthy controls were chosen from a convenience sample which included relatives of the hospital staff, relatives of HIV-infected patients, and HIV-negative patients seen at the clinic Controls were recruited with advertisement flyers hung in the HIV clinic and by word of mouth and selected so that the overall group matched the HIV-infected subjects in age, sex, and race. Controls were eligible if they self-reported to be free of chronic disease and had no recent or current infection. Potential subjects ≥13 years of age were screened for HIV infection before enrollment with OraQuick Advance Rapid HIV Test (OraSure Technologies, Inc, Bethlehem, PA, USA). Controls <13 years of age were assumed HIV-uninfected unless they were considered at high-risk for having or contracting HIV. Exclusion criteria for controls were the same as for the infected group.
The study was reviewed and approved by the Institutional Review Boards of Emory University and Grady Health Systems. All parents or legal guardians and subjects ≥18 years of age gave written informed consent to participate in the study. Subjects aged 17 years of age signed the written consent along with their parent or legal guardian. Subjects between the ages of 6–10 years gave verbal assent and those 11–16 years gave written assent.
Clinical Assessments
Study evaluations included physical examination, blood pressure, height, weight, and waist circumference (with standardized measurements based on procedure recommendations from the Metabolic Study Group of the AIDS Clinical Trials Group). All HIV-infected subjects and controls (or guardians) completed questionnaires in order to obtain relevant demographic and medical information. Subject-reported alcohol intake and drug use, smoking habits, family history of CVD, sun exposure, physical activity level, and Fitzpatrick skin type were recorded. Fitzpatrick skin type delineates the amount of skin pigmentation from white skin (always burns and never tans) to naturally pigmented black skin [20]. Vitamin D intake was evaluated with age-appropriate Block food-frequency questionnaires, which evaluate food frequency habits (including supplement use) over the past year, and are well-validated measures of average daily nutrition intake [21–23]. In addition, an extensive chart review was conducted for the HIV+ subjects, including known duration of HIV infection, detailed ART history, past and current medical diagnoses, current medications, and nadir CD4 count.
Laboratory Assessments
Subjects fasted for ≥8 hours prior to blood sampling. Plasma was extracted and stored at −80° C until analysis without prior thawing.
Plasma concentrations of 25(OH)D were measured as the best measure of vitamin D status [24]. All samples were analyzed in the same co-investigator’s laboratory (VT) at Emory University by experienced personnel (SS, RG). Concentrations of 25(OH)D were assessed using specific ELISA kits (IDS, LTD, Fountain Hills, AZ, USA) as per the manufacturer’s product manual and tested in duplicate. Median intra-assay and inter-assay coefficients of variation (CV) were <12%. Quality control was ensured by participation in the vitamin D external quality assessment scheme (DEQAS, site 606). Laboratory personnel were blinded to clinical information.
We adopted the current Institute of Medicine’s (IOM) and Endocrine Society’s guidelines defining vitamin D deficiency as plasma 25(OH)D concentration <20 ng/mL [25, 26], vitamin D insufficiency as plasma 25(OH)D concentration ≥20–29 ng/mL, and optimal vitamin D status as plasma 25(OH)D concentration >29 ng/mL. Severe deficiency was arbitrarily defined as <10 ng/mL, as this cut-off is not universally defined.
We selected biomarkers known to be associated with heightened CVD risk and to be elevated in HIV-infected patients [27–30]. Plasma levels of the proinflammatory cytokines, soluble tumor necrosis factor-α receptors I, II (sTNFR-I, -II) and interleukin-6 (IL-6) were measured using Luminex® System, a multiplexed bead-based assay [31] (IL-6: Millipore, Billerica, MA, USA; sTNFR-I, II: Invitrogen, Carlsbad, CA, USA), and high sensitivity C-reactive protein (hsCRP) was measured by ELISA (Cayman Chemical, Ann Arbor, MI, USA). Endothelial activation markers soluble intercellular adhesion molecule-1 (sICAM-1) and soluble vascular cell adhesion molecule-1 (sVCAM-1) were measured using Luminex (Millipore, Billerica, MA, USA). Biomarkers were measured in the same co-investigator’s (AF) laboratory at Emory University by experienced personnel (GH). Protocols were per manufacturers’ product manuals. Median intra-assay and inter-assay CV were all <10%.
Lipoprotein profiles, glucose, and insulin were measured. Homeostasis model assessment of insulin resistance (HOMA-IR) was calculated using the formula: HOMA-IR = (fasting insulin (μU/ml) × fasting glucose (mg/dL)/405 [32].
CD4 counts and HIV-1 RNA were measured as markers of HIV disease.
Statistical Methods
Sample size was based on 80% statistical power to detect a difference of 10% vs. 25% in severe vitamin D deficiency (<10 ng/mL) in HIV-infected subjects with hsCRP levels above the median compared to those below the median. Two hundred HIV-infected subjects were necessary assuming a 10%-15% prevalence of severe vitamin D deficiency. High-sensitivity CRP was chosen as the main biomarker of interest as it has been associated with vitamin D status in the general population [33], and has the most compelling evidence linking it with CVD risk, including in the HIV-infected population [7]. Comparison to controls was not powered and considered a secondary objective.
Demographics, clinical characteristics, and laboratory parameters are described by HIV status. Continuous measures are described by means/standard deviations or medians/interquartile range, and nominal variables are described with frequencies/percentages.
Descriptive statistics were used to make group comparisons and to compare 25(OH)D status with variables of interest in a univariate manner (Kruskall-Wallis for medians, chi-squared for categorical variables and t-test for means).
To investigate the relationship of plasma 25(OH)D with potential variables, we examined variables of interest in three ways. First, we examined variables of interest in a univariate fashion with Spearman’s rank correlation coefficients (R). We then examined 25(OH)D as a continuous variable in multivariable linear regression and transformed where variables did not meet normality assumptions. Next, multivariable logistic regression was performed to determine predictors of vitamin D deficiency (25(OH)D <20 ng/mL). Analyses were also repeated with sub-populations within the HIV-infected group, including only subjects with CD4 count <25%, then those with HIV-1 RNA levels > or ≤80 copies/mL, then those with age > or ≤15 years old. Finally, to investigate the association between 25(OH)D and immune restoration, we selected subjects who had an HIV-1 RNA level <80 copies/mL and had initiated ART ≥1 year from the time of enrollment.
Variables that were evaluated included 1) clinical assessments and demographics (age, sex, smoking, BMI, season, vitamin D intake, physical activity, Fitzpatrick skin type, race, sun exposure, systolic blood pressure, BMI, and waist circumference), 2) laboratory measurements (each biomarker, lipoprotein profile components, HOMA-IR), and 3) HIV-related variables (time from HIV diagnosis, current CD4 count, current CD4 %, CD4 nadir, ΔCD4 (current – nadir), cumulative EFV use, current EFV use, cumulative NNRTI, current NNRTI, cumulative NRTI use, total ART use, currently on ART yes/no, ART-naïve yes/no, U.S. Centers for Disease Control and Prevention (CDC) HIV clinical category, and HIV-1 RNA).
P values <0.05 were considered significant, except for regression models. Here, given the number of variables evaluated, a more strict value of P<0.01 was set for significance. All analyses were carried out using SAS, v.9.2 (The SAS Institute, Cary, NC, USA).
Results
Study Population
Tables 1 and 2 show demographics, clinical, and laboratory characteristics for both groups. Age, race, sex, and BMI were similar between groups. Median (range) ages among the HIV-infected group and controls were 18.3 (1.3–23.8) and 17.5 (5.4–25.6) years, respectively (P=0.23). High-density lipoprotein (HDL)-cholesterol was lower in the HIV-infected group; whereas, triglycerides were higher. Soluble TNFR-I, sTNFR-II, sVCAM-1, and sICAM-1 were higher in the HIV-infected, but hsCRP and IL-6 were similar between groups. More controls reported lower sun exposure (P=0.03). More HIV+ subjects had blood draws during summer (P<0.001).
Table 1.
Demographics, clinical characteristics, and fasting laboratory parameters by study group
| Mean ± SD, Median (25th, 75th %tile), or no. (%) | HIV+ Group N = 200 |
Healthy Controls N = 50 |
P |
|---|---|---|---|
| Age (years) | 18.3 [14.7, 20.7] | 17.5 [12.6, 21.8] | 0.69 |
| Black race | 190 (95%) | 46 (92%) | 0.34 |
| Fitzpatrick skin type | 0.43 | ||
| I | 2 (1%) | 1 (2%) | |
| II | 6 (3%) | 3 (6%) | |
| III | 34 (17%) | 8 (16%) | |
| IV | 85 (43%) | 26 (52%) | |
| V | 72 (36%) | 12 (24%) | |
| Male sex | 105 (53%) | 27 (54%) | 0.84 |
| Body mass index (kg/m2) | 23.1 ± 9.1 | 24.4 ± 13.4 | 0.44 |
| Waist circumference (cm) | 75.3 ± 14.8 | 73.3 ± 12.8 | 0.07 |
| Systolic blood pressure (mmHg) | 114 [106, 124] | 113 [105, 123] | 0.27 |
| Diastolic blood pressure (mmHg) | 70 [65, 76] | 69 [62, 76] | 0.18 |
| LDL cholesterol (mg/dL) | 93.5 [76, 110] | 81 [68, 112] | 0.15 |
| HDL cholesterol (mg/dL) | 41 [33, 52] | 49 [42, 57] | <0.001 |
| Triglycerides (mg/dL) | 71 [50, 103] | 56 [45, 72] | 0.004 |
| Insulin (μIU/mL) | 7.4 [6.9,8.1] | 7.0 [6.5,14.2] | 0.90 |
| HOMA-IR | 1.55 [1.42,1.80] | 1.50 [1.21,3.17] | 0.27 |
| hsCRP (μg/mL) | 845 [265, 2599] | 566 [207, 2238] | 0.35 |
| Interleukin-6 (pg/mL) | 0.009 [0.009, 0.56] | 0.009 [0.009, 0.15] | 0.17 |
| TNFR-I (pg/mL) | 333.1 [215.8, 702.2] | 93.3 [56.3, 180.8] | <0.001 |
| TNFR-II (pg/mL) | 1010.9 [456.1, 1910.0] | 203.1 [148.4, 290.5] | <0.001 |
| sVCAM-1 (ng/mL) | 1424.4 [1152.5, 1751.8] | 1149.8 [906.8, 1341.3] | <0.001 |
| sICAM-1 (ng/mL) | 150.7 [113.2, 200.2] | 113.1 [94.2, 137.5] | <0.001 |
| Current smoker | 33 (17%) | 4 (8%) | 0.24 |
| High physical activitya | 76 (38%) | 11 (22%) | 0.09 |
| Low sun exposureb | 68 (34%) | 27 (54%) | 0.03 |
| Summer blood drawc | 48 (24%) | 5 (10%) | <0.001 |
| Vitamin D intake (IU) | 122 (69, 209) | 132 (74, 248) | 0.22 |
High physical activity level defined as >12 hours subject-reported any type of physical activity per week;
low sun exposure defined as <2 hours subject-reported per day, averaged between weekdays and weekend days;
summer blood draw defined as June–August.
LDL, low-density lipoprotein; HDL, high-density lipoprotein; HOMA-IR, homeostasis model assessment of insulin resistance; sTNFR-I, soluble tumor necrosis factor-α receptor-I; hsCRP, high sensitivity C-reactive protein; IL-6, interleukin-6; sICAM-1, soluble intercellular adhesion molecule-1; sVCAM-1, soluble vascular cell adhesion molecule-1
Table 2.
Characteristics of HIV-infected group
| Median (25th, 75th %tile), or no. (%) | |
|---|---|
| Time from HIV diagnosis (years) | 12 [3, 17] |
| Perinatally-infected | 128 (64%) |
| CD4 cell count (cells/mm3) | 424 [255, 675] |
| CD4 cell count % | 26 [18, 34] |
| CD4 cell count nadir (cells/mm3) | 246 [100, 397] |
| ΔCD4 cell count (N=27)a | 138 [32, 320] |
| ART-naïve | 27 (14%) |
| Current ART use | 137 (69%) |
| Current efavirenz use | 36 (18%) |
| HIV-1 RNA <80 copies/mL | 100 (50%) |
| Cumulative NRTI use (months) | 61.3 [10.8, 127.6] |
| Cumulative PI use (months) | 40.7 (0,93.3) |
| Cumulative NNRTI use (months) | 0 [0, 17] |
| Cumulative efavirenz use (months) | 0 [0, 12] |
ΔCD4 cell count = current – nadir CD4 cell count; includes subjects who had an HIV-1 RNA level <80 copies/mL and had initiated antiretroviral therapy ≥1 year from the time of enrollment.
ART, antiretroviral therapy; NRTI, nucleoside/nucleotide analogue reverse transcriptase inhibitor
Vitamin D Status in HIV-infected Subjects and Controls
Unadjusted 25(OH)D means were similar between groups (Figure 1). After adjusting for age, Fitzpatrick skin type (or race), gender, season, sun exposure, physical activity, and BMI, the results were similar. Means for both groups were in the deficient range (25(OH)D <20 ng/mL). The majority of subjects (77% HIV-infected; 76% controls) had frank vitamin D deficiency, including 14% and 4%, respectively, in the severely deficient range (<10 ng/mL) (Figure 2). Only 4% of the HIV-infected group and 2% of the controls had optimal concentrations (25(OH)D ≥30 ng/mL). After adjusting for the above variables, there was no difference in the number of subjects from each group who had vitamin D deficiency (odds ratio (OR) 1.10; 95% confidence interval (CI) 0.39,3.15; P=0.97). Both groups had very low dietary vitamin D intake relative to current recommendations [26].
Figure 1.

Mean 25-hydroxyvitamin D concentrations are shown by study group, unadjusted and adjusted for age, Fitzpatrick skin scale score, gender, season, sun exposure, physical activity, and body mass index. There were no significant differences between groups. Error bars represent standard deviation.
Figure 2.
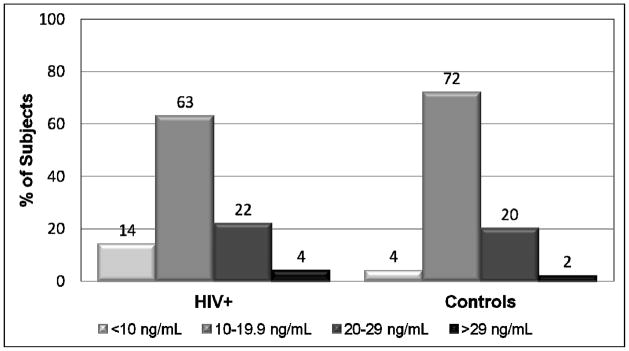
The percentages of subjects with different categories of 25(OH)D concentration are depicted by study group. The proportion of subjects with vitamin D deficiency (25(OH)D <20 ng/mL) was no different between groups (odds ratio 1.10, 95% confidence interval 0.39, 3.15, P=0.97). <10 ng/mL = severe vitamin D deficiency; 10–19.9 ng/mL = vitamin D deficiency; 20–29 ng/mL = vitamin D insufficiency; >29 ng/mL = optimal vitamin D. 25(OH)D), 25-hydroxyvitamin D.
Traditional and HIV-Related Factors Associated with Vitamin D Status
Potential traditional and HIV-related factors associated with vitamin D status were considered in a univariate relationship as described in the methods. A significant correlation was seen between plasma 25(OH)D and Fitzpatrick skin type (P=0.003). All other tested variables were P>0.10, regardless of the sub-population tested.
Potential factors associated with vitamin D status were considered in a multivariable linear regression model with groups combined. Variables included were age, race, sex, season, sun exposure, vitamin D intake, physical activity, BMI, and study group. Race was the only variable significantly associated with vitamin D status (P=0.006). When race was replaced with Fitzpatrick skin type, an even stronger association was observed (P<0.001). Figure 3 shows the significant relationship between adjusted mean 25(OH)D and Fitzpatrick skin type.
Figure 3.

Mean 25-hydroxyvitamin D (25(OH)D) concentrations are shown based on Fitzpatrick skin type for all subjects and separately for black subjects. This figure indicates that Fitzpatrick skin type is associated with 25(OH)D concentration for all races, although driven mainly by the black subjects. Fitzpatrick skin types 4 and 5 have the lowest concentrations of 25(OH)D, all of whom were black. The association between 25(OH)D and Fitzpatrick skin type remained significant for the whole cohort and when limited to black race (P<0.001), even after adjusting for age, race, sex, season, sun exposure, physical activity, body mass index, and study group. Error bars represent standard error. Fitzpatrick skin type 1: N=2 (0% black); type 2: N=6 (0% black); type 3: N=34 (92% black); type 4: N=85 (100% black); type 5: N=72 (100% black).
Multivariable linear regression was then performed with each group separately, and results were similar. In the HIV-infected group, the following HIV variables were added one by one into the model: current CD4 and CD4 %, nadir CD4, cumulative/current EFV use, cumulative/current NNRTI, known HIV duration, total ART duration, and HIV-1 RNA level. None of these variables were significant; yet, Fitzpatrick skin type remained significant (P=0.003). The model was further limited to include only subjects with CD4 count <25%, then those with HIV-1 RNA levels > or ≤80 copies/mL, then those with age > or ≤15 years old; the results did not change for any of these.
Next, a multivariable logistic regression was performed using 25(OH)D as a dichotomous variable, < vs. ≥20 ng/mL, to investigate associations with vitamin D deficiency, using Fitzpatrick skin type in place of race given the results of the multivariable linear regression. The only variable associated with vitamin D deficiency for both groups was Fitzpatrick skin type (HIV+: OR 1.66 (95% CI 1.10,2.52), P=0.02; controls: OR 5.27 (95% CI 1.14,24.30), P=0.04). Physical inactivity was also associated with vitamin D deficiency in the control group (OR 4.58 (95% CI 1.05,19.96), P=0.03), but not in the HIV-infected group (OR 1.94 (95% CI 0.90,4.17), P=0.15). HIV variables considered in the multivariable linear regression were also considered in this model for the HIV-infected group; none were significant.
Relationship Between Vitamin D Status and Inflammation and Metabolic Markers
Cardiovascular risk factors, including BMI, HOMA-IR, waist circumference, LDL-cholesterol, HDL-cholesterol, systolic blood pressure, smoking, and each biomarker were considered in a univariate fashion for each group separately. In the HIV-infected group, only sVCAM-1 was positively correlated with 25(OH)D (R=0.20, P=0.004). In controls, HOMA-IR was negatively correlated with 25(OH)D (R=−0.36, P=0.02).
Each of these variables was added one by one to a multivariable linear regression model which included traditional factors known to affect vitamin D (age, Fitzpatrick skin type, sex, season of blood draw, and vitamin D intake). No variable was significantly associated with vitamin D in either group.
Relationship Between Vitamin D Status and Immune Restoration
In subjects who had been on ART for ≥1 year from enrollment with an HIV-1 RNA level <80 copies/mL (N=84), there was not a significant relationship between 25(OH)D and ΔCD4. Also, within this sub-population, there were no other variables that were significant with 25(OH)D in univariate analysis or multivariable regression analyses.
Discussion
The purpose of our study was to determine vitamin D status and the prevalence of vitamin D deficiency in HIV-infected youth, identify traditional and HIV-related risk factors for deficiency, and investigate the relationships among vitamin D status, markers known to be increased in CVD, CVD risk factors, and immune restoration. We found a very high prevalence of vitamin D deficiency in both the HIV-infected and control groups, similar to other studies [18, 34]. In fact, the 25(OH)D mean was very low, well below current recommendations [26]. The only factor that was independently associated with vitamin D status and vitamin D deficiency for both groups was Fitzpatrick skin type. Vitamin D status was not independently associated with other traditional risk factors, CVD risk factors, inflammation markers, endothelial activation markers, or immune restoration.
HIV-infected youth are expected to live well into adulthood due to combination ART; however, HIV-infected adults are developing complications at rates higher than the general population, including osteoporosis, non-AIDS-defining malignancies, and subclinical CVD [6, 7, 35]. Notably, many of the emerging complications represent disease processes where vitamin D is known to play an important role. For example, vitamin D deficiency is associated with CVD development in the general population [36, 37], and strikingly, is associated with a 2-fold risk of an initial cardiovascular event in previously healthy asymptomatic individuals [4]. Proposed mechanisms of vitamin D’s direct role in CVD include effects on proinflammatory cytokines [38] and the vasculature [39, 40], and inhibition of the renin-angiotensin-II aldosterone system [41]. Vitamin D is also critical in many processes, such as exercise capacity, triglyceride levels, obesity, blood pressure, and diabetes [42–44], which may have indirect effects on CVD risk.
We have shown a relationship between vitamin D status and CVD in ART-stable, HIV-infected adults, where an independent association was observed between vitamin D status and carotid IMT [2]. In fact, subjects with common carotid artery IMT levels above the median were 10-fold more likely to have the lowest 25(OH)D concentrations. Vitamin D status was also associated with the inflammatory and endothelial activation markers, sTNFR-1 and sICAM-1, both shown to be associated with CVD and atherosclerosis development in the general population [29, 30]. In this current HIV-infected youth study, we did not observe an association between vitamin D and CVD risk factors. Similarly, the only biomarker which showed a relationship with vitamin D in the HIV-infected group was sVCAM-1, which was only significant in a univariate fashion. This may be due to the fact that the 25(OH)D concentration was low in most subjects, precluding an adequate separation of vitamin D concentrations to accurately measure differences among dependent variables, or HIV-infected youth may have a lower CVD risk burden than adults.
Alternatively, most general adult studies have evaluated mainly white subjects (a 2010 systematic review of 43,527 participants showed 89% were white [45]); whereas, 95% of our subjects were black. Thus, it is possible that the 25(OH)D concentration that has been suggested for optimal CVD health is not relevant in the black population, or vitamin D deficiency does not have the same effect on CVD risk. However, several small studies in the general black population, evaluating both adults and adolescents, suggest that blacks are in fact similar to whites with regard to vitamin D status and vascular health. When subjects’ 25(OH)D concentrations were increased with oral supplementation, both studies showed an improvement in endothelial function (black adults) and arterial stiffness (black adolescents) [46, 47]. Thus, supplementation trials are urgently needed in the HIV-infected population in order to define optimal dosing regimens for vitamin D repletion and to further evaluate the association between vitamin D status and CVD risk, especially in youth where optimizing vitamin D concentrations at an earlier age may impact later HIV-related chronic disorders associated with inadequate vitamin D nutriture in non-HIV populations.
In ART-treated adults, we have also shown an independent association between vitamin D status and immune reconstitution, where subjects with higher plasma 25(OH)D concentrations exhibited a more robust increase in CD4 count after starting ART [2]. In this HIV-infected youth study, it was not significant. Likewise, we did not demonstrate a correlation between vitamin D status and current CD4 counts, despite vitamin D’s known role in immunity. This could be due to our low overall mean 25(OH)D concentration, or the study could be underpowered. Studies have shown that low vitamin D hastens HIV disease progression [12, 13]; however, studies have been conflicting on the relationship between vitamin D concentrations and CD4 counts. While one study found a positive relationship between vitamin D dietary intake and CD4 counts [48], two others reported that 6–12 months of vitamin D supplementation in HIV-infected children did not change CD4 counts [49, 50]. Notably, these two studies were small, supplementation doses were low, and baseline 25(OH)D were higher than in this current study. Alternatively, low vitamin D status may be a marker of poor health over a longer period of time as compared to vitamin D status in children. Thus, further studies are needed to fully evaluate vitamin D status and immune restoration in HIV-infected youth.
The low 25(OH)D in our study may be a reason for the lack of an association between vitamin D status and HIV-related factors, such as EFV use. In HIV-infected adults, EFV and PIs have been shown to affect vitamin D metabolism [15–17]. Our study is the first that has specifically evaluated EFV in HIV-infected children, but did not show an association. Again, vitamin D supplementation trials are necessary to adequately evaluate whether specific antiretrovirals interfere with 25(OH)D metabolism in this population. In our randomized-controlled trial of 4,000 IU vitamin D3 daily versus placebo for 12 weeks in 45 HIV-infected adults on stable ART with baseline 25(OH)D ≤20 ng/mL, participants in the vitamin D arm who were on EFV had no increase in 25(OH)D (P=0.383), while those who received vitamin D and were not on EFV had a significant increase (P=0.005) [17]. It is likely that we would find similar results in HIV-infected youth, which may have serious long-term implications since most will experience a lifetime of ART. Establishing adequate repletion strategies specifically for this population, and perhaps based on their ART regimen, may maximize immune function and minimize long-term complications.
One important finding in our study was the strong association between vitamin D status and Fitzpatrick skin type, which had a stronger association than race, even among black subjects. No published study investigating vitamin D status in HIV has evaluated skin pigmentation in lieu of race. It has long been known that blacks have a higher prevalence of vitamin D deficiency due to increased skin pigmentation which decreases the production of vitamin D3 in the skin [51]. However, this study suggests that skin pigmentation may be a better method of identifying people who are the most at risk. This may be particularly important in the HIV-infected population, as identifying and treating vitamin D deficiency may minimize HIV-related complications.
There are limitations to this study, including a cross-sectional design which cannot prove causality. However, these results can inform the design of longitudinal and interventional studies to further define these relationships. Likewise, there was a relatively small control group, and our subject population had considerable heterogeneity, as we evaluated a wide-age range, as well as a combination of behaviorally- and perinatally-infected subjects. Age was not significant in the multivariable regression analyses; therefore, it is reasonable to compare vitamin D status among these subjects. In addition, there was no difference in the number of behaviorally- and perinatally-infected subjects who had a CDC surveillance definition of AIDS (data not shown). Most of the detectable differences between the two groups [e.g. 80% of perinatal group currently on ART versus 50% in behavioral group; perinatal current CD4 count (CD4%) = 566 cells/mm3 (28%) versus 371 cells/mm3 (23%); both P<0.001] were included in the regression analyses and were not significant. Finally, physical activity, sun exposure, and food intake data were subject-reported, which may not be accurate.
Nevertheless, the important point is the high prevalence of vitamin D deficiency in the HIV-infected group. With a 77% and 96% prevalence of vitamin D deficiency and insufficiency, respectively, nearly all HIV-infected youth are affected by this condition. In a population that is already at an increased risk of CVD and other HIV-related complications known to be associated with vitamin D, the findings of this study suggest that vitamin D deficiency is a modifiable risk that deserves further attention.
To our knowledge, this is the first study to comprehensively investigate traditional and HIV-related risk factors for vitamin D deficiency in HIV-infected youth, and to explore the relationship between vitamin D status, CVD risk, inflammation markers, endothelial adhesion markers, and immune restoration. These results are novel, and offer insight into vitamin D deficiency in this understudied population. Importantly, these results suggest that vitamin D supplementation trials are needed to adequately evaluate the clinical significance of vitamin D deficiency and to determine if there are positive consequences to optimizing 25(OH)D concentrations. Studying these elements in HIV-infected youth is an innovative approach to identifying efficacious prevention strategies which may help preclude treatment of established disease and decelerate HIV disease progression.
Acknowledgments
Sources of Funding: The study was supported by research grants to Dr. Ross from GlaxoSmithKline, Emory-Egleston Children’s Research Center, Emory’s Center for AIDS Research (P30 AI050409), and NICHD (R01 HD070490). The funding agencies have no access to the raw data and no role in the analysis or writing of this manuscript.
Allison C. Ross was involved in study design, data collection, data analysis, data interpretation, and manuscript writing; Suzanne Judd was involved in data analysis, data interpretation, and manuscript writing; Thomas Ziegler was involved in study design; Andres Camacho-Gonzalez was involved in data collection; Anne Fitzpatrick and Graham Hadley measured inflammatory biomarkers; Ruth Grossmann and Shabnam Seydafkan measured 25-hydroxyvitamin D; Mark Mulligan and Nayoka Rimman were involved in blood specimen processing; LaTeshia Seaton enrolled subjects and collected data. Vin Tangpricha and Grace McComsey were involved in study design, data analysis, data interpretation, and manuscript writing. The study was supported by research grants to Dr. Ross from GlaxoSmithKline, Emory-Egleston Children’s Research Center, Emory’s Center for AIDS Research (P30 AI050409), and NICHD (R01 HD070490). The funding agencies have no access to the raw data and no role in the analysis or writing of this manuscript. We would also like to acknowledge Lilin Lai, Kai Ying, Michael Noback, Dongli Wang, and Rui Zheng who contributed to blood specimen processing.
Footnotes
Previous Publication: Data in part were presented previously at 13th International Workshop on Adverse Drug Reactions and Co-morbidities in HIV, Rome, Italy, July 2011 and published as an abstract as:
Ross AC, Judd S, Ziegler TR, Camacho-Gonzalez A, Fitpatrick A, Hadley G, Grossman R, Seydafkan S, Seaton L, Mulligan MJ, Rimann N, Lai L, Ying K, Noback M, Wang D, Zheng, Tangpricha V, McComsey GA (2011). Abstract O-10. Traditional Risk Factors Overshadow HIV-Related Factors in Predicting Vitamin D Deficiency in HIV-Infected Children and Young Adults. Abstract. Antiviral Therapy, 16 (Suppl 2), A9.
Conflicts of Interest: ACR has received research funding from Bristol-Myers Squibb, Cubist Pharmaceuticals, and GlaxoSmithKline. GAM serves as a consultant, speaker, and has received research funding from Bristol-Myers Squibb, GlaxoSmithKline, Gilead, and Tibotec. GAM currently chairs a DSMB for a Pfizer-funded study. ACG has received research funding from Bristol-Myers Squibb. All other authors declare no conflicts of interest.
References
- 1.Stephensen CB, Marquis GS, Kruzich LA, Douglas SD, Aldrovandi GM, Wilson CM. Vitamin D status in adolescents and young adults with HIV infection. American Journal of Clinical Nutrition. 2006;83:1135–1141. doi: 10.1093/ajcn/83.5.1135. [DOI] [PubMed] [Google Scholar]
- 2.Ross AC, Judd S, Kumari M, Hileman C, Storer N, Labbato D, Tangpricha V, McComsey GA. Vitamin D is linked to carotid intima-media thickness and immune reconstitution in HIV-positive individuals. Antivir Ther. 2011;16:555–563. doi: 10.3851/IMP1784. [DOI] [PMC free article] [PubMed] [Google Scholar]
- 3.Rutstein R, Downes A, Zemel B, Schall J, Stallings V. Vitamin D status in children and young adults with perinatally acquired HIV infection. Clin Nutr. 2011;30:624–628. doi: 10.1016/j.clnu.2011.02.005. [DOI] [PubMed] [Google Scholar]
- 4.Wang TJ, Pencina MJ, Booth SL, Jacques PF, Ingelsson E, Lanier K, Benjamin EJ, D’Agostino RB, Wolf M, Vasan RS. Vitamin D deficiency and risk of cardiovascular disease. Circulation. 2008;117:503–511. doi: 10.1161/CIRCULATIONAHA.107.706127. [DOI] [PMC free article] [PubMed] [Google Scholar]
- 5.Giovannucci E. Vitamin D status and cancer incidence and mortality. Advances in Experimental Medicine & Biology. 2008;624:31–42. doi: 10.1007/978-0-387-77574-6_3. [DOI] [PubMed] [Google Scholar]
- 6.Brown TT, Qaqish RB. Antiretroviral therapy and the prevalence of osteopenia and osteoporosis: a meta-analytic review. [see comment] AIDS. 2006;20:2165–2174. doi: 10.1097/QAD.0b013e32801022eb. [DOI] [PubMed] [Google Scholar]
- 7.Triant VA, Lee H, Hadigan C, Grinspoon SK. Increased acute myocardial infarction rates and cardiovascular risk factors among patients with human immunodeficiency virus disease. Journal of Clinical Endocrinology & Metabolism. 2007;92:2506–2512. doi: 10.1210/jc.2006-2190. [DOI] [PMC free article] [PubMed] [Google Scholar]
- 8.Choi AI, Lo JC, Mulligan K, Schnell A, Kalapus SC, Li Y, Hunt PW, Martin JN, Deeks SG, Hsue PY. Association of vitamin D insufficiency with carotid intima-media thickness in HIV-infected persons. Clin Infect Dis. 2011;52:941–944. doi: 10.1093/cid/ciq239. [DOI] [PMC free article] [PubMed] [Google Scholar]
- 9.van Etten E, Stoffels K, Gysemans C, Mathieu C, Overbergh L. Regulation of vitamin D homeostasis: implications for the immune system. Nutr Rev. 2008;66:S125–134. doi: 10.1111/j.1753-4887.2008.00096.x. [DOI] [PubMed] [Google Scholar]
- 10.Kamen DL, Tangpricha V. Vitamin D and molecular actions on the immune system: modulation of innate and autoimmunity. J Mol Med (Berl) 2010;88:441–450. doi: 10.1007/s00109-010-0590-9. [DOI] [PMC free article] [PubMed] [Google Scholar]
- 11.Bergman P, Walter-Jallow L, Broliden K, Agerberth B, Soderlund J. The antimicrobial peptide LL-37 inhibits HIV-1 replication. Curr HIV Res. 2007;5:410–415. doi: 10.2174/157016207781023947. [DOI] [PubMed] [Google Scholar]
- 12.Viard JP, Souberbielle JC, Kirk O, Reekie J, Knysz B, Losso M, Gatell J, Pedersen C, Bogner JR, Lundgren JD, Mocroft A. Vitamin D and clinical disease progression in HIV infection: results from the EuroSIDA study. AIDS. 2011;25:1305–1315. doi: 10.1097/QAD.0b013e328347f6f7. [DOI] [PubMed] [Google Scholar]
- 13.Mehta S, Giovannucci E, Mugusi FM, Spiegelman D, Aboud S, Hertzmark E, Msamanga GI, Hunter D, Fawzi WW. Vitamin D status of HIV-infected women and its association with HIV disease progression, anemia, and mortality. PLoS One. 2010;5:e8770. doi: 10.1371/journal.pone.0008770. [DOI] [PMC free article] [PubMed] [Google Scholar]
- 14.Van Den Bout-Van Den Beukel CJ, Fievez L, Michels M, Sweep FC, Hermus AR, Bosch ME, Burger DM, Bravenboer B, Koopmans PP, Van Der Ven AJ. Vitamin D deficiency among HIV type 1-infected individuals in the Netherlands: effects of antiretroviral therapy. AIDS Res Hum Retroviruses. 2008;24:1375–1382. doi: 10.1089/aid.2008.0058. [DOI] [PubMed] [Google Scholar]
- 15.Dao CN, Patel P, Overton ET, Rhame F, Pals SL, Johnson C, Bush T, Brooks JT. Low vitamin D among HIV-infected adults: prevalence of and risk factors for low vitamin D Levels in a cohort of HIV-infected adults and comparison to prevalence among adults in the US general population. Clin Infect Dis. 2011;52:396–405. doi: 10.1093/cid/ciq158. [DOI] [PubMed] [Google Scholar]
- 16.Brown TT, McComsey GA. Association between initiation of antiretroviral therapy with efavirenz and decreases in 25-hydroxyvitamin D. Antivir Ther. 2010;15:425–429. doi: 10.3851/IMP1502. [DOI] [PubMed] [Google Scholar]
- 17.Longenecker C, Hileman C, Carman T, Ross A, Tangpricha V, Seydayfkan S, Brown T, Labbato D, Storer N, McComsey G. Vitamin D supplementation and endothelial function among vitamin D deficient HIV-infected persons: a randomized placebo-controlled trial. Antiviral Therapy. doi: 10.3851/IMP1983. in press. [DOI] [PMC free article] [PubMed] [Google Scholar]
- 18.Atkinson S, Bird L, Patel D, Monrose C, Tudor-Williams G, CF . British HIV Association. Manchester, UK: 2010. Vitamin D deficiency in children with perinatally acquired HIV-1 infection living in the UK (abstract P159) [Google Scholar]
- 19.McComsey GA, O’Riordan M, Hazen SL, El-Bejjani D, Bhatt S, Brennan ML, Storer N, Adell J, Nakamoto DA, Dogra V. Increased carotid intima media thickness and cardiac biomarkers in HIV infected children. AIDS. 2007;21:921–927. doi: 10.1097/QAD.0b013e328133f29c. [DOI] [PubMed] [Google Scholar]
- 20.Fitzpatrick TB. The validity and practicality of sun-reactive skin types I through VI. Arch Dermatol. 1988;124:869–871. doi: 10.1001/archderm.124.6.869. [DOI] [PubMed] [Google Scholar]
- 21.Block G, Hartman AM, Dresser CM, Carroll MD, Gannon J, Gardner L. A data-based approach to diet questionnaire design and testing. Am J Epidemiol. 1986;124:453–469. doi: 10.1093/oxfordjournals.aje.a114416. [DOI] [PubMed] [Google Scholar]
- 22.Block G, Coyle LM, Hartman AM, Scoppa SM. Revision of dietary analysis software for the Health Habits and History Questionnaire. Am J Epidemiol. 1994;139:1190–1196. doi: 10.1093/oxfordjournals.aje.a116965. [DOI] [PubMed] [Google Scholar]
- 23.Block G, Woods M, Potosky A, Clifford C. Validation of a self-administered diet history questionnaire using multiple diet records. J Clin Epidemiol. 1990;43:1327–1335. doi: 10.1016/0895-4356(90)90099-b. [DOI] [PubMed] [Google Scholar]
- 24.Holick MF. Vitamin D deficiency. N Engl J Med. 2007;357:266–281. doi: 10.1056/NEJMra070553. [DOI] [PubMed] [Google Scholar]
- 25.Holick MF, Binkley NC, Bischoff-Ferrari HA, Gordon CM, Hanley DA, Heaney RP, Murad MH, Weaver CM. Evaluation, treatment, and prevention of vitamin D deficiency: an Endocrine Society clinical practice guideline. J Clin Endocrinol Metab. 2011;96:1911–1930. doi: 10.1210/jc.2011-0385. [DOI] [PubMed] [Google Scholar]
- 26.Institute of Medicine (U.S.) Dietary Reference Intakes for Calcium and Vitamin D. The National Academies Press; Washington, DC: 2011. [PubMed] [Google Scholar]
- 27.Pai JK, Pischon T, Ma J, Manson JE, Hankinson SE, Joshipura K, Curhan GC, Rifai N, Cannuscio CC, Stampfer MJ, Rimm EB. Inflammatory markers and the risk of coronary heart disease in men and women. N Engl J Med. 2004;351:2599–2610. doi: 10.1056/NEJMoa040967. [DOI] [PubMed] [Google Scholar]
- 28.Ridker PM, Rifai N, Rose L, Buring JE, Cook NR. Comparison of C-reactive protein and low-density lipoprotein cholesterol levels in the prediction of first cardiovascular events. N Engl J Med. 2002;347:1557–1565. doi: 10.1056/NEJMoa021993. [DOI] [PubMed] [Google Scholar]
- 29.Ridker PM, Rifai N, Pfeffer M, Sacks F, Lepage S, Braunwald E. Elevation of tumor necrosis factor-alpha and increased risk of recurrent coronary events after myocardial infarction. Circulation. 2000;101:2149–2153. doi: 10.1161/01.cir.101.18.2149. [DOI] [PubMed] [Google Scholar]
- 30.Hwang SJ, Ballantyne CM, Sharrett AR, Smith LC, Davis CE, Gotto AM, Jr, Boerwinkle E. Circulating adhesion molecules VCAM-1, ICAM-1, and E-selectin in carotid atherosclerosis and incident coronary heart disease cases: the Atherosclerosis Risk In Communities (ARIC) study. Circulation. 1997;96:4219–4225. doi: 10.1161/01.cir.96.12.4219. [DOI] [PubMed] [Google Scholar]
- 31.Morgan E, Varro R, Sepulveda H, Ember JA, Apgar J, Wilson J, Lowe L, Chen R, Shivraj L, Agadir A, Campos R, Ernst D, Gaur A. Cytometric bead array: a multiplexed assay platform with applications in various areas of biology. Clin Immunol. 2004;110:252–266. doi: 10.1016/j.clim.2003.11.017. [DOI] [PubMed] [Google Scholar]
- 32.Matthews DR, Hosker JP, Rudenski AS, Naylor BA, Treacher DF, Turner RC. Homeostasis model assessment: insulin resistance and beta-cell function from fasting plasma glucose and insulin concentrations in man. Diabetologia. 1985;28:412–419. doi: 10.1007/BF00280883. [DOI] [PubMed] [Google Scholar]
- 33.Shea MK, Booth SL, Massaro JM, Jacques PF, D’Agostino RB, Sr, Dawson-Hughes B, Ordovas JM, O’Donnell CJ, Kathiresan S, Keaney JF, Jr, Vasan RS, Benjamin EJ. Vitamin K and vitamin D status: associations with inflammatory markers in the Framingham Offspring Study. Am J Epidemiol. 2008;167:313–320. doi: 10.1093/aje/kwm306. [DOI] [PMC free article] [PubMed] [Google Scholar]
- 34.Cole CR, Grant FK, Tangpricha V, Swaby-Ellis ED, Smith JL, Jacques A, Chen H, Schleicher RL, Ziegler TR. 25-hydroxyvitamin D status of healthy, low-income, minority children in Atlanta, Georgia. Pediatrics. 2010;125:633–639. doi: 10.1542/peds.2009-1928. [DOI] [PMC free article] [PubMed] [Google Scholar]
- 35.Martinez E, Milinkovic A, Buira E, de Lazzari E, Leon A, Larrousse M, Lonca M, Laguno M, Blanco JL, Mallolas J, Garcia F, Miro JM, Gatell JM. Incidence and causes of death in HIV-infected persons receiving highly active antiretroviral therapy compared with estimates for the general population of similar age and from the same geographical area. HIV Medicine. 2007;8:251–258. doi: 10.1111/j.1468-1293.2007.00468.x. [DOI] [PubMed] [Google Scholar]
- 36.Judd SE, Tangpricha V. Vitamin D deficiency and risk for cardiovascular disease. Am J Med Sci. 2009;338:40–44. doi: 10.1097/MAJ.0b013e3181aaee91. [DOI] [PMC free article] [PubMed] [Google Scholar]
- 37.Targher G, Bertolini L, Padovani R, Zenari L, Scala L, Cigolini M, Arcaro G. Serum 25-hydroxyvitamin D3 concentrations and carotid artery intima-media thickness among type 2 diabetic patients. Clinical Endocrinology. 2006;65:593–597. doi: 10.1111/j.1365-2265.2006.02633.x. [DOI] [PubMed] [Google Scholar]
- 38.Schleithoff SS, Zittermann A, Tenderich G, Berthold HK, Stehle P, Koerfer R. Vitamin D supplementation improves cytokine profiles in patients with congestive heart failure: a double-blind, randomized, placebo-controlled trial. [see comment] American Journal of Clinical Nutrition. 2006;83:754–759. doi: 10.1093/ajcn/83.4.754. [DOI] [PubMed] [Google Scholar]
- 39.Tishkoff DX, Nibbelink KA, Holmberg KH, Dandu L, Simpson RU. Functional vitamin D receptor (VDR) in the t-tubules of cardiac myocytes: VDR knockout cardiomyocyte contractility. Endocrinology. 2008;149:558–564. doi: 10.1210/en.2007-0805. [DOI] [PMC free article] [PubMed] [Google Scholar]
- 40.Simpson RU, Hershey SH, Nibbelink KA. Characterization of heart size and blood pressure in the vitamin D receptor knockout mouse. Journal of Steroid Biochemistry & Molecular Biology. 2007;103:521–524. doi: 10.1016/j.jsbmb.2006.12.098. [DOI] [PMC free article] [PubMed] [Google Scholar]
- 41.Li YC, Qiao G, Uskokovic M, Xiang W, Zheng W, Kong J. Vitamin D: a negative endocrine regulator of the renin-angiotensin system and blood pressure. J Steroid Biochem Mol Biol. 2004;89–90:387–392. doi: 10.1016/j.jsbmb.2004.03.004. [DOI] [PubMed] [Google Scholar]
- 42.Cannell JJ, Hollis BW, Sorenson MB, Taft TN, Anderson JJ. Athletic performance and vitamin D. Med Sci Sports Exerc. 2009;41:1102–1110. doi: 10.1249/MSS.0b013e3181930c2b. [DOI] [PubMed] [Google Scholar]
- 43.Martins D, Wolf M, Pan D, Zadshir A, Tareen N, Thadhani R, Felsenfeld A, Levine B, Mehrotra R, Norris K. Prevalence of cardiovascular risk factors and the serum levels of 25-hydroxyvitamin D in the United States: data from the Third National Health and Nutrition Examination Survey. Arch Intern Med. 2007;167:1159–1165. doi: 10.1001/archinte.167.11.1159. [DOI] [PubMed] [Google Scholar]
- 44.Judd SE, Nanes MS, Ziegler TR, Wilson PW, Tangpricha V. Optimal vitamin D status attenuates the age-associated increase in systolic blood pressure in white Americans: results from the third National Health and Nutrition Examination Survey. American Journal of Clinical Nutrition. 2008;87:136–141. doi: 10.1093/ajcn/87.1.136. [DOI] [PubMed] [Google Scholar]
- 45.Pittas AG, Chung M, Trikalinos T, Mitri J, Brendel M, Patel K, Lichtenstein AH, Lau J, Balk EM. Systematic review: Vitamin D and cardiometabolic outcomes. Ann Intern Med. 2010;152:307–314. doi: 10.1059/0003-4819-152-5-201003020-00009. [DOI] [PMC free article] [PubMed] [Google Scholar]
- 46.Harris RA, Pedersen-White J, Guo DH, Stallmann-Jorgensen IS, Keeton D, Huang Y, Shah Y, Zhu H, Dong Y. Vitamin D3 supplementation for 16 weeks improves flow-mediated dilation in overweight African-American adults. Am J Hypertens. 2011;24:557–562. doi: 10.1038/ajh.2011.12. [DOI] [PMC free article] [PubMed] [Google Scholar]
- 47.Dong Y, Stallmann-Jorgensen IS, Pollock NK, Harris RA, Keeton D, Huang Y, Li K, Bassali R, Guo DH, Thomas J, Pierce GL, White J, Holick MF, Zhu H. A 16-week randomized clinical trial of 2000 international units daily vitamin D3 supplementation in black youth: 25-hydroxyvitamin D, adiposity, and arterial stiffness. J Clin Endocrinol Metab. 2010;95:4584–4591. doi: 10.1210/jc.2010-0606. [DOI] [PubMed] [Google Scholar]
- 48.de Luis DA, Bachiller P, Aller R, de Luis J, Izaola O, Terroba MC, Cuellar L, Gonzalez Sagrado M. Relation among micronutrient intakes with CD4 count in HIV infected patients. Nutr Hosp. 2002;17:285–289. [PubMed] [Google Scholar]
- 49.Arpadi SM, McMahon D, Abrams EJ, Bamji M, Purswani M, Engelson ES, Horlick M, Shane E. Effect of bimonthly supplementation with oral cholecalciferol on serum 25-hydroxyvitamin D concentrations in HIV-infected children and adolescents. Pediatrics. 2009;123:e121–126. doi: 10.1542/peds.2008-0176. [DOI] [PMC free article] [PubMed] [Google Scholar]
- 50.Kakalia S, Sochett EB, Stephens D, Assor E, Read SE, Bitnun A. Vitamin D Supplementation and CD4 Count in Children Infected with Human Immunodeficiency Virus. J Pediatr. 2011 doi: 10.1016/j.jpeds.2011.06.010. [DOI] [PubMed] [Google Scholar]
- 51.Del Bino S, Sok J, Bessac E, Bernerd F. Relationship between skin response to ultraviolet exposure and skin color type. Pigment Cell Res. 2006;19:606–614. doi: 10.1111/j.1600-0749.2006.00338.x. [DOI] [PubMed] [Google Scholar]