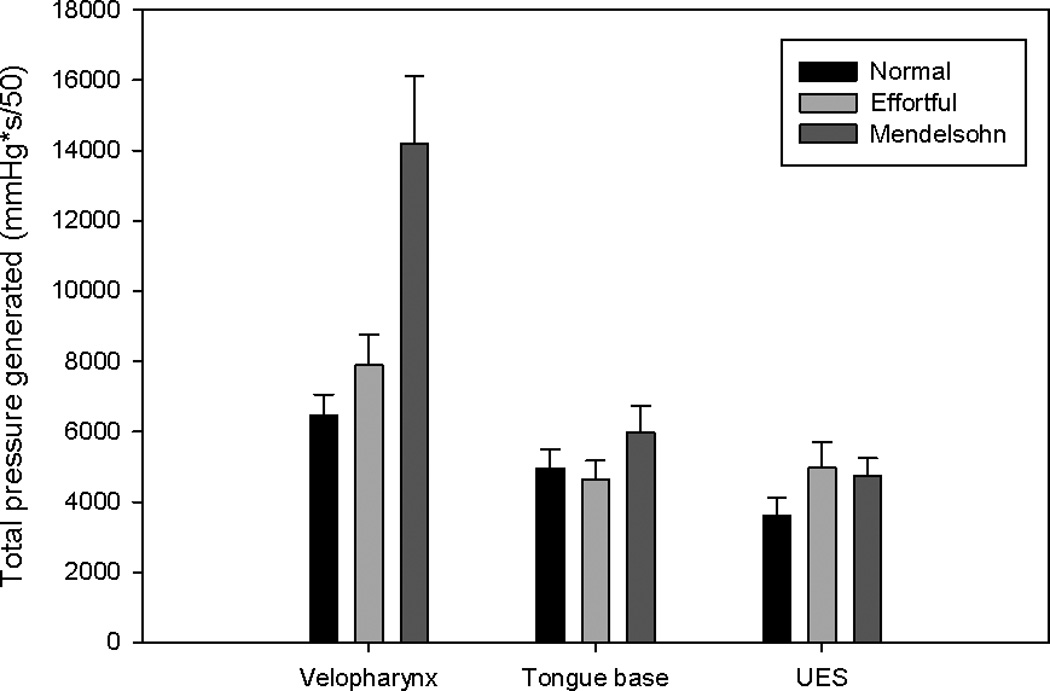
Figure 5.

Bar charts displaying area integrals (total pressure generated) in the areas of interest. Error bars represent standard error of the mean. Total pressure generated in the velopharynx and upper esophageal sphincter (UES) increased for both maneuvers.
