

Abstract
Research Objectives
This study aims to determine the most reliable method for infant hippocampal segmentation by comparing magnetic resonance (MR) imaging post-acquisition processing techniques: contrast to noise ratio (CNR) enhancement, or reformatting to standard orientation.
Methods
MR scans were performed with a 1.5T GE scanner to obtain dual echo T2 and proton density (PD) images at term equivalent (38-42 weeks' gestational age). 15 hippocampi were manually traced four times on ten infant images by 2 independent raters on the original T2 image, as well as images processed by: a) combining T2 and PD images (T2-PD) to enhance CNR; then b) reformatting T2-PD images perpendicular to the long axis of the left hippocampus. CNRs and intraclass correlation coefficients (ICC) were calculated.
Results
T2-PD images had 17% higher CNR (15.2) than T2 images (12.6). Original T2 volumes' ICC was 0.87 for rater 1 and 0.84 for rater 2, whereas T2-PD images' ICC was 0.95 for rater 1 and 0.87 for rater 2. Reliability of hippocampal segmentation on T2-PD images was not improved by reformatting images (rater 1 ICC= 0.88, rater 2 ICC= 0.66).
Significance
Post-acquisition processing can improve CNR and hence reliability of hippocampal segmentation in neonate MR scans when tissue contrast is poor. These findings may be applied to enhance boundary definition in infant segmentation for various brain structures or in any volumetric study where image contrast is sub-optimal, enabling hippocampal structure-function relationships to be explored.
Keywords: neonate, preterm, magnetic resonance imaging, volume, hippocampus, brain
Introduction
Magnetic resonance (MR) derived segmentation is a safe, non-invasive and sensitive way to define cerebral structures such as the hippocampus (Naidich et al. 1987). Hippocampal size and shape measures are important in characterizing and following the progression of many diseases such as Alzheimer's disease (Schuff et al. 2009), temporal lobe epilepsy (Wu et al. 2005), developmental disorders such as autism (Saitoh et al. 2001) and attention deficit hyperactivity disorder (Abernethy et al. 2002), as well as neuropsychiatric disorders such as schizophrenia, bipolar disorder and depression (Geuze et al. 2005b). Furthermore, hippocampal integrity is important in premature populations. Studies assessing hippocampal volumes in infants are few (Thompson et al. 2009; Thompson et al. 2008; Lodygensky et al. 2008), with the majority of groups examining older children and adolescents (Abernethy et al. 2004; Lodygensky et al. 2005; Peterson et al. 2000). Techniques for tracing hippocampal volumes have been well defined in adults (Jeukens et al. 2009; Watson et al. 1992; Jack et al. 1990; Konrad et al. 2009), but until now there has been no literature examining the most effective and reliable method for optimal definition of the hippocampus in the infant brain. Infant brains are not yet fully myelinated and the water content is similar in gray matter (GM) and white matter (WM) relative to older pediatric cohorts and adult populations (Williams et al. 2007). Therefore infant GM/WM tissue contrast is poor, making hippocampal boundary definition somewhat difficult. Hippocampal size and shape measures are reliant on reproducible and anatomically accurate definition of boundaries.
Within the adult literature, many factors have been shown to affect the reliability of hippocampal measurements apart from anatomical boundary definition, including: image acquisition; slice thickness; imaging artifact; head tilt and image orientation; image processing software; and correction for variation in head size (Jack et al. 1995; Geuze et al. 2005a; Klauschen et al. 2009). Some researchers have recommended correcting for head tilt in hippocampal segmentation (Pantel et al. 2000), while others did not find a significant benefit (Hasboun et al. 1996). Few have addressed the issue of image contrast, which is especially important in the unmyelinated infant brain. One group has shown that T2 images provide better tissue contrast than T1 images in infants (Williams et al. 2005). Therefore T2 images are more useful for hippocampal segmentation in the infant brain. Algebraic manipulation of dual-echo MR images by summing the proton density (PD) and T2 images has been shown to be the most reliable method to estimate sub-cortical caudate and thalamus volumes (Bridle et al. 2002), however the benefits of this technique have not been previously assessed for infant hippocampal segmentation.
The aim of this study was to compare 3D MR image processing techniques to determine the most reliable and consistent method for obtaining hippocampal volumes in term and preterm infants at term equivalent. We investigated the effects of post-acquisition processing including contrast to noise ratio (CNR) enhancement, and reformatting of images to a common orientation. We hypothesized that CNR enhancement would improve hippocampal segmentation.
Methods
Fifteen subjects (4 full term and 11 very preterm) were randomly selected from a larger cohort of very preterm (birthweight < 1250 g and/or gestational age < 30 weeks) and full-term infants, recruited between July 2001 and December 2003 as part of a prospective observational cohort study examining the effects of prematurity on brain development, as previously described (Thompson et al. 2008).
T1, T2 and PD scans were obtained with a 1.5 Tesla General Electric Signa MRI scanner (General Electric, Milwaukee, WI) at term equivalent (38 - 42 weeks' corrected gestational age). Whole brain images were acquired with MR imaging, including T1 spoiled gradient recalled sequences (1.2mm coronal slices; repetition time 35 msec; echo time 9msec; flip angle 45°; field of view 210 × 158 mm; matrix 256 × 192; scan time ∼12 min), T2 and PD weighted dual echo fast recovery fast spin echo sequences with interleaved acquisition (1.7 mm coronal slices (∼80 slices); repetition time 4000 msec; echo time 60/160 msec; echo train length 16; flip angle 90°; field of view 180 × 135 mm; matrix 256 × 224, interpolated 512 × 512; image pixel size 0.35 × 0.35 mm; scan time ∼15 minutes). Post-acquisition visualization and processing of MR images was achieved using Sun Microsystems workstations (Sun Microsystems, Inc., Palo Alto, CA).
The hippocampus of each hemisphere of the 15 images was manually segmented twice using ‘3D slicer’ software version 2.6 (http://www.slicer.org/). T1 weighted images were not utilized, considering the GM/WM contrast was not sufficient to clearly distinguish the hippocampus (Fig. 1a). Rather, T2 weighted images were segmented, including the original T2 image (Fig. 1b) and 2 images that were post-processed using ‘3D slicer’, as follows:
Fig. 1.
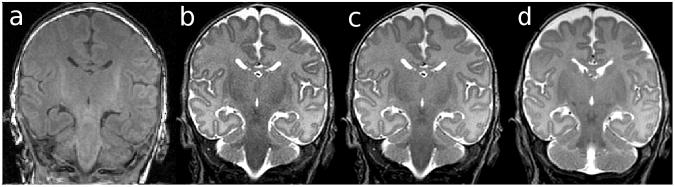
(a) T1 weighted image, (b) T2 image, (c) T2-PD image, revealing better contrast to noise ratio compared with the T2 image, (d) T2-PD┴ image.
Fig. 2.
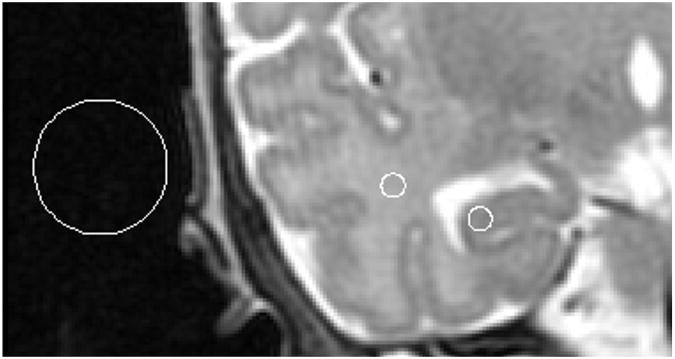
An example of regions of interest from which signal intensities were obtained in order to calculate signal to noise and contrast to noise ratios between hippocampal GM and temporal white matter, overlaid on a T2-PD image.
T2-PD: The raw T2 and PD image volumes were combined by simple image addition in order to determine whether hippocampal boundaries could be identified more reliably with improved CNR. These images were dually acquired within the same imaging series, and therefore registration was not required for this volume addition (Fig. 1c).
T2-PD┴: In order to correct for head tilt differences between subjects, T2-PD infant brain images were reoriented perpendicular to the long axis of the left hippocampus. The axial plane was manipulated by manual linear rotation and translation in order to orient along the top of the fimbria as visualized in the sagittal view (Fig. 1d).
Contrast-to-noise ratios (CNR) were calculated for 10 randomly chosen subjects for T2, PD, and T2-PD images (Fig. 2). CNR was measured using mean signal intensities within regions of interest (ROIs) placed on the coronal slice in both the GM of the CA1 region of the hippocampal head, and a region of homogeneous WM within the temporal lobe (Fig. 2). Furthermore, the standard deviation of the background signal intensity within regions of interest placed outside the skull were measured in order to determine signal to noise ratios of the GM and WM (Fig. 2). Within each subject, signal measurements were taken from the three ROIs overlaid on the PD, T2 or T2-PD image. MRIcro software was used to create ROIs and to measure signal intensities (http://www.cabiatl.com/mricro/). SNR was calculated for both GM and WM according to Eq. (1):
| [1] |
Where μROI = mean signal intensity within the WM or GM region of interest; σBkG= standard deviation of the signal intensity within the background region.
CNR was calculated as the difference between the SNR of the GM and WM according to Eq. (2):
| [2] |
Where SNRWM= signal to noise ratio for the WM; SNRGM= signal to noise ratio for the GM.
Two independent raters manually outlined the 15 subjects' hippocampi on the coronal view, with reference to anatomical atlases (Mai et al. 1997; Duvernoy 1988). Repeat segmentations were performed at least 1 week apart. Once the posterior boundary was defined, the in-plane boundaries were traced sequentially on each slice until the anterior boundary was reached (Fig. 3). Tracing of each slice of the hippocampus proceeded from the medial edge to the inferior, then the lateral aspect, and finally to the superior edge of the hippocampus. In general, the approach of Watson et al. was used to define hippocampal boundaries (Watson et al. 1992):
Fig. 3.

(a) Slice by slice illustration of the boundaries of the hippocampi from the posterior (top left) tail, to body, and finally anterior head (bottom right) of a preterm infant scan on the T2-PD coronal volume. (b) Three dimensional representation of the hippocampal volume.
Hippocampal tail
The posterior border of the hippocampus was defined as the most anterior slice where the fornix was seen in its entirety. This slice is directly posterior to the slice where the pulvinar nucleus fuses with the fornix. The medial boundary was defined as the narrowest part of the mouth of the hippocampal sulcus. The inferior boundary was the WM at the parahippocampal gyrus, and the lateral boundary, the cerebrospinal fluid (CSF) of the temporal horn of the lateral ventricle. CSF also formed the superior border. The fimbria was included, as was subiculum and alveus. The parahippocampal gyrus was excluded.
Hippocampal body
The body was defined laterally and superiorly by the CSF of the temporal horn of the lateral ventricle. If the CSF was not easily visible superiorly, the superior edge of the WM of the alveus and fimbria served as the superior border. The inferior border was the boundary of the gray and WM of the hippocampus and entorhinal cortex. The medial edge was defined as the mouth of the hippocampal sulcus, until the uncus appeared more anteriorly. The uncus was included once it appeared fused to the hippocampal body, then the uncal sulcus became the new medial border. Tracing of the hippocampal body proceeded up to, and included, the digitations of the hippocampus. Included in the measurement of the hippocampal body were the subicular complex, hippocampus proper, dentate gyrus, alveus and fimbria.
Hippocampal head
The medial border of the hippocampal head was defined as the inferior edge or ‘hook’ of the uncal notch. Further anteriorly, the medial edge became the most medial point of the temporal lobe. The inferior line followed the GM/WM boundary between the entorhinal cortex and the subiculum. The CSF of the temporal horn of the lateral ventricle provided the lateral border, and in general, the line of the hippocampus was defined superiorly by following the path of the top of the temporal horn of the lateral ventricle, where a line of intermingling CSF and WM was sometimes evident, separating the hippocampus from the amygdala. The final slice was defined as the most anterior slice where the temporal horn of the lateral ventricle was still seen laterally to the hippocampus.
Statistical analyses were performed using SPSS version 15.0 (Chicago, IL). To test differences in CNR between T2 and T2-PD images, a paired-samples T-test was used. To compare intra-rater reliabilities of the different processing techniques, intraclass correlation coefficients (ICC) were calculated using a 2-way mixed model, with absolute agreement for single measures. Inter-rater reliability ICCs were calculated using 2-way mixed models with consistency for single measures. ICCs were calculated between the two measurements (original and repeat) for left and right hippocampi separately, and with both left and right sides included in the analysis. In order to test consistency in hippocampal volume measured using the different techniques, an overall ICC between segmentation techniques for each rater was calculated for hippocampal volumes. Repeated measures ANOVAs were conducted to test for any differences in hippocampal volume (left and right combined) according to the different segmentation techniques. The within subject factor was ‘segmentation technique’ with 3 within-subject variables: hippocampal volumes obtained from T2, T2-PD, or T2-PD┴ images. Sphericity was tested using Mauchly's test and post-hoc tests were performed with Bonferroni adjusted pair-wise comparisons to compare estimated marginal means between segmentation techniques.
Results
T2-PD images had the highest mean SNR in both the GM (56.0) and WM (71.2) (Table 1). The T2-PD images showed a statistically significant 17.1% improvement in average CNR (15.2) compared with the T2 images (12.6) (Table 1, Fig. 1a, b).
Table 1.
Signal to noise ratio (SNR) and contrast to noise ratio (CNR) measurements for hippocampal gray matter (GM) and temporal lobe white matter (WM) within the T2 and T2-PD magnetic resonance (MR) images.
| MR image | SNR | CNR | CNR difference (95% confidence interval) | |
|---|---|---|---|---|
| GM | WM | |||
| T2 | 31.6 | 44.2 | 12.6 | 2.6 (1.7, 3.6), p<0.0005 |
| T2-PD | 56 | 71.2 | 15.2 | |
Improved CNR through combining the T2 and PD images resulted in more reliable segmentations than the original T2 image. This was demonstrated by higher intra-rater ICCs on T2-PD than T2 images for both raters as well as higher inter-rater ICCs (Table 2). Having ascertained that the T2-PD image had better CNR and reproducibility measures, reformatting was undertaken on the T2-PD image. Reformatting the images perpendicular to the long axis of the hippocampus did not improve segmentation reliability over and above that of non-reformatted scans, i.e. the T2-PD┴ intra- and inter-rater ICCs were smaller than those of the T2-PD (Table 2). These trends were true when original and repeat segmentations were correlated for all hippocampi (both left and right included in the ICC analysis), and also when ICC analysis was performed separately for right and left hippocampal volumes (Table 2). All intraclass correlations were highly significant (Table 2).
Table 2.
Mean of hippocampal volume measurements (left and right segmented twice each) for 15 subjects, as well as intra-rater and inter-rater intraclass correlation coefficients (ICC) between the original and repeat hippocampal segmentations for each technique.
| Rater | Mean (SD), cm3 | Right (original & repeat) | Left (original & repeat) | Right & Left (original & repeat) | ||||||
|---|---|---|---|---|---|---|---|---|---|---|
| Intra-rater ICC (95% CI) | Inter-rater ICC (95% CI) | Mean (SD), cm3 | Intra-rater ICC (95% CI) | Inter-rater ICC (95% CI) | Mean (SD), cm3 | Intra-rater ICC (95% CI) | Inter-rater ICC (95% CI) | |||
| T2 | 1 | 1.12 (0.17) | 0.88 (0.69, 0.96), <0.0005 | 0.66 (0.43, 0.85), p<0.0005 | 1.09 (0.17) | 0.86 (0.63, 0.95), <0.0005 | 0.79 (0.61, 0.91), p<0.0005 | 1.10 (0.17) | 0.87 (0.75, 0.95), <0.0005 | 0.74 (0.57, 0.88), p<0.0005 |
| 2 | 0.74 (0.08) | 0.90 (0.75, 0.97), <0.0005 | 0.70 (0.10) | 0.93 (0.82, 0.98), <0.0005 | 0.72 (0.09) | 0.84 (0.68, 0.93), <0.0005 | ||||
| T2-PD | 1 | 1.12 (0.17) | 0.98 (0.93, 0.99), <0.0005 | 0.77 (0.58, 0.90), p<0.0005 | 1.17 (0.18) | 0.95 (0.84, 0.99), <0.0005 | 0.85 (0.70, 0.94), p<0.0005 | 1.11 (0.17) | 0.95 (0.89, 0.99), <0.0005 | 0.82 (0.68, 0.92), p<0.0005 |
| 2 | 0.75 (0.10) | 0.91 (0.70, 0.97), <0.0005 | 0.72 (0.11) | 0.95 (0.77, 0.98), <0.0005 | 0.73 (0.10) | 0.87 (0.72, 0.95), <0.0005 | ||||
| T2-PD┴ | 1 | 1.18 (0.18) | 0.86 (0.52, 0.97), <0.0005 | 0.61 (0.36, 0.82), p<0.0005 | 1.27 (0.16) | 0.89 (0.62, 0.97), <0.0005 | 0.65 (0.57, 0.88), p<0.0005 | 1.20 (0.17) | 0.85 (0.67, 0.95), <0.0005 | 0.62 (0.43, 0.82), p<0.0005 |
| 2 | 0.76 (0.09) | 0.85 (0.63, 0.95), <0.0005 | 0.71 (0.09) | 0.82 (0.44, 0.93), <0.0005 | 0.73 (0.09) | 0.66 (0.39, 0.86), <0.0005 | ||||
Mean hippocampal volumes were generally estimated to be largest on T2-PD┴ Images. Hippocampi measured on T2-PD images were only slightly smaller than those measured on T2 images (Table 2). Repeated measures ANOVA revealed a significant difference in hippocampal volumes between the different segmentation techniques utilized for rater 1 only (F1.85, 109 = 42.43, p < 0.0005). Mauchly's test indicated that the assumption of sphericity had been violated [χ2(2) = 6.85, p = 0.03], therefore degrees of freedom were corrected using the Huynh-Feldt estimates of sphericity (ε = 0.93). Post-hoc analyses indicated that the mean volume for the T2-PD┴ technique was significantly larger than T2 [mean difference 0.09 cm3 (95% confidence interval 0.06, 0.12), p < 0.0005] and T2-PD [mean difference 0.09 cm3 (95% confidence interval 0.06, 0.11), p < 0.0005]. There were no significant hippocampal volume differences between the segmentation techniques for rater 2 (F1.79, 105 = 1.89, p = 0.16). In this case, Mauchly's test also indicated violation of the assumption of sphericity [χ2(2) = 9.29, p = 0.01], and so the Huynh-Feldt correction was applied (ε = 0.90).
Discussion
Post-acquisition processing was applied to 15 infants in order to test optimization and reproducibility of manual hippocampal volumetric estimates. Combining the T2 and PD image volumes improved CNR and visualization of the infant hippocampus, with GM and WM boundaries more clearly visible than on the T2 images. This led to superior reliability for volume measurements. There was no advantage to reformatting images perpendicular to the long axis of the hippocampus to control for head tilt.
It is well known that tissue contrast should be optimized for image acquisition, in order to improve hippocampal volumetric measurements (Wieshmann et al. 1998). A study by Conklin et al. optimized a magnetization prepared rapid gradient echo (MP-RAGE) sequence by combining both T1 and T2- weighting into the contrast preparation and utilizing elliptical-spiral phase encoding in order to increase CNR between GM and WM in infant brain images (Conklin et al. 2008). However, the issue of post-acquisition contrast enhancement has been largely neglected. The use of multi-spectral data to better characterize MR tissue signatures was first introduced by Vannier et al. (Vannier et al. 1985). Later, Lim and Pfefferbaum reported the value of combining T2 and PD images to improve gray and WM contrast (Lim and Pfefferbaum 1989). Since, this approach has been used in thalamic and caudate volume measurements (Bridle et al. 2002), and the T2-PD technique has been used to analyze the hippocampi of a large cohort of term and preterm infants (Thompson et al. 2009; Thompson et al. 2008). The current study has shown the combination of the T2-PD images to be a beneficial post-acquisition processing technique for improved reproducibility in infant segmentation, which was most likely due to improved CNR. Further research may elucidate whether a weighted combination of the T2 and PD images may provide even better CNR for infant segmentations.
Pantel et al. suggested that differences in head position between subjects may affect volume measurements, especially for very small structures such as the pediatric hippocampus, and that differences in head position should be corrected (Pantel et al. 2000). Another group showed that scans reformatted to control for head position resulted in more reliable volume measures (Bartzokis et al. 1998). For the purposes of the current study, reorienting the images to correct for head tilt was not advantageous. Reformatting images perpendicular to the long axis of the hippocampus resulted in degradation of the image quality through interpolation and partial volume error. However, these results were somewhat expected considering rotation of images with highly anisotropic voxels are likely to produce inaccurate results, especially considering the large slice thickness (1.7mm) relative so such a small structure as the hippocampus. On the other hand, if images were acquired in a standard position without the need for reformatting, or acquired with cubic voxels and reformatted with little degradation of the image (Patwardhan et al. 2001), it may be possible to obtain a more reliable volume.
The T2-PD┴ images produced the largest hippocampal volumes, at least for rater 1. This supports the finding by Hasbourn et al. that hippocampal volumes were significantly larger when images had been reformatted (Hasboun et al. 1996). This may be due to partial volume artifact, or alternatively it may suggest that reformatting perpendicular to the hippocampus may be a more accurate way to obtain the entire hippocampal volume, enabling extra slices of the hippocampus to be included at the posterior and anterior boundaries. These larger volumes are more consistent with those reported for postmortem infant brains (Bartzokis et al. 1998). However, considering this technique resulted in less reproducible hippocampal segmentations for this infant cohort, we had to conclude that there was no benefit to reorientation.
The best method of representatively and reproducibly tracing the hippocampi is a contentious issue in volumetric research. Fresh autopsy hippocampi measured from term infants are on average 1.5 cm3, about 0.3 cm3 larger than our estimate (Kretschmann et al. 1986). This suggests that our hippocampal volumes are likely an underestimate of the true volume. A partial explanation may be the segmentation protocol, which has been estimated to exclude 5-10% of the hippocampus (Obenaus et al. 2001). A few groups have addressed the issue of representative and reproducible hippocampal segmentation by defining novel segmentation methods to include the whole hippocampus in the measurement (Obenaus et al. 2001; Malykhin et al. 2007). A possible area of future research would be to explore automated methods of reliably and meaningfully segmenting the hippocampus, as it would allow a more objective interpretation. In adults, automatic hippocampal segmentation has been shown to be as sensitive as manual segmentation for detecting hippocampal differences (Bergouignan et al. 2009). However, the infant hippocampus is small and poorly defined, making automated segmentation difficult (Obenaus et al. 2001).
There were several limitations to this study. Since the images for this study were acquired, improvements have been made to head coils and acquisition parameters, and imaging at higher resolution and higher field strengths is now possible. Inter-rater agreement was sub-optimal, and rater 2 consistently obtained smaller hippocampal volumes than rater 1. However, this did not affect the conclusions of this study, where intra- and inter-rater reliability was highest for the contrast-enhanced T2-PD image for both raters, and indeed inter-rater reliability reached the acceptable level of around 0.8 only for T2-PD image segmentations. It was impossible for the operators to be truly blinded to which post-acquisition technique was used considering the reformatted images were somewhat obvious. Furthermore, reorientation was performed in an interactive and observational manner, thus there may have been variability in the orientation of the hippocampus between subjects. It would be desirable to compare different image contrasts and head positioning by using repeat scans with different acquisition parameters. Ideally, calibration or phantom measurements should be performed using more than one MRI scanner. However, in many clinical settings pre-acquisition optimization of the scanning protocol is not practical, and therefore the purpose and usefulness of this study is to show that post-acquisition optimization of images can improve reliability of MR-derived measures for research purposes.
In conclusion, combining T2 and PD images improved CNR and reproducibility of the infant hippocampal segmentation. We suggest that first and foremost, MR image acquisition parameters for infants should be carefully chosen in order to optimize tissue contrast, which is inherently poor in the unmyelinated brain. However, post-acquisition CNR enhancement may also be useful to improve the reliability of segmented infant brain structures. Furthermore, other volumetric studies afflicted with sub-optimal image contrast may benefit from similar post-acquisition contrast enhancement as applied in the current study. Successful hippocampal segmentation will enable determination of the mechanisms and functional consequences for hippocampal alterations.
Acknowledgments
The authors gratefully thank Merilyn Bear, Michael Kean, Katherine Lee, Gregory A. Lodygensky, Hong X. Wang, Michael J.Farrell, Peter J. Anderson, and Rodney W. Hunt, the VIBeS and Developmental Imaging teams at the Murdoch Childrens Research Institute, as well as the families and infants who participated in this study.
Grant sponsors: National Medical and Health Research Council of Australia; Grant number: 237117; Grant sponsor: NIH; Grant number: R01 RR021885, R01 GM074068, R01 EB008015, P30 HD018655; Grant sponsor: NHMRC Research Fellowship; Grant number: 400317; Grant sponsors: United Cerebral Palsy Foundation (USA), Mather Foundation (USA), Brown Foundation (USA), NHMRC Clinical Career Development Award, NARSAD Young Investigator Award, Victorian Government's Operational Infrastructure Support Program.
Footnotes
Information Sharing Statement: The ‘3D slicer’ software used to trace the hippocampi (http://www.slicer.org/), and ‘MRIcro’ software used to measure signal intensities for contrast to noise ratios (http://www.cabiatl.com/mricro/) are both freely available for download.
References
- Abernethy LJ, Cooke RWI, Foulder-Hughes L. Caudate and hippocampal volumes, intelligence, and motor impairment in 7-year-old children who were born preterm. Pediatr Res. 2004;55(5):884–893. doi: 10.1203/01.PDR.0000117843.21534.49. [DOI] [PubMed] [Google Scholar]
- Abernethy LJ, Palaniappan M, Cooke RW. Quantitative magnetic resonance imaging of the brain in survivors of very low birth weight. Arch Dis Child. 2002;87(4):279–283. doi: 10.1136/adc.87.4.279. [DOI] [PMC free article] [PubMed] [Google Scholar]
- Bartzokis G, Altshuler LL, Greider T, Curran J, Keen B, Dixon WJ. Reliability of medial temporal lobe volume measurements using reformatted 3D images. Psychiatry Res. 1998;82(1):11–24. doi: 10.1016/s0925-4927(98)00007-9. [DOI] [PubMed] [Google Scholar]
- Bergouignan L, Chupin M, Czechowska Y, Kinkingnehun S, Lemogne C, Le Bastard G, Lepage M, Garnero L, Colliot O, Fossati P. Can voxel based morphometry, manual segmentation and automated segmentation equally detect hippocampal volume differences in acute depression? Neuroimage. 2009;45(1):29–37. doi: 10.1016/j.neuroimage.2008.11.006. [DOI] [PubMed] [Google Scholar]
- Bridle N, Pantelis C, Wood SJ, Coppola R, Velakoulis D, McStephen M, Tierney P, Le TL, Torrey EF, Weinberger D. Thalamic and caudate volumes in monozygotic twins discordant for schizophrenia. Aust NZ J Psychiatry. 2002;36(3):347–354. doi: 10.1046/j.1440-1614.2001.01022.x. [DOI] [PubMed] [Google Scholar]
- Conklin J, Winter JD, Thompson RT, Gelman N. High-contrast 3D neonatal brain imaging with combined T1- and T2-weighted MP-RAGE. Magn Reson Med. 2008;59(5):1190–1196. doi: 10.1002/mrm.21548. [DOI] [PubMed] [Google Scholar]
- Duvernoy HM. The human Hippocampus An atlas of applied anatomy. J.F Bergmann Verlag; Munchen: 1988. [Google Scholar]
- Geuze E, Vermetten E, Bremner JD. MR-based in vivo hippocampal volumetrics: 1. Review of methodologies currently employed. Mol Psychiatry. 2005a;10(2):147–159. doi: 10.1038/sj.mp.4001580. [DOI] [PubMed] [Google Scholar]
- Geuze E, Vermetten E, Bremner JD. MR-based in vivo hippocampal volumetrics: 2. Findings in neuropsychiatric disorders. Mol Psychiatry. 2005b;10(2):160–184. doi: 10.1038/sj.mp.4001579. [DOI] [PubMed] [Google Scholar]
- Hasboun D, Chantome M, Zouaoui A, Sahel M, Deladoeuille M, Sourour N, Duyme M, Baulac M, Marsault C, Dormont D. MR determination of hippocampal volume: Comparison of three methods. Am J Neuroradiol. 1996;17(6):1091–1098. [PMC free article] [PubMed] [Google Scholar]
- Jack C, Jr, Bentley M, Twomey C, Zinsmeister A. MR imaging-based volume measurements of the hippocampal formation and anterior temporal lobe: validation studies. Radiology. 1990;176(1):205–209. doi: 10.1148/radiology.176.1.2353093. [DOI] [PubMed] [Google Scholar]
- Jack CR, Jr, Theodore WH, Cook M, McCarthy G. MRI-based hippocampal volumetrics: data acquisition, normal ranges, and optimal protocol. Magn Reson Imaging. 1995;13(8):1057–1064. doi: 10.1016/0730-725x(95)02013-j. [DOI] [PubMed] [Google Scholar]
- Jeukens CR, Vlooswijk MC, Majoie HJ, de Krom MC, Aldenkamp AP, Hofman PA, Jansen JF, Backes WH. Hippocampal MRI volumetry at 3 Tesla: reliability and practical guidance. Invest Radiol. 2009;44(9):509–517. doi: 10.1097/RLI.0b013e3181b4c180. [DOI] [PubMed] [Google Scholar]
- Klauschen F, Goldman A, Barra V, Meyer-Lindenberg A, Lundervold A. Evaluation of automated brain MR image segmentation and volumetry methods. Hum Brain Mapp. 2009;30(4):1310–1327. doi: 10.1002/hbm.20599. [DOI] [PMC free article] [PubMed] [Google Scholar]
- Konrad C, Ukas T, Nebel C, Arolt V, Toga AW, Narr KL. Defining the human hippocampus in cerebral magnetic resonance images--an overview of current segmentation protocols. Neuroimage. 2009;47(4):1185–1195. doi: 10.1016/j.neuroimage.2009.05.019. [DOI] [PMC free article] [PubMed] [Google Scholar]
- Kretschmann HJ, Kammradt G, Krauthausen I, Sauer B, Wingert F. Growth of the hippocampal formation in man. Bibl Anat. 1986;(28):27–52. [PubMed] [Google Scholar]
- Lim KO, Pfefferbaum A. Segmentation of MR brain images into cerebrospinal fluid spaces, white and grey matter. Journal of Computer Assisted Tomography. 1989;13:588–593. doi: 10.1097/00004728-198907000-00006. [DOI] [PubMed] [Google Scholar]
- Lodygensky GA, Rademaker K, Zimine S, Gex-Fabry M, Lieftink AF, Lazeyras F, Groenendaal F, de Vries LS, Huppi PS. Structural and functional brain development after hydrocortisone treatment for neonatal chronic lung disease. Pediatrics. 2005;116(1):1–7. doi: 10.1542/peds.2004-1275. [DOI] [PubMed] [Google Scholar]
- Lodygensky GA, Seghier ML, Warfield SK, Tolsa CB, Sizonenko S, Lazeyras F, Huppi PS. Intrauterine growth restriction affects the preterm infant's hippocampus. Pediatr Res. 2008;63(4):438–443. doi: 10.1203/PDR.0b013e318165c005. [DOI] [PubMed] [Google Scholar]
- Mai JK, Assheuer J, Paxinos G. Atlas of the human brain. Academic Press; San Diego: 1997. [Google Scholar]
- Malykhin NV, Bouchard TP, Ogilvie CJ, Coupland NJ, Seres P, Camicioli R. Three-dimensional volumetric analysis and reconstruction of amygdala and hippocampal head, body and tail. Psychiatry Research. 2007;155(2):155–165. doi: 10.1016/j.pscychresns.2006.11.011. [DOI] [PubMed] [Google Scholar]
- Naidich TP, Daniels DL, Haughton VM, Williams A, Pojunas K, Palacios E. Hippocampal formation and related structures of the limbic lobe: anatomic-MR correlation. Part I. Surface features and coronal sections. Radiology. 1987;162(3):747–754. doi: 10.1148/radiology.162.3.3809489. [DOI] [PubMed] [Google Scholar]
- Obenaus A, Yong-Hing CJ, Tong KA, Sarty GE. A reliable method for measurement and normalization of pediatric hippocampal volumes. Pediatric Research. 2001;50(1):124–132. doi: 10.1203/00006450-200107000-00022. [DOI] [PubMed] [Google Scholar]
- Pantel J, O'Leary DS, Cretsinger K, Bockholt HJ, Keefe H, Magnotta VA, Andreasen NC. A new method for the in vivo volumetric measurement of the human hippocampus with high neuroanatomical accuracy. Hippocampus. 2000;10(6):752–758. doi: 10.1002/1098-1063(2000)10:6<752::AID-HIPO1012>3.0.CO;2-Y. [DOI] [PubMed] [Google Scholar]
- Patwardhan AJ, Eliez S, Warsofsky IS, Glover GH, White CD, Giedd JN, Peterson BS, Rojas DC, Reiss AL. Effects of image orientation on the comparability of pediatric brain volumes using three-dimensional MR data. J Comput Assist Tomogr. 2001;25(3):452–457. doi: 10.1097/00004728-200105000-00020. [DOI] [PubMed] [Google Scholar]
- Peterson BS, Vohr B, Staib LH, Cannistraci CJ, Dolberg A, Schneider KC, Katz KH, Westerveld M, Sparrow S, Anderson AW, Duncan CC, Makuch RW, Gore JC, Ment LR. Regional brain volume abnormalities and long-term cognitive outcome in preterm infants. JAMA. 2000;284(15):1939–1947. doi: 10.1001/jama.284.15.1939. [DOI] [PubMed] [Google Scholar]
- Saitoh O, Karns CM, Courchesne E. Development of the hippocampal formation from 2 to 42 years: MRI evidence of smaller area dentata in autism. Brain. 2001;124(Pt 7):1317–1324. doi: 10.1093/brain/124.7.1317. [DOI] [PubMed] [Google Scholar]
- Schuff N, Woerner N, Boreta L, Kornfield T, Shaw LM, Trojanowski JQ, Thompson PM, Jack CR, Jr, Weiner MW. MRI of hippocampal volume loss in early Alzheimer's disease in relation to ApoE genotype and biomarkers. Brain. 2009;132(Pt 4):1067–1077. doi: 10.1093/brain/awp007. [DOI] [PMC free article] [PubMed] [Google Scholar]
- Thompson DK, Wood SJ, Doyle LW, Warfield SK, Egan GF, Inder TE. MR-determined hippocampal asymmetry in full-term and preterm neonates. Hippocampus. 2009;19(2):118–123. doi: 10.1002/hipo.20492. [DOI] [PMC free article] [PubMed] [Google Scholar]
- Thompson DK, Wood SJ, Doyle LW, Warfield SK, Lodygensky GA, Anderson PJ, Egan GF, Inder TE. Neonate hippocampal volumes: Prematurity, perinatal predictors, and 2-year outcome. Ann Neurol. 2008;63(5):642–651. doi: 10.1002/ana.21367. [DOI] [PubMed] [Google Scholar]
- Vannier MW, Butterfield RL, Jordan D, Murphy WA, Levitt RG, Gado M. Multispectral analysis of magnetic resonance images. Radiology. 1985;154(1):221–224. doi: 10.1148/radiology.154.1.3964938. [DOI] [PubMed] [Google Scholar]
- Watson C, Andermann F, Gloor P, Jonesgotman M, Peters T, Evans A, Olivier A, Melanson D, Leroux G. Anatomic Basis of Amygdaloid and Hippocampal Volume Measurement by Magnetic-Resonance-Imaging. Neurology. 1992;42(9):1743–1750. doi: 10.1212/wnl.42.9.1743. [DOI] [PubMed] [Google Scholar]
- Wieshmann UC, Free SL, Stevens JM, Shorvon SD. Image contrast and hippocampal volumetric measurements. Magn Reson Imaging. 1998;16(1):13–17. doi: 10.1016/s0730-725x(97)00220-8. [DOI] [PubMed] [Google Scholar]
- Williams LA, DeVito TJ, Winter JD, Orr TN, Thompson RT, Gelman N. Optimization of 3D MP-RAGE for neonatal brain imaging at 3.0 T. Magn Reson Imaging. 2007;25(8):1162–1170. doi: 10.1016/j.mri.2007.01.119. [DOI] [PubMed] [Google Scholar]
- Williams LA, Gelman N, Picot PA, Lee DS, Ewing JR, Han VK, Thompson RT. Neonatal brain: regional variability of in vivo MR imaging relaxation rates at 3.0 T--initial experience. Radiology. 2005;235(2):595–603. doi: 10.1148/radiol.2352031769. [DOI] [PubMed] [Google Scholar]
- Wu WC, Huang CC, Chung HW, Liou M, Hsueh CJ, Lee CS, Wu ML, Chen CY. Hippocampal alterations in children with temporal lobe epilepsy with or without a history of febrile convulsions: evaluations with MR volumetry and proton MR spectroscopy. Am J Neuroradiol. 2005;26(5):1270–1275. [PMC free article] [PubMed] [Google Scholar]