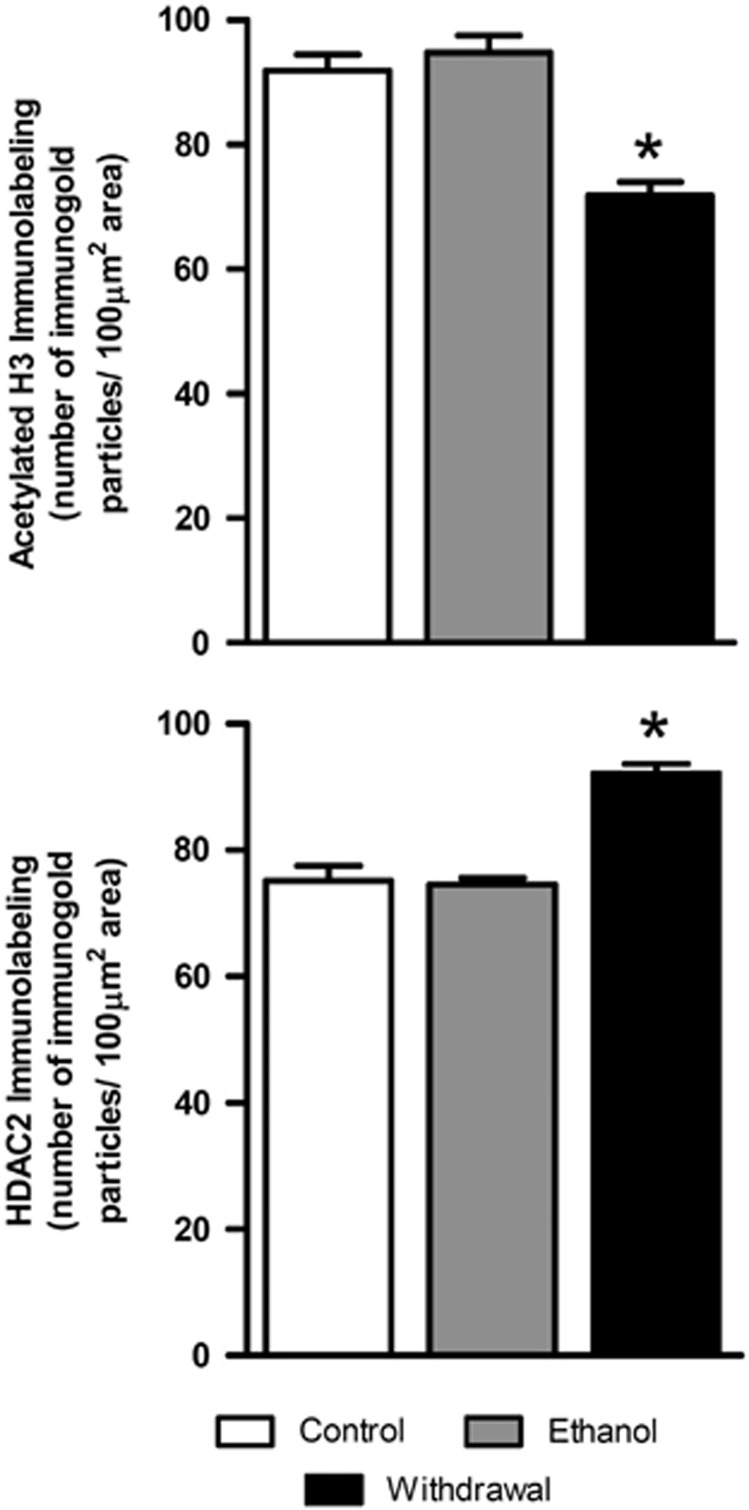
Figure 4.
Bar diagrams showing the differences in the acetylated H3 (H3-K9) and HDAC2 protein levels in the VTA of repeated saline treatment (Control, n=6), repeated ethanol treatment with last ethanol injection 1 h before sacrifice (Ethanol, n=6), and repeated ethanol treatment with last ethanol injection >14 h before sacrifice (Withdrawal, n=6). There was a significant decrease in acetylated H3 (*p<0.001) and a reciprocal increase in the levels of HDAC2 (*p<0.001) in the VTA of mice in withdrawal from ethanol (Withdrawal) compared with that of saline-treated controls (Control) or to ethanol-treated mice that received an ethanol injection 1 h before sacrifice (Ethanol).

