

Abstract
Metastasis suppressors and other regulators of cell motility play an important role in tumor invasion and metastases. We previously identified that activation of the G protein coupled receptor 54 (GPR54) by the metastasis suppressor metastin inhibits cell migration in association with overexpression of Regulator of calcineurin 1 (RCAN1), an endogenous regulator of calcineurin. Calcineurin inhibitors also blocked cell migration in vitro and RCAN1 protein levels were reduced in nodal metastases in thyroid cancer. The purpose of the current study was to determine directly if RCAN1 functions as a motility suppressor in vitro. Several cancer cell lines derived from different cancer types with different motility rates were evaluated for RCAN1 expression levels. Using these systems we determined that reduction of endogenous RCAN1 using siRNA resulted in an increase in cancer cell motility while expression of exogenous RCAN1 reduced cell motility. In one cell line with a high migratory rate, the stability of exogenously expressed RCAN1 protein was reduced and was rescued by treatment with a proteasome inhibitor. Finally, overexpression of RCAN1 was associated with an increase in cell adhesion to collagen IV and reduced calcineurin activity. In summary, we have demonstrated that the expression of exogenous RCAN1 reduces migration and alters adhesion; and that the loss of endogenous RCAN1 leads to an increase in migration in the examined cancer cell lines. These results are consistent with a regulatory role for RCAN1 in cancer cell motility in vitro.
Keywords: Adhesion, Calcineurin, GPR54, KiSS1, Metastases, Metastin, Motility, Thyroid Cancer
Introduction
Cancer metastasis and proliferation at distant sites involves complex interactions between cancer cells and their micro-environment at the primary tumor site, in the circulation, and at distant locations [1, 2]. Several lines of evidence suggest that the biology of cancer cells at distant sites may not mirror those at the primary tumor. Indeed, genetic “signatures” from metastatic lesions from solid tumors that are distinct from primary tumors have been defined [3]. In addition, the timing of metastatic progression and the subsequent progression of tumor cells at metastatic sites may be regulated differently than primary tumors [4]. Because the development and progression of distant metastases are often the defining events determining patient survival, identifying key regulators of metastasis is crucial to the development of treatments for patients with metastases.
Metastasis suppressors represent a group of genes whose loss is associated with a gain of metastatic capacity. While they may also regulate cellular proliferation, these genes do not function to inhibit tumor formation, thus they appear to be distinct from tumor suppressor genes [5]. Approximately 20 potential metastasis suppressor genes have been identified in different human cancers including NM23, CRSP3, TXNIP, RhoGD12, MKK4, KISS-1, SERPINB5, KAI-1, DRG-1, CRMP-1, CD44-s, Cadherin-11, CAD-1, BRMS1 and HP1, although the level of evidence for their metastasis-suppression effect varies. It is believed that a background of genetic instability and tumor transformation may be necessary for the anti-metastatic function to be activated [5].
Metastasis suppressors have been studied in a number of tumor types, including breast cancer, melanoma, colon cancer, thyroid cancer, and others. However, the pathways utilized by metastasis suppressors to exert their function are incompletely defined. One particular metastasis suppressor that has been functionally evaluated is KiSS1. KiSS1 gene products (kisspeptins, or metastin-kisspeptin 1–54) have been identified to be ligands for the G-protein coupled receptor 54 (GPR54) [6–8]. In several cancers, reduced levels of KiSS1 mRNA have been associated with tumor invasion and/or metastases [9–15]. In thyroid cancer, follicular cancers (FTCs) that have the greatest tendency to metastasize hematogenously have been uniquely characterized as having low levels of both KiSS1 and GPR54 mRNA [10]. While the mechanisms by which kisspeptins inhibit migration may involve alternative mechanisms [16], kisspeptin 1–54 (metastin)-mediated inhibition of cancer cell migration in vitro appears to be GPR54 dependent in some cell systems. Inhibition of migration induced by metastin/GPR54 interactions was associated with a persistent increase in expression of RCAN1 (MCIP-1, DSCR1, ADAPT 78, Calcipressin), a critical regulator of calcineurin signaling [17]. Overexpression of RCAN1 was temporally associated reduced calcineurin activity, pharmacological inhibitors of calcineurin reduced cell motility independent of GPR54 in vitro, and RCAN1 expression was not detected in nodal metastases in a small number of thyroid cancer cases [17]. Thus, while the precise mechanisms of KiSS1 metastasis suppressor activity are uncertain, these data suggest that RCAN1 may represent a motility suppressor gene.
RCANs (Regulators of Calcineurin) are endogenous proteins that interact with calcineurin and alter its function by interfering with calcineurin/nuclear factor in activated T-cells (NFAT) binding. This interference reduces the nuclear import of NFAT and its subsequent function as a transcription regulator. The RCANs are encoded by the Down Syndrome Critical Region 1 (DSCR1) gene located on chromosome 21 [18, 19]. There are four expressed RCAN transcripts that vary in the transcriptional start site but have four common terminal exons. Of these transcripts, RCAN1 is the best characterized. Expression of RCAN1 is positively regulated by NFAT, thus RCAN1 functions as a negative feedback regulator of calcineurin/NFAT signaling [19–22] RCAN1 gene expression and protein stability are also regulated by other signaling pathways, particularly the MEK (II), and CREB [23, 24]. The role of RCANs as regulators of PPAR-γ regulated colon cancer cell invasion was recently reported [25], and a more direct role in cell motility has also been described in endothelial cells [26, 27]. The purpose of the present study was to directly test if RCAN1 is a functional regulated of cancer cell motility in vitro.
Materials and methods
Cancer cell lines and stable transfection
Human carcinoma, ARO, WRO, and NPA cell lines were obtained from Dr. Guy J.F. Juillard (UCLA, Los Angeles, CA) and FTC133 (follicular thyroid cancer) was obtained from Dr. Orlo Clark (UCSF, San Francisco, CA). These were previously reported to be of thyroid origin; however, during the course of the studies, their tissue lineage was reported to be non-thyroidal using short tandem repeat (STR) analysis [28, 29]. We therefore performed STR analysis for the cells used in this study to confirm their identities. ARO and WRO cells were found to both be subclones of the HT29 colon cancer cell line; NPA cells were found to be genetically identical to M14 melanoma cells, and FTC133 were a genetically distinct cell line with thyroid-specific gene expression (data not shown) similar to the data reported by Schweppe et al. [28]. The ARO and WRO lines will be termed HT29a and HT29w, respectively, and NPA cells will be termed M14/NPA for the remainder of the manuscript.
HT29a and HT29w cells were grown in RPMI 1640 medium (Invitrogen, Carlsbad, CA) while M14/NPA and FTC133 cells were grown in DMEM (Invitrogen), all supplemented with 10% fetal calf serum (FCS). cDNA of rtTA tetracycline binding protein was excised with its promoter and polyadenylation signal sequence from pREV-Tet-On vector (Promega, Madison WI) and inserted into the multiple cloning site of pcDNA 3.1/zeo(+) (Invitrogen). This vector, HT29a cells were stably transfected with this vector (pcDNA3.1/Zeo (+)-Tet-On) and cells were selected in the presence of 400 μg/ml Zeocin (Invitrogen). Screening for gene expression of the Tet On sequence was performed using qRT-PCR with SYBR-Green. The primers for Tet on sequence were custom made using Primer Express (Applied Biosystems, Inc. Foster City, CA). Screening for rtTA protein expression was performed by transiently transfecting the plasmids pTre-Luc and Renilla SV40 (Promega) and incubating the cells for 24 h with 10 μg/ml of tetracycline (Sigma, St. Louis, MO). Then, the cells were collected, lysed and Luciferase activity was measured using the Dual Luciferase Reporter Assay (Promega). Twenty-four clones were screened and four parental cell lines with different pRev Tet-on levels of expression were then stably transfected with a plasmid containing the pTRE-RCAN1/HA sequence in pcDNA 3.1(+)-hygromycin (original RCAN1 cDNA-containing vector was the generous gift of Dr. B. Rothermel, University of Texas-Southwestern, Dallas, TX). Selection with 400 μg/ml Hygromycin (Invitrogen) was performed. RCAN1/HA inducibility and gene expression was tested by qRT-PCR using a pre-designed RCAN1 sequence (Hs00231766_m1-Applied Biosystems). Protein expression and inducibility for RCAN1 was screened by immunoblotting using an HA antibody (Covance, Princeton, NJ). Forty-eight clones were screened and two clones with different levels of RCAN1 inducibility and low leakiness were selected for functional studies. As negative control, HT29a cells also were stably transfected with the pcDNA3.1 (+) pTRE-RCAN1/HA plasmid alone without rtTA expression as a control line (HT29aWT). Experiments using this control cell line were included in experiments using doxycycline induction to exclude an independent effect of doxycycline on the endpoints being measured.
Luciferase assay
HT29a and M14/NPA cells stably transfected with pcDNA3.1/Zeo(+)-Tet-On were split to 6 well plates and incubated in RPMI 1640 supplemented with 10% Tet free FCS (Clontech, Mountain View, CA) for at least 24 h or when cell confluency of 30% was reached. Co-transfections of pTRE-Luc (firefly) and Renilla SV40 were performed using Lipofectamine Plus Reagent Invitrogen for 6 h. After aspirating the liposome complexes, RPMI 1640 10% Tet free FCS was added for the following 18–20 h. Then, 10 μg/ml of tetracycline and control (Ethanol 0.95%) was dissolved in 5% Tet free FCS RPMI 1640 and added to the cells and incubated at 37°C. After 24 h cells were washed twice with PBS, incubated with the Passive Lysis Buffer from the Dual Luciferase Reporter Assay System kit (Promega) for 20 min at RT. After incubation in Passive Lysis Buffer, cells were collected and centrifuged for 10 min at 12,000g at 4°C. Supernatants were collected and aliquoted for testing. 20 μl of each sample was added into a 96 well plate and 100 μl of the Luciferase Assay Substrate Reagent II (Dual Luciferase Reporter Assay System kit, Promega) was added to each sample. Relative Light Units (RLU) for firefly activity were measured (for 10 s) using a luminometer. After measuring firefly luciferase activity, 100 μl of the Stop and Glo reagent (Dual Luciferase Reporter Assay System kit, Promega) was added to each sample and Renilla luciferase activity was measured. Firefly activity was normalized to Renilla activity and rtTA expression was the result of the tetracycline over vehicle control ratios.
Cell culture
Cells were plated in 10 cm dishes and grown with RPMI 1640 medium containing 10% Tet free FCS (Clontech). Cells were grown to 20% confluency and the media was then switched to either 0.2 or 5% Tet Free FCS containing 1 μg/ml water soluble Doxycycline (Sigma) or distilled water as control. Functional studies were then performed at different time points and RCAN1/HA inducibility was confirmed by Western blotting.
Transient transfections
FTC133 cells were grown to 30% confluency and transiently transfected with a pcDNA 3.1(+) plasmid containing the RCAN1/HA cDNA sequence using Lipofectamine Plus (Invitrogen). After 4 h incubations, the liposomes were aspirated and DMEM supplemented with 10% FCS (Invitrogen) was added to the cells for 24 h before performing any functional study. RCAN1 expression was confirmed by immunoblotting for HA (Covance).
siRNA transfections
HT29a and HT29w cells were grown to 30% confluency and transfected with scrambled (cat. D-001206-13-20 Dharmacon, Lafayette, CO) and RCAN1 (cat. 004268 Dharmacon) siRNAs using Lipofectamine 2000 (Invitrogen). The cells were incubated with the Liposomes complexes alone for 8 h, and RPMI 1640 containing 10% FCS was added for 16 h more. Then, medium and liposomes were all aspirated and fresh RPMI 1640 10% FCS was added for the next 24–48 h. Functional studies were usually performed after 48 h later from the beginning of the transfections. RCAN1 knockdowns were tested by qRT-PCR at 48 and/or 72 h from the beginning of the transfections, depending on the study. Data are reported as the reduction in RCAN1 RNA by the siRNA versus scrambled-sequence control as noted in the results and figure legends.
Protein extraction and western blotting
Cells were washed twice with ice-cold PBS, scraped and resuspended with 500 μl of TBS (20 mM Tris–HCl, pH 7.2, and 150 mM NaCl). After centrifuging at 500 g for 5 min cells were lysed with M-PER buffer (Pierce Biotechnology, Inc., Rockford, IL) containing 0.3 μM Okadaic acid and 1 μg/ml each of aprotinin, pepstatin, leupeptin, and 20 mM of 4-amidino-phenyl methane-sulfonyl fluoride (APMSF). After 15 min incubation with the M-PER buffer on ice, protein was extracted by centrifuging the lysate at 16,000g for 15 min at 4°C. Supernatant was collected in 15 ml tubes and protein concentrations were measured using a BCA protein assay reagent kit (Pierce). Twenty-five μg of total lysate were suspended in reducing SDS buffer (Invitrogen) and boiled for 5 min. The reduced and denaturized lysate was loaded into 12% SDS–PAGE, separated by electrophoresis and then transferred to nitrocellulose membranes. Blocking was achieved incubating the membranes in TBS-T containing 5% nonfat dry milk for 3 h at room temperature. Immunoblotting was performed as previously described [10, 30]. Relative quantitation of proteins was determined by scanning and band densitometry using Image Gauge software (Fuji Photo Film Co, Ltd, Tokyo, Japan).
RNA isolation
Cells were washed twice with PBS and 2 ml of TRIZOL (Invitrogen) were added. Cells were scraped and transferred into two 1.5 ml tubes. After addition of 200 μl of chloroform, tubes were shaken, incubated for 2 min at room temperature and centrifuged at 16,000g for 15 min at 4°C. The supernatant was then transferred into a new 1.5 ml tube and 500 μl of isopropyl alcohol, 5 μg of glycogen was added, and tubes were centrifuged at 16,000g for 15 min at 4°C. The supernatant was aspirated and the pellets containing RNA were combined using 70% ethanol and air-dried afterwards. The RNA was then diluted in DEPC-treated water and measured by spectrophotometry (260/280).
Quantitative Real-time qRT-PCR
Quantitative Real-time RT-PCR was performed to validate RCAN1 siRNA knockdowns and to screen the double stable HT29a and M14/NPA clones for RCAN1 inducibility. 440 ng of RNA were subject to DNase I (Invitrogen) treatment for 15 min and 132 ng of DNA free RNA were reverse transcribed using the TaqMan® Reverse Transcription Reagents Kit (Applied Biosystems). Quantitative PCR was performed in 96 sample plates using cDNA equivalent to 18 ng of total RNA (4 μl of RT reaction mixture) per 25 μl per well. As an internal control to normalized RCAN1 gene expression, 18S ribosomal RNA was amplified using TaqMan Ribosomal RNA control reagents kit as described [10].
PCR was performed with TaqMan® Universal PCR Master Mix (Applied Biosystems) using the following parameters: after an initial 2 min incubation at 50°C for AmpErase® UNG activity, the cDNA was denaturated at 95°C for 10 min. The samples were subjected to 40 cycles of a two-step amplification protocol that included 15 s at 95°C and a one-minute annealing-elongation step at 60°C. RCAN1 and 18S were amplified in all samples in duplicate in two separate reactions. Negative controls were included for the RT (RT negative) and PCR (Non-Template Control) reactions. To quantify results, standard curves were created using serial dilutions of RNA isolated from HEK 293 transiently transfected with RCAN1 cDNA. 18S was also normalized using these same standards. Normalized levels were calculated as the ratio of target mRNA to 18S. Several samples were run on electrophoreses through agarose gels and all showed a single unique band at the expected sizes.
Calcineurin activity
Cellular calcineurin activity was measured using a colorimetric assay from EMD Biosciences Inc (San Diego, CA) utilizing RII phosphopeptide substrate as per the manufacturer’s recommended protocol. Briefly, cells were washed twice and resuspended with ice cold TBS (20 mM Tris–HCl, pH 7.2 and 150 mM NaCl, phosphate-free conditions). After centrifuging the cells at 500g for 5 min, the cells were lysed with proteinase inhibitors-containing lysis buffer, and sheared with a 16-guage needle. The cell lysates were ultracentrifuged at 100,000g for 45 min at 4°C. Phosphate was removed from the samples by passing the cell lysates through a desalting resin (P6 DG Desalting resin) and a chromatography column (5 ml polypropylene column). Phosphatase activity was then measured as total phosphatase activity, phosphatase activity in the presence of okadaic acid (OA), which inhibits phosphatase activity but has no effect on calcineurin and protein phosphatase [(PP)2C], and phosphatase activity in the presence of okadaic acid and EGTA (OA + EGTA, which inhibits all phosphatase activity except PP2C). Calcineurin activity is then calculated using the formula: CaN (PP2B) = OA−(OA + EGTA). Experiments were performed in duplicate on two separate occasions as described in the figure legends.
Quantitative migration assay (crystal violet method)
Cancer cells were grown in RPMI 1640 containing 10% FCS until 40–50% confluent. Cells were washed with PBS, trypsinized for 5–10 min, collected with 0.2% FCS and centrifuged at 300g for 5 min. Then, the cells were resuspended with 0.2% FCS and counted using a hemocytometer and diluted to different concentrations depending on cell type. A volume of 400 μl of this mix was plated onto Boyden Chambers (8 μm pore) inserts in 24 well plates with 500 μl of RPMI containing 5% FCS in the bottom chamber as a chemo-attractant. Cells were then incubated at 37°C 5% CO2. The Boyden Chamber porous membrane was then blotted and fixed with 3.7% formaldehyde containing 0.05% crystal violet for 30 min. After repeated washes with distilled water the chambers were then dried. The migrated cells on the bottom side of the Boyden chamber porous membrane was collected by scraping the bottom of the chamber with a Q-tip which was subsequently placed into a 1.5 ml eppendorf tube. The remainder of the cells therefore remained on the top and within the Boyden chamber. The Q-tip containing the scraped cells, and the Boyden chamber containing the non-migrated cells, were separately incubated in 80% methanol, shaken at 500 rpm for 30 min, and the extracted dye measured at 570 nm. Migration was quantified using the ratio of the migrated cells over the total cells (migrated plus remaining cells) to determine the migration in each individual experiment. Experiments were performed in duplicate on mulitple occasions as described in the figure legends.
Qualitative migration assay (Diff quick)
HT29a and HT29w cells were transfected with RCAN1 or scrambled siRNA (Dharmacon) for 48 h. Cells were then suspended in RPMI 1640 containing 0.2% FCS and diluted to a concentration of 375,000 cells/ml. A volume of 400 μl of this mix was plated onto Boyden Chambers (8 μm pore) with 500 μl containing 5% FCS at the bottom. Cells were then incubated for 48 h at 37°C. Cells were fixed and stained using a Diff-Quick staining kit (Dade Behring Inc., Newark DE). Using both low (10×) and high power (40×) microscope objectives, pictures were taken from multiple locations before and after swiping the upper surface of the Boyden Chamber. This method allowed for qualitative comparison of the total number of cells plated versus all the cells that migrated in different conditions.
Adhesion assay
150,000 HT29a cells stably transfected with pcDNA3.1/Zeo(+)-Tet-On on and the pTRE-RCAN1 plasmids and HT29aWT (pcDNA3.1 (+) pTRE-RCAN1/HA) cells were plated on 96-well plates coated with collagen IV (Combrex Co., East Rutherford, NJ). The cells were incubated with 1 μg/ml of doxycycline and control (distilled water) in 5% FCS RPMI 1640 and incubated for 4 h at 37°C. Using a multi channel pipettor the cells were washed and blotted once with PBS and fixed with 3.7% formaldehyde for 30 min. The cells were then washed twice with PBS and stained with 0.5% of crystal violet for 15–20 min. The cells were washed three times with PBS and blotted until it was completely dry. The dye was extracted using 2% SDS for 30 min while shaking the plate at 500 rpm. OD was measured at 570 nm. Experiments were performed in duplicate on multiple occasions as described in the figure legends.
Statistical analysis
Transfection of siRNA, cell migration, quantitation of RNA, and cell adhesion assay results were examined by Bonferroni-Dunn’s analysis after ANOVA using GB-STAT (Dynamic Microsystems, Inc., Silver Spring, MD). For all analyses, P < 0.05 was considered significant.
Results
Transient overexpression of RCAN1 decreases migration in FTC133 cell lines
To determine if RCAN1 overexpression had an effect in cancer cell migration, FTC133 cells that have low basal levels of RCAN1 mRNA and a high migratory capacity in vitro were transiently transfected with an RCAN1-HA plasmid or vector control. RCAN1 overexpression was confirmed by western blotting using an HA mouse antibody (Fig. 1). After RCAN1 overexpression, FTC133 cell lines had a 46% reduction in migration in Boyden Chamber assays (Fig. 1) (P < 0.05).
Fig. 1.
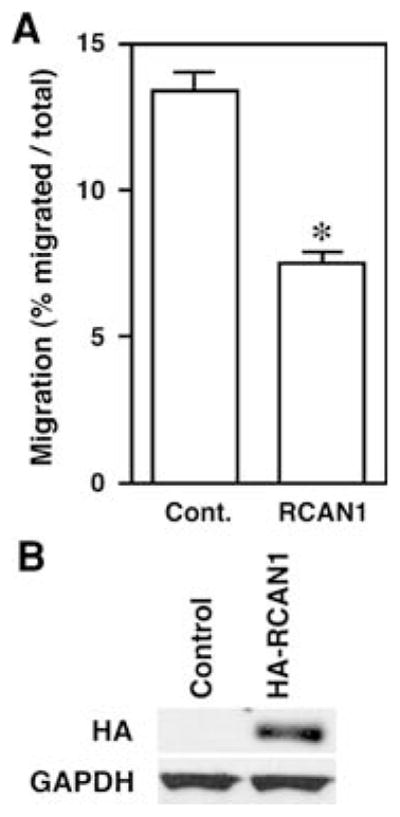
Overexpression of RCAN1 reduces migration of FTC133 cells. FTC 133 follicular thyroid cancer cells were transiently transfected with HA-tagged RCAN1 and Boyden chamber migration assays were performed. Panel A migration was reduced by 46% versus control in experiments performed in duplicate on three separate occasions (*P <0.05). Panel B representative Western blot demonstrating expression of transfected RCAN1 in the transfected cells
RCAN1 knockdown in HT29a and HT29w cells increases cell motility in vitro
To determine if endogenous RCAN1 inhibited cell migration, HT29a and HT29w cells that have low baseline motility rates and express RCAN1 were transfected with RCAN1 siRNA or scrambled control siRNA and migration experiments were performed. Successful RCAN1 knock downs confirmed by qRT-PCR. RCAN1 mRNA levels were reduced by ~70% in HT29a and 50% in HT29w (both P < 0.01 versus control, Fig. 2). In each of these replicate experiments, the siRNA reduced the levels of RCAN1 siRNA versus scrambled control. Western blots for endogenous protein were attempted but results were unreliable due to difficulties with available anti-RCAN1 antibodies. In both HT29 cell lines, loss of RCAN1 mRNA expression was associated with a statistically significant increase in cell motility in vitro (P < 0.01, Fig. 2). The increase in motility tended to correlate with the degree of knock down in the experiments.
Fig. 2.

Reduction of RCAN1 expression increases HT29a and HT29w cell migration. Panel A example of the effect of RCAN1 siRNA on HT29 cell migration is demonstrated using HT29a cells. Cells were transfected either with scrambled siRNA (control) or RCAN1 siRNA and images were taken before (All) and after (Migrated) swiping the top of the membrane. Panel B quantitation of migration from duplicate wells in two or three (HT29w and HT29a, respectively) independent experiments were performed. For both HT29 subclones, cells transfected with RCAN1 siRNA displayed increased migration rates versus cells transfected with control scrambled siRNA (* P < 0.01 for both cell lines). Panel C Quantitative RT-PCR confirms the reduction in RCAN1 mRNA by the siRNA compared with scrambled control
Creation of RCAN1 doxycycline inducible cancer cell lines
To further characterize the functional effects of RCAN1, we created cancer cell lines with doxycycline-inducible HA-tagged RCAN-1 in HT29a cells. After stable transfection of HT29a cells with pcDNA3.1/Zeo(+)-Tet-On, screening for HT29a cell lines with low basal expression levels and high levels of inducibility was performed. In total, four HT29a rtTA parental cell lines, with pTRE-Luc inducibilities ranging from 17-fold to 33-fold increases, were selected and stably transfected with the pTRE-RCAN1HA plasmid. Several clones from each parental cell line were grown in the presence and absence of 1 μg/ml of tetracycline and screened for inducible RCAN1 mRNA and protein expression by qRT-PCR and Western blotting, respectively.
RCAN1 mRNA inducibility was tested with primers that bind to exons four and five of the DSCR1 gene. Inducibility at the protein level was assessed using an HA mouse antibody. Two HT29a RCAN1HA doxycycline inducible clones were selected (HT29aT2p10 and HT29aT7p6) for further studies based on these experiments. A similar selection process was performed for M14/NPA cells where two inducible cell lines were also isolated.
Time course experiments demonstrated robust induction of RCAN1 protein expression beginning 6 h after incubation with 1 μg/ml Doxycycline, maximal expression was detected after 24 h (Fig. 3a). Both HT29a (HT29aT2p10 and HT29aT7p6) and M14/NPA clones were then incubated in different concentrations of doxycycline (50 ng/ml to 1 μg/ml) for 24 h (Fig. 3b). Using an anti-HA antibody it was determined that HT29aT7p6 had higher RCAN1 levels than HT29aT2p10 after normalization of RCAN1 to GAPDH. RCAN1 protein was not detected in the M14/NPA clones. Because M14/NPA cells have been shown to have a homozygous mutation in BRAF, we hypothesized that RCAN1 was more rapidly degraded in these cells as this process has been shown to be ERK-dependent [23]. M14/NPA cells were transiently transfected with the RCAN1-HA plasmid or vector control and incubated with the proteasome inhibitor Bortezamib at 100 and 200 nM concentrations. RCAN1 protein was detected in these conditions, suggesting that proteasomal degradation may
Fig. 3.
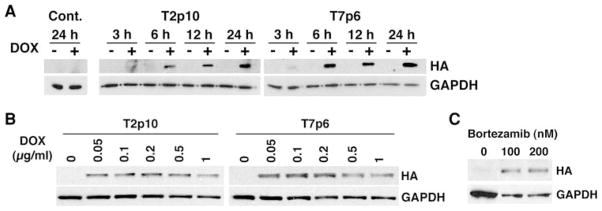
Time course and dose–response for inducible RCAN1 expression. Panel A a representative time course experiment for induction of RCAN1 expression by doxycycline in two clones of HT29a cells expressing doxycycline inducible RCAN1HA is shown. Cells were incubated with 1 μg/ml doxycycline versus vehicle. Maximal response was detected at 24 h. Panel B dose–response for HT29a clones: based on the data in Panel A, HT29a cells expressing doxycycline inducible RCAN1HA were treated with different doses of doxycycline for 24 h and Western blots were performed. Panel C M14/NPA cells with stable expression of doxycycline inducible RCAN1HA were created. While HA was detected at the mRNA level, protein was not detected by Western Blot. M14/NPA cells were transiently transfected with RCAN1HA in the presence of 100 or 200 nM bortezamib or vehicle control. Bortezamib treatment resulted in the ability to detect the transfected protein suggesting constitutive proteasomal degreation of RCAN1 in these cells be one method by which cells escape the inhibitor effects of RCAN1 (Fig. 3c).
Effect of RCAN1 overexpression in HT29a cellular functions
Migration and adhesion
Numerous (>10) migration assays were performed using HT29a RCAN1HA doxycycline inducible clones. There was no significant reduction in HT29a migration in Boyden chamber assays. However, the basal migration in these cells is already very low (<10%), similar to the parental HT29a cell line suggesting they may not be optimal for detecting motility inhibition. An independent effect of doxycycline on the control cells was not identified.
Because HT29a cells are relatively non-motile, we hypothesized that RCAN1 may have a measurable effect on cell adhesion to extracellular matrix components. Pilot studies to determine the degree of adhesion the cells demonstrated to different matrix proteins were performed using plates in which wells were coated with different matrix proteins including fibronectin, fibrinogen, laminin, Collagen I and IV (Cell Biolabs Inc., San Diego, CA). In concordance with the literature [31], HT29a cells were most adherent to collagen IV (three fold increase versus BSA control). Using collagen IV pre-coated 96 well plates (BD Biosciences, SanJose, CA), both clones of HT29a RCAN1HA cells displayed an enhanced cell adhesion to collagen IV in the presence of doxycycline in both cell lines. The difference was statistically significant for the T2P10 line (P < 0.05) and showed a similar, but non-statistically significant trend for the T7P6 line. Because a modest but consistent inhibitory effect of doxycycline on adhesion was identified in experiments using the HT29WT control cells, we also compared doxyxcycline-induced adhesion changes in the T2P10 and T7P6 to the control cells to account for an independent effect of doxycycline. When accounting for this effect, the increase in adhesion in the presence vs absence of doxyxcycline was statistically significant for both cell lines (P < 0.01, Fig. 4).
Fig. 4.
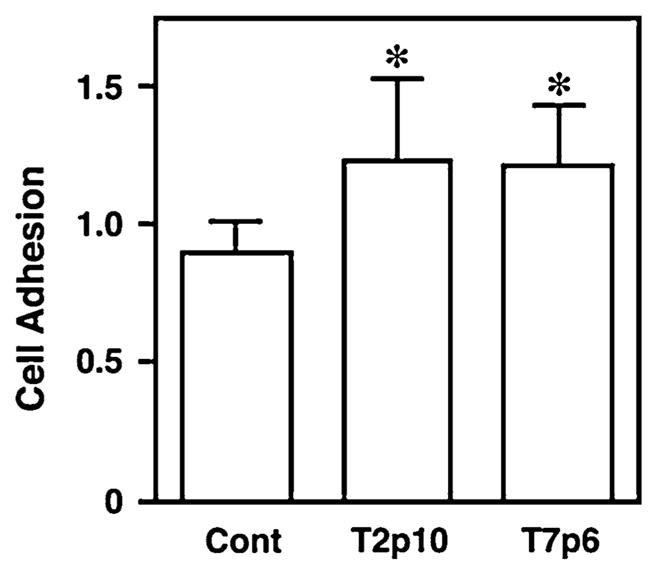
RCAN1 regulates HT29a adhesion to collagen IV. Cell adhesion to collagen IV was measured in two HT29a clones (T2p10 and T7p6) with stable expression of doxycycline-inducible RCAN1 in the presence or absence of 1 μg/ml doxyxycline. Experiments were performed in duplicate in five independent experiments. In both cell lines, expression of RCAN1 was associated with an increase in adhesion to Collagen IV compared with the effects of doxycycline on HT29WT control cells (P <0.01)
Cell proliferation
HT29a cells were studied for regulation of proliferation in vitro. In both DNA content assays and MTT assays, no consistent effect of RCAN1 expression was identified in HT29a cells (data not shown).
RCAN1 over expression inhibits calcineurin activity in HT29a cells
To determine if RCAN1 altered calcineurin activity in the HT29a cells with inducible expression of RCAN1, cells were incubated in the presence or absence of doxycycline and calcineurin activity was measured as previously described [17] 24 h after incubation when robust protein levels were detected in Western blot. These data demonstrated that calcineurin activity was reduced in cells with RCAN1 overexpression in one cell line (P < 0.05) with a non-statistically significant trend in the second cell line, consistent with the known effects of RCAN1 on calcineurin activity (Fig. 5).
Fig. 5.
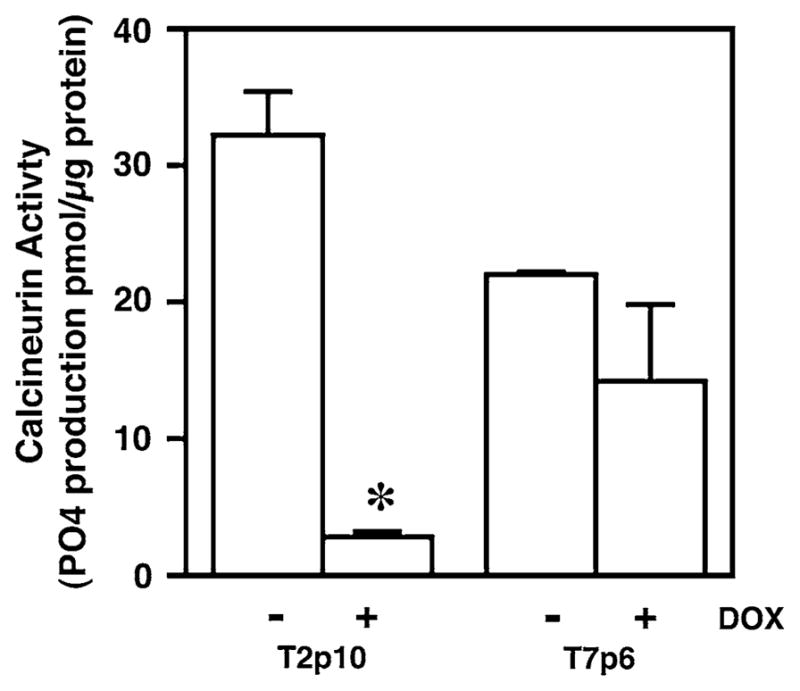
RCAN1 reduces calcineurin activity in HT29a cells. Calcineurin activity was measured in two HT29a clones (T2p10 and T7p6) with stable expression of doxycycline-inducible RCAN1 in the presence or absence of 1 μg/ml doxyxycline in duplicate in two independent experiments. Calcineurin activity was reduced in T2p10 cells treated with doxycycline (* P < 0.01). A similar but non-statistically significant trend was noted in the T7p6 cells
Discussion
The interest in RCAN1 that led to the work in this manuscript derived from prior studies in which RCAN1 mRNA was found to be consistently upregulated in response to GPR54 activation by recombinant metastin. Moreover, the increase in RCAN1 levels was associated with reduced calcineurin activity and inhibition of calcineurin signaling using cyclosporine or a specific peptide inhibitor (VIVIT) blocked migration of cancer cells with high levels of inducible motility in transwell filter assays [17]. These observations indirectly implicated RCAN1 as a motility suppressor gene. To directly test the hypothesis that RCAN1 functions as a motility suppressor, RCAN1 was overexpressed FTC 133 follicular thyroid cancer cells that his highly motile in several different assays (wound healing and Boyden chambers) in response to serum chemoattractant. In addition to being motile, these cells do not express detectable levels of RCAN1 mRNA, making them an excellent model for overexpression studies. The data in these experiments demonstrate that RCAN1 overexpression can result in reduced cell motility in vitro. The mechanism for loss of RCAN1 expression in these cells appears to be epigenetic as treatment with trichostatin A and SAHA results in re-expression of the RCAN1 mRNA (data not shown).
These findings are similar to those described in our previous work in M14/NPA melanoma cells that display calcineurin-dependent cell migration using both cyclosporine A and the more specific VIVIT peptide that directly competes with NFAT for calcineurin binding [17]. To test the effect of RCAN1 in these cells that also have low levels of RCAN1, we attempted to create M14/NPA cells with doxycycline-inducible RCAN1. Several M14/NPA melanoma cell clones with inducible RCAN1 were isolated at the mRNA level; however, protein levels were not identified. Because M14/NPA cells have a homozygous V600E activating mutation in BRAF, we hypothesized that the RCAN1 protein in these cells was unstable. RCAN1 protein stability has been shown to be regulated by the MAPK pathway [23] and CREB [24]. Indeed, treatment with of these clones with Bortezamib after transfection with RCAN1 resulted in identification of RCAN1 protein in these cell lines. Thus, it appears that both transcriptional and post-translational regulation of RCAN1 occurs in cancer cells suggesting the loss of RCAN1 function can occur through several mechanisms in cancer cells.
We next wanted to address the effects of endogenous RCAN1 on cell motility by reducing endogenous expression using siRNA. For these studies, we identified several cell lines with a low migration rate that have detectable expression of RCAN1. We focused our work on the ARO and WRO cell lines. During the course of our work, there was a report questioning the genetic uniqueness and lineage of these cell lines [28, 29]. We therefore performed DNA fingerprinting using STR analysis and compared our results with that of Schweppe et al. [28]. Using this method, we demonstrated that these two cell lines were genetically similar to HT29 cells (data not shown). Thus, these two cell lines appear to be subclones of HT29 colon cancer cells. In both HT29 subclones, reducing RCAN1 levels using siRNA increased the ability of the cells to migrate. The degree of migration change correlated with the degree of siRNA-induced reduction in RCAN1 expression. These results indicate that endogenous RCAN1 functions as a motility suppressor in HT29 colon cancer cells. These data are consistent with those of Bush et al. [25] who reported a key regulatory role for RCAN1 in PPAR-γ mediated invasiveness in MOSER colon cancer cells.
We then created HT29a cells with doxycycline inducible RCAN1. In these cells, RCAN1 overexpression did not convincingly further reduce cell migration either in short-term (1–3 days), or long-term (1–2 weeks) experiments. Overexpression of RCAN1 mRNA and protein was confirmed, as was a reduction in calcineurin activity. We interpreted this as being due to the low motility rates of the cell lines and the presence of basal RCAN1 expression. However, as part of the cellular characterization of these HT29a clones, it was noted that they appeared more adherent to the plastic dishes. Subsequent experiments demonstrated that RCAN1 overexpression in these cells consistently increased cell adhesion to collagen IV. These results suggest that RCAN1 may regulate both motility and adhesion.
Because of the published role of RCAN1 as a negative regulator of calcineurin signaling and our prior data demonstrating calcineurin-dependent migration in these cell lines, we have focused our signaling measurement on this pathway. A recent manuscript by Mulero et al. [32] suggests that RCAN1 may exert effects on other signaling cascades. It will be relevant to clarify the precise mechanism for the RCAN1 effects noted in future experiments.
It is recognized that the in vitro studies included in this manuscript do not provide evidence that RCAN1 is a bona fide metastasis suppressor gene [33]. The functional assay of metastasis requires in vivo studies. However, they do provide evidence that RCAN1 functions to regulate migration and/or adhesion in several cell lines derived from different cancers. We believe that our observations along with the previously reported observation that RCAN1 inhibits VEGF induced angiogeneis [27] supports further study into the role of RCAN1 in cancer progression in vivo although the effects may differ between the various isoforms of RCAN1 [34]. It is also important to note that a fetal calf serum gradient was used to induce migration in these cells. This is a non-specific potent stimulus. It will be important to determine, in future experiments, if specific motility stimuli elicit specific RCAN1-dependent cellular responses.
In summary, in the present manuscript we have determined that RCAN1 functions as a regulator of motility in several cancer cell lines. Loss of endogenous RCAN1 in cell lines that express the protein results in increased cell migration and the expression of RCAN1 in cells with low basal levels of expression inhibit cell motility. RCAN1 expression levels can be regulated in several different manners in cancer cells that may be relevant to the behavior of the cells in vitro. Taken together with prior data demonstrating loss of RCAN1 in lymph node metastasis, further studies to determine the role of RCAN1 in cancer in vivo are warranted.
Acknowledgments
This work was supported by grants 1R21 CA111461 and 1R01 CA102572 to MDR from NIH.
Abbreviations
- RCAN1
Regulator of calcineurin 1
- NFAT
Nuclear factor of activated T-cells
- FTC
Follicular thyroid cancer
- GPR54
G protein coupled receptor 54
- PBS
Phosphate-buffered saline
- TBS
Tris-buffered saline
Contributor Information
Allan V. Espinosa, Division of Endocrinology, Diabetes, and Metabolism, The Ohio State University College of Medicine and Arthur G. James Comprehensive Cancer Center, 445D McCampbell Hall, 1581 Dodd Drive, Columbus, OH 43210, USA
Motoo Shinohara, Division of Endocrinology, Diabetes, and Metabolism, The Ohio State University College of Medicine and Arthur G. James Comprehensive Cancer Center, 445D McCampbell Hall, 1581 Dodd Drive, Columbus, OH 43210, USA.
Leonardo M. Porchia, Division of Endocrinology, Diabetes, and Metabolism, The Ohio State University College of Medicine and Arthur G. James Comprehensive Cancer Center, 445D McCampbell Hall, 1581 Dodd Drive, Columbus, OH 43210, USA
Yun Jae Chung, Division of Endocrinology, Diabetes, and Metabolism, The Ohio State University College of Medicine and Arthur G. James Comprehensive Cancer Center, 445D McCampbell Hall, 1581 Dodd Drive, Columbus, OH 43210, USA. Division of Endocrinology and Metabolism, Department of Internal Medicine, Chung-Ang University College of Medicine, Seoul, Korea.
Samantha McCarty, Division of Endocrinology, Diabetes, and Metabolism, The Ohio State University College of Medicine and Arthur G. James Comprehensive Cancer Center, 445D McCampbell Hall, 1581 Dodd Drive, Columbus, OH 43210, USA.
Motoyasu Saji, Division of Endocrinology, Diabetes, and Metabolism, The Ohio State University College of Medicine and Arthur G. James Comprehensive Cancer Center, 445D McCampbell Hall, 1581 Dodd Drive, Columbus, OH 43210, USA.
Matthew D. Ringel, Email: matthew.ringel@osumc.edu, Division of Endocrinology, Diabetes, and Metabolism, The Ohio State University College of Medicine and Arthur G. James Comprehensive Cancer Center, 445D McCampbell Hall, 1581 Dodd Drive, Columbus, OH 43210, USA
References
- 1.Chiang AC, Massague J. Molecular basis of metastasis. N Engl J Med. 2008;359(26):2814–2823. doi: 10.1056/NEJMra0805239. [DOI] [PMC free article] [PubMed] [Google Scholar]
- 2.Chambers AF, Groom AC, MacDonald IC. Dissemination and growth of cancer cells in metastatic sites. Nat Rev Cancer. 2002;2(8):563–572. doi: 10.1038/nrc865. [DOI] [PubMed] [Google Scholar]
- 3.Ramaswamy S, Ross KN, Lander ES, et al. A molecular signature of metastasis in primary solid tumors. Nat Genet. 2003;33(1):49–54. doi: 10.1038/ng1060. [DOI] [PubMed] [Google Scholar]
- 4.Podsypanina K, Du YC, Jechlinger M, et al. Seeding and propagation of untransformed mouse mammary cells in the lung. Science. 2008;321(5897):1841–1844. doi: 10.1126/science.1161621. [DOI] [PMC free article] [PubMed] [Google Scholar]
- 5.Shevde LA, Welch DR. Metastasis suppressor pathways-an evolving paradigm. Cancer Lett. 2003;198(1):1–20. doi: 10.1016/S0304-3835(03)00304-5. [DOI] [PubMed] [Google Scholar]
- 6.Ohtake T, Shintani Y, Honda S, et al. Metastasis suppressor gene KiSS-1 encodes peptide ligand of a G-protein-coupled receptor. Nature. 2001;411(6787):613–617. doi: 10.1038/35079135. [DOI] [PubMed] [Google Scholar]
- 7.Kotani M, Detheux M, Vandenbogaerde A, et al. The metastasis suppressor gene KiSS-1 encodes kisspeptins, the natural ligands of the orphan G protein-coupled receptor GPR54. J Biol Chem. 2001;276(37):34631–34636. doi: 10.1074/jbc.M104847200. [DOI] [PubMed] [Google Scholar]
- 8.Muir AI, Chamberlain L, Elshourbagy NA, et al. AXOR12: a novel human G protein-coupled receptor, activated by the peptide KiSS-1. J Biol Chem. 2001;276(31):28969–28975. doi: 10.1074/jbc.M102743200. [DOI] [PubMed] [Google Scholar]
- 9.Lee JH, Miele ME, Hicks DJ, et al. KiSS-1, a novel human malignant melanoma metastasis-suppressor gene. J Natl Cancer Inst. 1996;88(23):1731–1737. doi: 10.1093/jnci/88.23.1731. [DOI] [PubMed] [Google Scholar]
- 10.Ringel MD, Hardy E, Bernet VJ, et al. Metastin receptor is overexpressed in papillary thyroid cancer and activates MAP kinase in thyroid cancer cells. J Clin Endocrinol Metab. 2002;87(5): 2399–2402. doi: 10.1210/jc.87.5.2399. [DOI] [PubMed] [Google Scholar]
- 11.Ikeguchi M, Yamaguchi K, Kaibara N. Clinical significance of the loss of KiSS-1 and orphan G-Protein-coupled receptor (hOT7T175) gene expression in esophageal squamous cell carcinoma. Clin Cancer Res. 2004;10(4):1379–1383. doi: 10.1158/1078-0432.CCR-1519-02. [DOI] [PubMed] [Google Scholar]
- 12.Dhar DK, Naora H, Kubota H, et al. Downregulation of KiSS-1 expression is responsible for tumor invasion and worse prognosis in gastric carcinoma. Int J Cancer. 2004;111(6):868–872. doi: 10.1002/ijc.20357. [DOI] [PubMed] [Google Scholar]
- 13.Hori A, Honda S, Asada M, et al. Metastin suppresses the motility and growth of CHO cells transfected with its receptor. Biochem Biophys Res Commun. 2001;286(5):958–963. doi: 10.1006/bbrc.2001.5470. [DOI] [PubMed] [Google Scholar]
- 14.Shirasaki F, Takata M, Hatta N, et al. Loss of expression of the metastasis suppressor gene KiSS1 during melanoma progression and its association with LOH of chromosome 6q16.3–q23. Cancer Res. 2001;61(20):7422–7425. [PubMed] [Google Scholar]
- 15.Jiang Y, Berk M, Singh LS, et al. KiSS1 suppresses metastasis in human ovarian cancer via inhibition of protein Kinase C Alpha. Clin Exp Metastasis. 2005;22(5):369–376. doi: 10.1007/s10585-005-8186-4. [DOI] [PubMed] [Google Scholar]
- 16.Nash KT, Phadke PA, Navenot J-M, et al. Requirement of KISS1 secretion for multiple organ metastasis suppression and maintenance of tumor dormancy. J Natl Cancer Inst. 2007;99(4):309–321. doi: 10.1093/jnci/djk053. [DOI] [PMC free article] [PubMed] [Google Scholar]
- 17.Stathatos N, Bourdeau I, Espinosa AV, et al. KiSS-1/G protein-coupled receptor 54 metastasis suppressor pathway increases myocyte-enriched calcineurin interacting protein 1 expression and chronically inhibits calcineurin activity. J Clin Endocrinol Metab. 2005;90(9):5432–5440. doi: 10.1210/jc.2005-0963. [DOI] [PubMed] [Google Scholar]
- 18.Fuentes JJ, Pritchard MA, Estivill X. Genomic organization, alternative splicing, and expression patterns of the DSCR1 (Down syndrome candidate region 1) gene. Genomics. 1997;44(3):358–361. doi: 10.1006/geno.1997.4866. [DOI] [PubMed] [Google Scholar]
- 19.Rothermel B, Vega RB, Yang J, et al. A protein encoded within the Down syndrome critical region is enriched in striated muscles and inhibits calcineurin signaling. J Biol Chem. 2000;275(12):8719–8725. doi: 10.1074/jbc.275.12.8719. [DOI] [PubMed] [Google Scholar]
- 20.Vega RB, Rothermel BA, Weinheimer CJ, et al. Dual roles of modulatory calcineurin-interacting protein 1 in cardiac hypertrophy. Proc Natl Acad Sci USA. 2003;100(2):669–674. doi: 10.1073/pnas.0237225100. [DOI] [PMC free article] [PubMed] [Google Scholar]
- 21.van Rooij E, Doevendans PA, Crijns HJ, et al. MCIP1 overexpression suppresses left ventricular remodeling and sustains cardiac function after myocardial infarction. Circ Res. 2004;94(3):e18–e26. doi: 10.1161/01.RES.0000118597.54416.00. [DOI] [PubMed] [Google Scholar]
- 22.Vega RB, Yang J, Rothermel BA, et al. Multiple domains of MCIP1 contribute to inhibition of calcineurin activity. J Biol Chem. 2002;277(33):30401–30407. doi: 10.1074/jbc.M200123200. [DOI] [PubMed] [Google Scholar]
- 23.Abbasi S, Lee J-D, Su B, et al. Protein kinase-mediated regulation of calcineurin through the phosphorylation of modulatory calcineurin-interacting protein 1. J Biol Chem. 2006;281(12):7717–7726. doi: 10.1074/jbc.M510775200. [DOI] [PubMed] [Google Scholar]
- 24.Seo SR, Chung KC. CREB activates proteasomal degradation of DSCR1/RCAN1. FEBS Lett. 2008;582(13):1889–1893. doi: 10.1016/j.febslet.2008.04.059. [DOI] [PubMed] [Google Scholar]
- 25.Bush CR, Havens JM, Necela BM, et al. Functional genomic analysis reveals cross-talk between peroxisome proliferator-activated receptor gamma and calcium signaling in human colorectal cancer cells. J Biol Chem. 2007;282(32):23387–23401. doi: 10.1074/jbc.M702708200. [DOI] [PubMed] [Google Scholar]
- 26.Iizuka M, Abe M, Shiiba K, et al. Down syndrome candidate region 1, a downstream target of VEGF, participates in endothelial cell migration and angiogenesis. J Vasc Res. 2004;41(4):334–344. doi: 10.1159/000079832. [DOI] [PubMed] [Google Scholar]
- 27.Minami T, Horiuchi K, Miura M, et al. Vascular endothelial growth factor- and thrombin-induced termination factor, down syndrome critical region-1, attenuates endothelial cell proliferation and angiogenesis. J Biol Chem. 2004;279(48):50537–50554. doi: 10.1074/jbc.M406454200. [DOI] [PubMed] [Google Scholar]
- 28.Schweppe RE, Klopper JP, Korch C, et al. Deoxyribonucleic acid profiling analysis of 40 human thyroid cancer cell lines reveals cross-contamination resulting in cell line redundancy and misidentification. J Clin Endocrinol Metab. 2008;83(11):4331–4341. doi: 10.1210/jc.2008-1102. [DOI] [PMC free article] [PubMed] [Google Scholar]
- 29.Ringel MD. “Thyroid cancer” cell line misidentification: a time for proactive change. J Clin Endocrinol Metab. 2008;93(11):4226–4227. doi: 10.1210/jc.2008-2008. [DOI] [PMC free article] [PubMed] [Google Scholar]
- 30.Vasko V, Saji M, Hardy E, et al. Akt activation and localization correlate with tumor invasion and oncogene expression in thyroid cancer. J Med Genet. 2004;41(3):161–170. doi: 10.1136/jmg.2003.015339. [DOI] [PMC free article] [PubMed] [Google Scholar]
- 31.Hoffmann S, Maschuw K, Hassan I, et al. Differential pattern of integrin receptor expression in differentiated and ana-plastic thyroid cancer cell lines. Thyroid. 2005;15(9):1011–1020. doi: 10.1089/thy.2005.15.1011. [DOI] [PubMed] [Google Scholar]
- 32.Mulero MC, Aubareda A, Orzaez M, et al. Inhibiting the calcineurin-NFAT signaling pathway with a regulator of calcineurin-derived peptide without affecting general calcineurin phosphatase activity. J biol chem. 2009 doi: 10.1074/jbc.M805889200. [Epub ahead of print] [DOI] [PMC free article] [PubMed] [Google Scholar]
- 33.Rinker-Schaeffer CW, O’Keefe JP, Welch DR, et al. Metastasis suppressor proteins: discovery, molecular mechanisms, and clinical application. Clinical Cancer Research. 2006;12(13): 3882–3889. doi: 10.1158/1078-0432.CCR-06-1014. [DOI] [PMC free article] [PubMed] [Google Scholar]
- 34.Ryeom S, Baek K-H, Rioth MJ, et al. Targeted deletion of the calcineurin inhibitor DSCR1 suppresses tumor growth. Cancer Cell. 2008;13(5):420–431. doi: 10.1016/j.ccr.2008.02.018. [DOI] [PubMed] [Google Scholar]