Abstract
Although meta-analyses of genome-wide association studies have identified >60 single nucleotide polymorphisms (SNPs) associated with type 2 diabetes and/or glycemic traits, there is little information on whether these variants also affect α-cell function. The aim of the current study was to evaluate the effects of glycemia-associated genetic loci on islet function in vivo and in vitro. We studied 43 SNPs in 4,654 normoglycemic participants from the Finnish population-based Prevalence, Prediction, and Prevention of Diabetes-Botnia (PPP-Botnia) Study. Islet function was assessed, in vivo, by measuring insulin and glucagon concentrations during oral glucose tolerance test, and, in vitro, by measuring glucose-stimulated insulin and glucagon secretion from human pancreatic islets. Carriers of risk variants in BCL11A, HHEX, ZBED3, HNF1A, IGF1, and NOTCH2 showed elevated whereas those in CRY2, IGF2BP2, TSPAN8, and KCNJ11 showed decreased fasting and/or 2-h glucagon concentrations in vivo. Variants in BCL11A, TSPAN8, and NOTCH2 affected glucagon secretion both in vivo and in vitro. The MTNR1B variant was a clear outlier in the relationship analysis between insulin secretion and action, as well as between insulin, glucose, and glucagon. Many of the genetic variants shown to be associated with type 2 diabetes or glycemic traits also exert pleiotropic in vivo and in vitro effects on islet function.
In the last few years, genome-wide association studies have substantially increased the knowledge of genetic variants predisposing to type 2 diabetes. Although the majority of these single nucleotide polymorphisms (SNPs) seem to influence insulin secretion, few, if any, studies have assessed their simultaneous effects on β- and α-cell function in vivo and in vitro. The aim of the current study was to provide a comprehensive evaluation of the effects of genetic loci associated with type 2 diabetes (1) and/or glucose and insulin levels (2) on islet function in vivo, in a large well-characterized population-based study from the western coast of Finland (the Prevalence, Prediction, and Prevention of Diabetes-Botnia [PPP-Botnia] Study), and in vitro, in human pancreatic islets. Islet function was assessed by measuring insulin and glucagon concentrations during an oral glucose tolerance test (OGTT).
RESEARCH DESIGN AND METHODS
Study population.
The PPP-Botnia Study is a population-based study from the Botnia region of western Finland. Nondiabetic subjects (n = 4,654; fasting plasma glucose <7.0 mmol/L and 2-h plasma glucose <11.1 mmol/L) were included in the current study (3) (Supplementary Table 1).
Measurements.
Blood samples were drawn at 0, 30, and 120 min of the OGTT. Insulin was measured using a fluoroimmunometric assay (AutoDelfia; PerkinElmer, Waltham, MA) and serum glucagon using radioimmunoassay (Millipore, St. Charles, MO). Insulin sensitivity index (ISI) was calculated as 10,000/√(fasting P-glucose × fasting P-insulin × mean OGTTglucose × mean OGTTinsulin) (4). Insulin secretion was assessed as corrected insulin response (CIR) during OGTT {CIR = 100 × insulin at 30 min/[glucose at 30 min× (glucose 30 min − 3.89)]} (5) or as disposition index (DI), i.e., insulin secretion adjusted for insulin sensitivity (DI = CIR × ISI).
Genotyping.
Genotyping was performed either by matrix-assisted laser desorption-ionization time-of-flight mass spectrometry on the MassARRAY platform (Sequenom, San Diego, CA) or by an allelic discrimination method with a TaqMan assay on the ABI 7900 platform (Applied Biosystems, Foster City, CA). We obtained an average genotyping success rate of 98.1%, and the average concordance rate, based on 10,578 (6.5%) duplicate comparisons, was 99.9%. Hardy-Weinberg equilibrium was fulfilled for all studied variants (P > 0.05).
Glucose-stimulated insulin and glucagon secretion in human pancreatic islets.
Glucose-stimulated insulin and glucagon secretion were performed in high (16.7 mmol/L) and low (1.0 mmol/L) glucose concentration in the medium as described previously (6) and were available from 56 nondiabetic human pancreatic islet donors. Given the limited number of donors for genetic analyses, the relationships between absolute genotypic means of insulin and glucagon concentrations and the 95% CI were plotted separately for different genotype carriers rather than contrasting mean differences in phenotypes between genotypes.
Statistical analysis.
Variables are presented as mean ± SD and, if not normally distributed, as median (IQR). Genotype-phenotype correlations were studied using linear regression analyses adjusted for age, sex, and BMI. Nonnormally distributed variables were logarithmically (natural) transformed for analyses. All statistical analyses were performed with IBM SPSS Statistics version 19.0 (IBM, Armonk, NY) and PLINK version 1.07 (7,8).
RESULTS
Effect of SNPs on metabolic variables
Insulin secretion.
We observed the strongest effect on reduced insulin secretion for the MTNR1B rs10830963 (CIR P = 4.3 × 10⁻²²; DI P = 3.4 × 10⁻³²). Additionally, we confirmed that genetic variants in CDKAL1 (CIR P = 1.6 × 10⁻⁷; DI P = 2.5 × 10⁻¹¹), HHEX (CIR P = 1.4 × 10⁻⁴; DI P = 0.0021), GIPR (CIR P = 3.1 × 10⁻⁴; DI P = 0.0061), GCK (CIR P = 0.0010; DI P = 9.2 × 10⁻⁴), KCNQ1 (CIR P = 0.0032; DI P = 0.0054), CDKN2A/2B (CIR P = 0.016; DI P = 0.0072), FADS1 (CIR P = 6.6 × 10⁻⁴), IGF2BP2 (DI P = 0.0013), JAZF1 (DI P = 0.015), KCNJ11 (CIR P = 0.019), PPARG (DI P = 0.023), ZFAND6 (CIR P = 0.026), CHCHD2P9 (DI P = 0.039), ARAP1 (CIR P = 0.039), and BCL11A (CIR P = 0.048) were associated with reduced insulin secretion (Supplementary Table 2).
Insulin action.
The variants in MTNR1B (P = 6.3 × 10⁻⁴), CHCHD2P9 (P = 0.011), FADS1 (P = 0.013), PPARG (P = 0.041), and CDKAL1 (P = 0.042) were associated with reduced insulin sensitivity (Supplementary Table 3).
Glucagon secretion.
To explore whether these genetic variants would also influence α-cell function, we analyzed glucagon concentrations during OGTT. The variants in BCL11A (P = 0.0069), HHEX (P = 0.0096), ZBED3 (P = 0.033), and HNF1A (P = 0.047) were associated with elevated fasting glucagon levels, whereas variants in CRY2 (P = 0.0021), IGF2BP2 (P = 0.0036), and TSPAN8 (P = 0.034) were associated with reduced fasting glucagon levels. Furthermore, variants in IGF1 (P = 0.0048), ZBED3 (P = 0.0094), and NOTCH2 (P = 0.016) were associated with increased postprandial glucagon levels and the variant in KCNJ11 (P = 0.027) with decreased postprandial glucagon levels (Supplementary Table 4).
Effect of SNPs on relationships between metabolic variables
Insulin secretion vs. sensitivity (CIR vs. ISI).
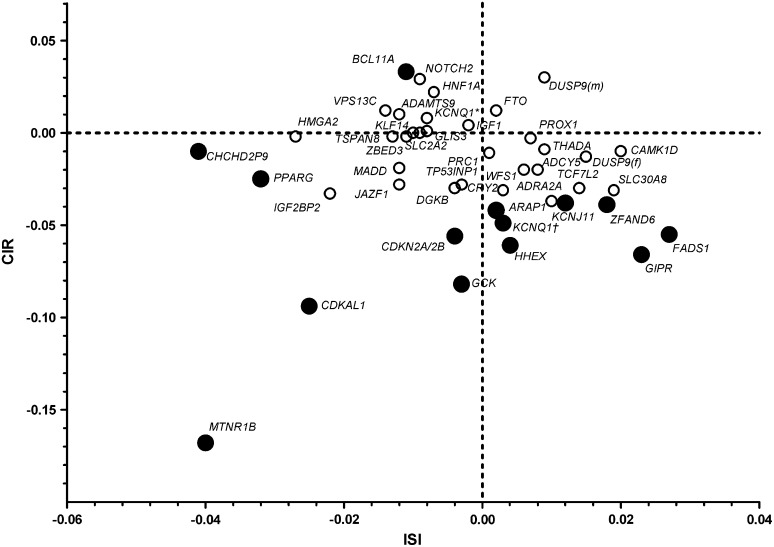
We plotted the effects of the tested genetic variants on CIR and ISI (Fig. 1). Most SNPs were related to insulin secretion and sensitivity in a linear fashion, with SNPs in the MTNR1B, CDKAL1, GCK, CDKN2A/2B, and PPARG loci in the lower left quadrant, reflecting both impaired insulin secretion and action, with MTNR1B being the most extreme. In contrast, variants in GIPR, FADS1, CAMK1D, and TCF7L2 showed relatively high insulin sensitivity despite low insulin secretion. A genotype-centric analysis (Supplementary Fig. 1) also showed that homozygous carriers of MTNR1B, CDKAL1, and GCK risk genotypes had CIR values below the values expected from ISI values, whereas TT carriers of TCF7L2 showed rather high insulin sensitivity.
FIG. 1.
Graphic representation of effects of genetic variants on the relationship between insulin secretion and insulin sensitivity in nondiabetic participants in the PPP-Botnia Study. Effect sizes are betas from linear regression adjusted for age, sex, and BMI. Whereas most genetic variants either increased insulin secretion or insulin sensitivity, those in MTNR1B, CDKAL1, and GCK were located to the lower left quadrant, reflecting both impaired insulin secretion and insulin sensitivity, with MTNR1B being the most extreme. In contrast, GIPR and FADS1 showed relatively high insulin sensitivity despite low insulin secretion. KCNQ1† represents rs2237895, and KCNQ1* represents rs231362. Black circles, P < 0.05; white circles, P > 0.05.
Glucose vs. insulin levels.
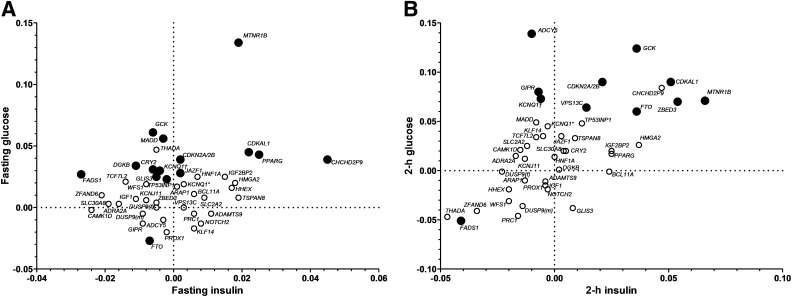
The variant in MTNR1B showed both high fasting glucose and insulin levels (Fig. 2 and Supplementary Tables 5 and 6). At the same glucose level, CHCHD2P9 showed the highest and FADS1 the lowest fasting insulin concentration, whereas at the same fasting insulin concentration, FTO showed the lowest and GCK the highest fasting glucose levels. Homozygous carriers of the TCF7L2 risk variant had the lowest insulin levels, whereas homozygous carriers of HMGA2 showed the highest insulin levels (Supplementary Fig. 2). These differences were also partially seen at 2 h of the OGTT.
FIG. 2.
Graphic representation of effects of genetic variants on the relationship between glucose and insulin levels during OGTT in nondiabetic participants of the PPP-Botnia Study. Effect sizes are betas from linear regression adjusted for age, sex, and BMI. KCNQ1† represents rs2237895, and KCNQ1* represents rs231362. Black circles, P < 0.05; white circles, P > 0.05. A: The relationship between fasting insulin and fasting glucose. MTNR1B showed the highest effect on fasting glucose despite elevated insulin levels. CHCHD2P9 showed increased whereas FADS1 showed decreased fasting insulin. B: The relationship between 2-h insulin and 2-h glucose. GCK, CDKAL1, ZBED3, and MTNR1B all showed high postprandial glucose levels despite elevated insulin levels.
Glucose vs. glucagon levels.
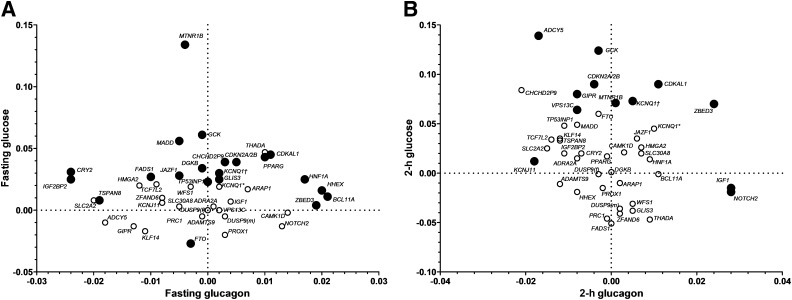
The highest fasting glucose level related to glucagon level was seen for MTNR1B (Fig. 3 and Supplementary Fig. 3), which was also reflected by high fasting and 2-h insulin-to-glucose ratios (Supplementary Table 7 and Supplementary Figs. 4 and 5). In line with previous reports, the TCF7L2 variant showed low glucagon levels (9) and homozygous T-allele carriers showed high fasting and 2-h glucose levels, despite low insulin-to-glucagon ratio.
FIG. 3.
Graphic representation of effects of genetic variants on the relationship between glucose and glucagon levels during OGTT in nondiabetic participants of the PPP-Botnia Study. Effect sizes are betas from linear regression adjusted for age, sex, and BMI. KCNQ1† represents rs2237895, and KCNQ1* represents rs231362. Black circles, P < 0.05; white circles, P > 0.05. A: The relationship between fasting glucagon and fasting glucose. The highest fasting glucose level related to glucagon level was seen for MTNR1B. IGF2BP2 and CRY2 showed reduced glucagon secretion, whereas BCL11A and HHEX were associated with increased fasting glucagon. B: The relationship between 2-h glucagon and 2-h glucose. ZBED3, IGF1, and NOTCH2 showed elevated whereas KCNJ11 showed decreased postprandial glucagon secretion.
Glucagon vs. insulin levels in human pancreatic islets.
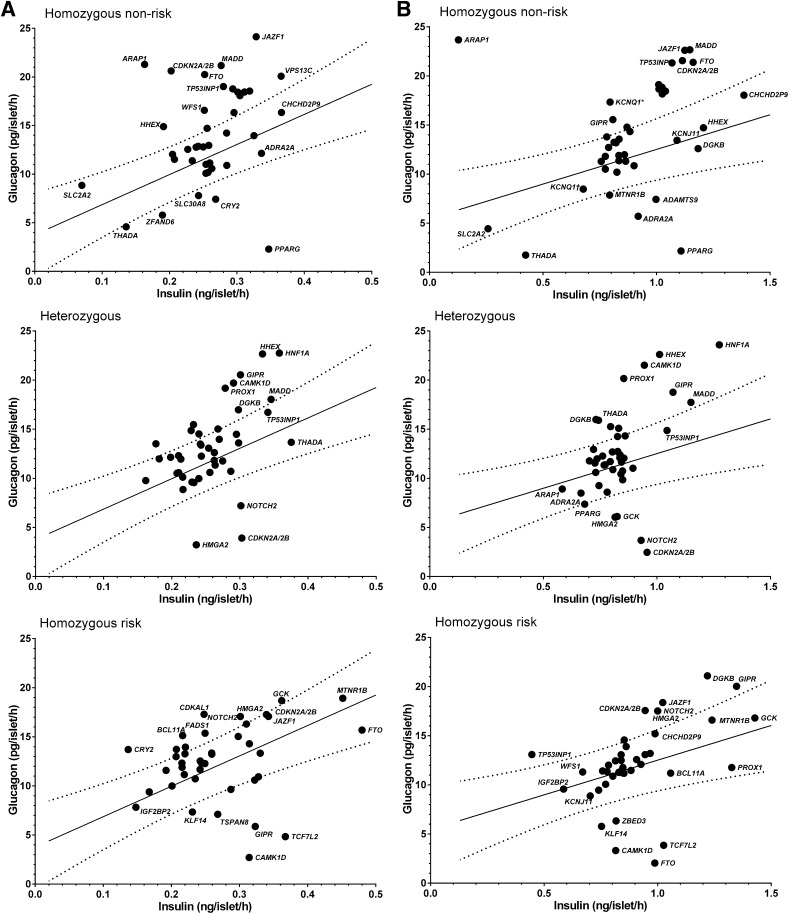
The risk allele carriers of variants in CAMK1D, TCF7L2, GIPR, TSPAN8, and KLF14 showed lower glucagon levels whereas the risk allele carriers of CDKAL1, BCL11A, CRY2, FADS1, NOTCH2, HMGA2 and GCK showed higher glucagon levels than expected from the 95% CI of the relationship between mean values of insulin and glucagon concentrations measured at normal glucose levels. At high glucose, carriers of the risk alleles at DGKB, GIPR, JAZF1, CDKN2A/2B, HMGA2, and NOTCH2 displayed high glucagon levels, whereas those of TCF7L2, CAMK1D, KLF14, FTO, and ZBED3 showed lower glucagon levels (Fig. 4).
FIG. 4.
Relationship between glucagon and insulin secretion in human pancreatic islets at low and high glucose levels. A: Secretion at low glucose (1 mmol/L). The risk allele carriers of variants in CAMK1D, TCF7L2, GIPR, TSPAN8, and KLF14 showed lower glucagon secretion, whereas the risk allele carriers of CDKAL1, BCL11A, CRY2, FADS1, NOTCH2, HMGA2, and GCK showed glucagon levels above the expected 95% CI of the relationship between insulin and glucagon secretion. B: Secretion at high glucose (16.7 mmol/L). The risk allele carriers of DGKB, GIPR, JAZF1, CDKN2A/2B, HMGA2, and NOTCH2 remained high glucagon secretion, whereas those of FTO, CAMK1D, TCF7L2, KLF14, and ZBED3 had low glucagon.
DISCUSSION
In the current study, we demonstrate that the effects of some of the genetic variants associated with type 2 diabetes and/or glycemic traits seem to involve the cross-talk between hormone secretion from the β- and α-cells. The novel findings in the current study included the observed associations of variants in 10 loci with glucagon concentrations, of which 6 loci (HHEX, IGF2BP2, CDKAL1, FADS1, GCK, and CDKN2A/2B) were also associated with reduced insulin secretion.
Effects of variants on the relationship between CIR and ISI were similar to those observed by Grarup et al. (10), but we also showed that MTNR1B and CDKAL1 were clear outliers with strong effects on both impaired insulin secretion and sensitivity. These analyses used β-values that reflect fractions of the SDs. We therefore extended the analyses by analyzing the relationship between the absolute values of CIR and ISI in different genotype carriers, which allowed us to obtain a quantitative effect of SNPs. These analyses differ from those presented by Grarup et al. (10) as we now related the effect of the homozygous risk genotypes to the mean values of a reference population instead of expressing them as allelic changes in fraction of SDs. It can, of course, be questioned whether homozygosity for risk alleles would best describe their effect on this relationship, but it has the advantage that it allows us to show the absolute effects of the variants.
Importantly, we show that many of the genetic variants seem to affect the relationship between insulin/glucagon secretion and blood glucose levels both at fasting and 2 h during OGTT. This would imply that in the risk carriers, reduced early insulin secretion in conjunction with impaired suppression of glucagon secretion and/or action would lead to increased risk of type 2 diabetes. An interesting finding was that, again, MTNR1B was different from the rest of the variants and showed elevated glucose despite high insulin-to-glucagon ratio. There is no obvious explanation for these findings apart from that the ratio between insulin and glucagon may be more important than the individual insulin and glucagon levels for the glucose-raising effect of MTNR1B. Also, MTNR1B is mostly expressed in β-cells, whereas MTNR1A predominates in α-cells. Until now, no variant in the MTNR1A gene has been associated with type 2 diabetes or elevated glucose levels.
In keeping with a previous study (11), the rs7903146 variant in TCF7L2 was associated with lower glucagon values both in vivo and in vitro. In contrast to some previous studies (12,13), we did not observe a significant reduction in fasting or glucose-stimulated insulin secretion for this variant in the current study. The PPP-Botnia Study is a population-based study including people 18–75 years of age, most of whom had normal glucose tolerance. In the previous studies, the effect on insulin secretion was clearly stronger in hyperglycemic individuals or in those who subsequently developed diabetes. The same was seen in the current study; if we restrict the analysis to hyperglycemic individuals (fasting plasma glucose >5.5 mmol/L), we see a clear effect of the TCF7L2 SNP on reduced insulin secretion (n = 1,440; β = −0.109 [0.035]; P = 0.002). This effect might be too small to fully explain the glucose-increasing effect of the SNP, nor is it easy to see an effect of reduced glucagon levels. One possibility is that the TCF7L2 variant has effects on hepatic glucose production as previously shown (13–15), which cannot be explained by effects of glucagon on the liver.
From the figures relating the mean values of fasting and 2-h insulin/glucagon with fasting and 2-h glucose concentrations (Supplementary Fig. 6), it was obvious that homozygous carriers of HMGA2 differed most from the others. Thus, although carriers of two HMGA2 risk alleles showed increased insulin secretion and decreased insulin sensitivity, possibly protecting them from type 2 diabetes, they demonstrated low insulin/glucagon, which in turn led to elevated glucose. In vitro, homozygous risk allele carriers showed a reduced suppressive effect of high glucose on glucagon secretion. HMGA2 encodes for a nonhistone protein with structural DNA-binding domains and may act as a transcriptional regulating factor. The current data suggest that it may involve a complex interplay between islet function and insulin action.
The current study also provides some novel insight for the potential mechanism by which the BCL11A variant could increase the risk of type 2 diabetes. BCL11A rs243021 was originally identified as a risk variant for type 2 diabetes in the DIAGRAM+ meta-analysis (1). The protein encoded by BCL11A is a zinc-finger protein with highest expression in the fetal brain and the adult central nervous system. Although its biological function is not fully elucidated, it might be involved in the signal transduction from cell to cell or in the neuronal regulation of hormonal secretion. Association of variants in BCL11A with reduced insulin secretion has previously been reported (16). Here we report novel associations of a BCL11A variant with increased glucagon levels in vivo. Additionally, in vitro, homozygous risk allele carriers of the BCL11A variant had glucagon levels above the expected 95% CI of the relationship between insulin and glucagon secretion in human pancreatic islets. Together, results from the present paper and previous reports suggest that this variant might predispose to increased risk of type 2 diabetes via reduced insulin and increased glucagon concentrations.
In conclusion, here we provide a comprehensive description of how common genetic variants associated with type 2 diabetes and/or glycemic traits influence insulin and glucagon secretion in vivo and in vitro in human pancreatic islets. The data clearly emphasize the need to consider effects on α-cell function when studying mechanisms by which these variants increase risk of type 2 diabetes.
ACKNOWLEDGMENTS
Studies at Lund University Diabetes Centre were supported by the Swedish Research Council, including a Linné grant (31475113580) and a strategic research grant (EXODIAB, Dnr 2009-1039), the Heart and Lung Foundation, the Swedish Diabetes Research Society, the European Community's Seventh Framework Programme grant (ENGAGE, Health-F4-2007-201413; and CEED3, 223211), the Diabetes Programme at Lund University, the Påhlsson Foundation, the Crafoord Foundation, the Knut and Alice Wallenberg Foundation, the Novo Nordisk Foundation, and the European Foundation for the Study of Diabetes. The PPP-Botnia Study was supported by grants from the Sigrid Juselius Foundation, the Folkhälsan Research Foundation, the Finnish Diabetes Research Society, the Signe and Ane Gyllenberg Foundation, the Swedish Cultural Foundation in Finland, the Ollqvist Foundation, the Ministry of Education of Finland, the Foundation for Life and Health in Finland, the Jakobstad Hospital, the Medical Society of Finland, the Närpes Research Foundation, and the Vasa and Närpes Health Centers. No other potential conflicts of interest relevant to this article were reported.
A.J. participated in genotyping and study design, researched and interpreted the data, and wrote the manuscript. C.L., T.S.A., and J.K. researched the data. U.K., J.T., and E.R. were responsible for mRNA analyses and the insulin and glucagon secretion measurements from the human pancreatic islets. B.I. and T.T. collected and phenotyped the PPP-Botnia Study population. L.G. and V.L. designed and supervised the study, interpreted the data, and contributed to discussion. All coauthors reviewed and approved the final version of the manuscript. L.G. is the guarantor of this work and, as such, had full access to all the data in the study and takes responsibility for the integrity of the data and the accuracy of the data analysis.
Human islets were provided by the Nordic Network for Clinical Islet Transplantation, courtesy of Dr. Olle Korsgren (Uppsala, Sweden). The authors thank the patients for their participation and the Botnia Study Group for clinically studying the patients.
Footnotes
This article contains Supplementary Data online at http://diabetes.diabetesjournals.org/lookup/suppl/doi:10.2337/db12-1627/-/DC1.
REFERENCES
- 1.Voight BF, Scott LJ, Steinthorsdottir V, et al. MAGIC investigators. GIANT Consortium Twelve type 2 diabetes susceptibility loci identified through large-scale association analysis. Nat Genet 2010;42:579–589 [DOI] [PMC free article] [PubMed] [Google Scholar]
- 2.Dupuis J, Langenberg C, Prokopenko I, et al. DIAGRAM Consortium. GIANT Consortium. Global BPgen Consortium. Anders Hamsten on behalf of Procardis Consortium. MAGIC investigators New genetic loci implicated in fasting glucose homeostasis and their impact on type 2 diabetes risk. Nat Genet 2010;42:105–116 [DOI] [PMC free article] [PubMed] [Google Scholar]
- 3.Isomaa B, Forsén B, Lahti K, et al. A family history of diabetes is associated with reduced physical fitness in the Prevalence, Prediction and Prevention of Diabetes (PPP)-Botnia study. Diabetologia 2010;53:1709–1713 [DOI] [PubMed] [Google Scholar]
- 4.Matsuda M, DeFronzo RA. Insulin sensitivity indices obtained from oral glucose tolerance testing: comparison with the euglycemic insulin clamp. Diabetes Care 1999;22:1462–1470 [DOI] [PubMed] [Google Scholar]
- 5.Hanson RL, Pratley RE, Bogardus C, et al. Evaluation of simple indices of insulin sensitivity and insulin secretion for use in epidemiologic studies. Am J Epidemiol 2000;151:190–198 [DOI] [PubMed] [Google Scholar]
- 6.Jonsson A, Isomaa B, Tuomi T, et al. A variant in the KCNQ1 gene predicts future type 2 diabetes and mediates impaired insulin secretion. Diabetes 2009;58:2409–2413 [DOI] [PMC free article] [PubMed] [Google Scholar]
- 7.PLINK. Whole genome association analysis toolset [Internet], 2009. Available from http://pngu.mgh.harvard.edu/~purcell/plink/ Accessed 10 October 2009
- 8.Purcell S, Neale B, Todd-Brown K, et al. PLINK: a tool set for whole-genome association and population-based linkage analyses. Am J Hum Genet 2007;81:559–575 [DOI] [PMC free article] [PubMed] [Google Scholar]
- 9.Alibegovic AC, Sonne MP, Højbjerre L, et al. The T-allele of TCF7L2 rs7903146 associates with a reduced compensation of insulin secretion for insulin resistance induced by 9 days of bed rest. Diabetes 2010;59:836–843 [DOI] [PMC free article] [PubMed] [Google Scholar]
- 10.Grarup N, Sparsø T, Hansen T. Physiologic characterization of type 2 diabetes-related loci. Curr Diab Rep 2010;10:485–497 [DOI] [PMC free article] [PubMed] [Google Scholar]
- 11.Pilgaard K, Jensen CB, Schou JH, et al. The T allele of rs7903146 TCF7L2 is associated with impaired insulinotropic action of incretin hormones, reduced 24 h profiles of plasma insulin and glucagon, and increased hepatic glucose production in young healthy men. Diabetologia 2009;52:1298–1307 [DOI] [PubMed] [Google Scholar]
- 12.Lyssenko V, Jonsson A, Almgren P, et al. Clinical risk factors, DNA variants, and the development of type 2 diabetes. N Engl J Med 2008;359:2220–2232 [DOI] [PubMed] [Google Scholar]
- 13.Lyssenko V, Lupi R, Marchetti P, et al. Mechanisms by which common variants in the TCF7L2 gene increase risk of type 2 diabetes. J Clin Invest 2007;117:2155–2163 [DOI] [PMC free article] [PubMed] [Google Scholar]
- 14.Boj SF, van Es JH, Huch M, et al. Diabetes risk gene and Wnt effector Tcf7l2/TCF4 controls hepatic response to perinatal and adult metabolic demand. Cell 2012;151:1595–1607 [DOI] [PubMed] [Google Scholar]
- 15.Norton L, Fourcaudot M, Abdul-Ghani MA, et al. Chromatin occupancy of transcription factor 7-like 2 (TCF7L2) and its role in hepatic glucose metabolism. Diabetologia 2011;54:3132–3142 [DOI] [PubMed] [Google Scholar]
- 16.Simonis-Bik AM, Nijpels G, van Haeften TW, et al. Gene variants in the novel type 2 diabetes loci CDC123/CAMK1D, THADA, ADAMTS9, BCL11A, and MTNR1B affect different aspects of pancreatic beta-cell function. Diabetes 2010;59:293–301 [DOI] [PMC free article] [PubMed] [Google Scholar]


