Abstract
Podocyte apoptosis is a critical mechanism for excessive loss of urinary albumin that eventuates in kidney fibrosis. Pharmacological doses of the mammalian target of rapamycin (mTOR) inhibitor rapamycin reduce albuminuria in diabetes. We explored the hypothesis that mTOR mediates podocyte injury in diabetes. High glucose (HG) induces apoptosis of podocytes, inhibits AMP-activated protein kinase (AMPK) activation, inactivates tuberin, and activates mTOR. HG also increases the levels of Nox4 and Nox1 and NADPH oxidase activity. Inhibition of mTOR by low-dose rapamycin decreases HG-induced Nox4 and Nox1, NADPH oxidase activity, and podocyte apoptosis. Inhibition of mTOR had no effect on AMPK or tuberin phosphorylation, indicating that mTOR is downstream of these signaling molecules. In isolated glomeruli of OVE26 mice, there is a similar decrease in the activation of AMPK and tuberin and activation of mTOR with increase in Nox4 and NADPH oxidase activity. Inhibition of mTOR by a small dose of rapamycin reduces podocyte apoptosis and attenuates glomerular injury and albuminuria. Our data provide evidence for a novel function of mTOR in Nox4-derived reactive oxygen species generation and podocyte apoptosis that contributes to urinary albumin excretion in type 1 diabetes. Thus, mTOR and/or NADPH oxidase inhibition may represent a therapeutic modality of diabetic kidney disease.
There is increasing evidence that the mammalian target of rapamycin (mTOR) pathway is involved in the pathogenic manifestations of diabetic nephropathy. mTOR phosphorylation is enhanced in the kidney cortex of diabetic rats, and treatment of rats with rather large doses of the mTOR inhibitor rapamycin blocks diabetes-induced glomerular hypertrophy and albuminuria (1–3). The mechanism by which mTOR inhibition reduces albuminuria is unknown. Injury to glomerular epithelial cells or podocytes interferes with the integrity of the glomerular filtration barrier and contributes to albuminuria. In diabetic subjects and in diabetic animals, there is a decrease in podocyte number (4–8).
mTOR, a highly conserved nutrient-responsive regulator of cell growth found in eukaryotes (9), is a serine/threonine protein kinase existing in two complexes, mTORC1 or mTORC2, consisting of distinct sets of protein-binding partners (10,11). mTORC1 is rapamycin sensitive and is thought to mediate many of its downstream effects through p70S6 kinase (p70S6K)/S6 kinase 1 (S6K1) and 4E-binding protein 1 (4E-BP1) (12). mTORC2 is largely rapamycin resistant and mediates phosphorylation of protein kinase B (PKB/Akt) at Ser473 (13). Although both complexes respond to hormones and growth factors, only mTORC1 is activated by nutrients and cellular energy status (12). mTOR activity is negatively regulated by the heterodimeric complex consisting of tuberin (TSC2) and hamartin (TSC1). Phosphorylation of tuberin serves as an integration point for a wide variety of environmental signals that regulate mTORC1 (11). Importantly, phosphorylation of tuberin by AMP-activated protein kinase (AMPK) maintains its tumor-suppressor activity and prevents the activation of mTORC1.
We recently demonstrated that AMPK is inactivated in podocytes exposed to excess glucose and in an experimental model of type 1 diabetes (7,14). A functional link between AMPK and mTORC1 has been reported (15). AMPK is known to directly phosphorylate tuberin on conserved sites such as Thr1271 and Ser1387, thereby maintaining the tuberin/hamartin complex active to prevent the activation of mTORC1 (16,17). We postulated that the activation of mTOR in type 1 diabetes reduces podocyte survival, providing a potential mechanism by which mTOR inhibition reduces albuminuria.
In this study, we provide evidence that type 1 diabetes, or high glucose (HG)–induced podocyte apoptosis, is mediated by activation of the mTOR pathway through inactivation of AMPK/tuberin. We further demonstrate that in type 1 diabetes, the activation of mTOR enhances oxidative stress via upregulation of Nox4 and Nox1 expression and NADPH oxidase activity. Inhibition of the mTOR pathway by clinically relevant doses of rapamycin reverses the observed changes. Furthermore, we show that inhibition of mTOR decreases podocyte apoptosis, reduces glomerular basement membrane thickening (GBM) and foot process effacement, and attenuates mesangial expansion and albuminuria.
RESEARCH DESIGN AND METHODS
Podocyte culture and transfection.
Conditionally immortalized mouse podocytes, provided by Dr. Katalin Susztack (Albert Einstein College of Medicine, Bronx, NY), were cultured, as previously described (7,8), in 5 mmol/L normal glucose (NG) or treated with 25 mmol/L glucose (HG) for 48 h in the presence or absence of 10 nm rapamycin or in the presence or absence of 1 mmol/L aminoimidazole-4-carboxamide-1-riboside (AICAR). For the RNA interference experiments, a SMARTpool consisting of small interfering RNA (siRNA) duplexes specific for mouse mTOR were obtained from Dharmacon. siRNA (100 nmol/L) was introduced into the cells by double transfection using Oligofectamine or Lipofectamine 2000, as previously described (18). Scrambled siRNAs (nontargeting siRNA, Scr; 100 nmol/L) served as controls. In additional experiments, podocytes were transfected with 1.0 μg of a vector expressing wild-type mTOR or a control vector using Gene Juice 2000. After transfection, cells were incubated in serum-free medium containing 0.2% BSA in NG or HG for 48 h in the absence or presence of 1 mmol/L AICAR.
Detection of intracellular reactive oxygen species.
The peroxide-sensitive fluorescent probe 2',7'-dichlorodihydrofluorescin diacetate (DCF; Molecular Probes) was used to assess the generation of intracellular reactive oxygen species (ROS), as previously described (8).
Animal models.
The study used 22-week-old control FVB and OVE26 mice (The Jackson Laboratory, Bar Harbor, ME). The University of Texas Health Science Center at San Antonio Institutional Animal Care and Use Committee approved all animal procedures. The 17-week-old mice were divided into four groups: I, control FVB mice; II, OVE26 mice; III, OVE26 mice treated for 5 weeks with rapamycin at 0.5 mg/kg/body weight administrated three times a week by intraperitoneal injection; and group IV, OVE26 mice treated intraperitoneally with AICAR at 750 mg/kg/day (7). Before and after the treatment with rapamycin or AICAR, mice were placed in metabolic cages for urine collection. Albuminuria was measured by a Mouse Albumin ELISA Quantification kit (Bethyl Laboratories, Montgomery, TX) and expressed as micrograms of albumin per 24 h.
Animals were killed by exsanguination under anesthesia. Both kidneys were removed, decapsulated, and weighed. A slice of the kidney cortex at the pole was embedded in paraffin or flash-frozen in liquid nitrogen for microscopy and image analyses. Cortical tissue was used for isolation of glomeruli by differential sieving, as described previously (7,8,19).
NADPH oxidase activity.
NADPH oxidase activity was measured in podocytes grown in serum-free medium or in glomeruli isolated from kidney cortex as previously described (7,8). Superoxide production was expressed as RLU/mg protein. Protein content was measured using the Bio-Rad protein assay reagent.
AMPK activity assay.
AMPK activity was measured using AMPK KinEASE FP Fluorescein Green Assay Fluorescence Polarization according to the manufacturer’s protocol (Millipore) (7).
Western blotting analysis.
Homogenates from glomeruli isolated from renal cortex and lysates from cultured mouse podocytes were prepared as previously described (7,8). All primary antibodies were from Cell Signaling (Danvers, MA), except for the rabbit polyclonal anti-Nox4, which was from Novus Biological (Littleton, CO). Densitometric analysis was performed using NIH ImageJ software.
mRNA analysis.
mRNA was analyzed by real-time RT-PCR using the ∆∆Ct method. Total RNA was isolated using the RNeasy Mini kit from Qiagen. mRNA levels were quantified using the Realplex Mastercycler (Eppendorf, Westbury, NY) with SYBR green and predesigned mouse RT quantitative PCR primers (SABiosciences, Frederick, MD) for Nox4 (RefSeq ID NM_015760) and normalized to β-actin (RefSeq ID NM_007393).
Immunohistochemistry.
Localization of cellular Nox4 was assessed by immunoperoxidase histochemistry using polyclonal Nox4 antibodies (Novus Biological).
Morphometric analysis.
For morphometric analysis, cortical sections were stained with periodic acid Schiff, and the increase in mesangial matrix was measured.
Apoptosis assays.
Assays for annexin V and propidium iodide staining, caspase 3 activity, cellular DNA fragmentation, and Hoechst staining were used according to the manufacturer protocols and as described previously (7,8).
Electron microscopy.
For electron microscopy photomicrographs, kidney cortex was prepared and analyzed as we and others have previously described (7,8,20–24).
Podocyte enumeration.
Dual-label immunohistochemistry was used to identify and count glomerular epithelial cells relative to the GBM using a modification of methods previously described (25–27) and as we recently described (7,8).
TUNEL assay.
TUNEL staining using the TUNEL Apoptosis Detection Kit (Upstate) was performed according to the manufacturer’s instructions. The number of TUNEL-positive cells was counted in 25 randomly selected glomeruli (original magnification ×400) for each animal. Five animals were studied per group.
Statistical analysis.
Results are expressed as mean ± SE. Statistical significance was assessed by the Student unpaired t test. Significance was determined as P < 0.05.
RESULTS
HG induces podocyte apoptosis through an mTOR-dependent mechanism.
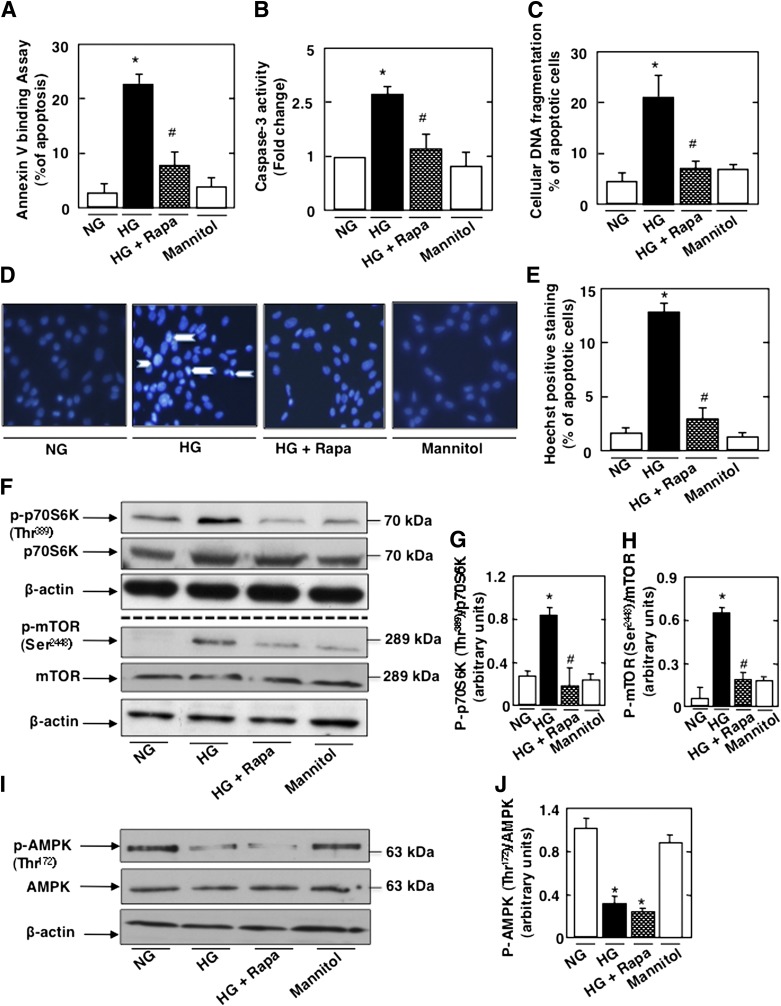
Mouse podocytes were exposed to HG or NG for 48 h in the absence or presence of rapamycin. Mannitol was used as an osmotic control. Exposure of podocytes to HG significantly increased apoptosis assessed by annexin V binding, caspase 3 activation, cellular DNA fragmentation, and Hoechst staining (Fig. 1A–E). This was associated with activation of mTOR, as determined by the phosphorylation of S6K on Thr389 (Fig. 1F and G). Phosphorylation of mTORSer2448, an S6K phosphorylation site, was also increased (28,29) (Fig. 1F and H). Treatment with rapamycin inhibited HG-induced podocyte apoptosis and decreased p70S6K and mTOR phosphorylation (Figs. 1A–H). As expected, HG decreased AMPK phosphorylation on its activating site Thr172, and rapamycin treatment did not influence the effect of HG on AMPK phosphorylation (Fig. 1I and J). In all experiments, equimolar concentration of mannitol had no effect (Fig. 1A–J). In parallel experiments, podocytes were transfected with SMARTpool of simTOR or with nontargeting siRNA (Scr) before exposure to HG. simTOR transfection had effects similar to those of rapamycin on the cultured podocytes (Supplementary Fig. 1A–J). Collectively, these results indicate that mTOR activation by HG mediates podocyte apoptosis and suggest that mTOR acts downstream of AMPK.
FIG. 1.
HG induces podocyte apoptosis through activation of mTOR. Mouse podocytes were serum deprived overnight and pretreated with rapamycin (Rapa) (10 nmol/L) for 1 h before incubation with HG for 48 h. Mannitol was used as osmotic control. Rapamycin treatment inhibits HG-induced apoptosis as measured by annexin V binding (A), caspase 3 activity (B), cellular DNA fragmentation (C), and Hoechst staining (D). E: Quantification of Hoechst-positive cells (% of apoptosis) from four different experiments. Rapamycin treatment also inhibited the mTOR/S6K pathway. F: Representative Western blot of p-p70S6KThr389, p70S6K, p-mTORSer2448, mTOR, and β-actin levels. G: Histograms showing quantitation of p-p70S6KThr389/p70S6K results from four different experiments. H: Histograms showing quantitation of p-mTORSer2448/mTOR results from four different experiments. I: Representative Western blot of p-AMPKThr172 and AMPK levels. J: Histograms showing quantitation of p-AMPKThr172/AMPK results from four different experiments. All values are the mean ± SE from four independent experiments. *P < 0.05 vs. control; #P < 0.05 vs. HG.
HG regulates mTOR through AMPK to induce podocyte apoptosis.
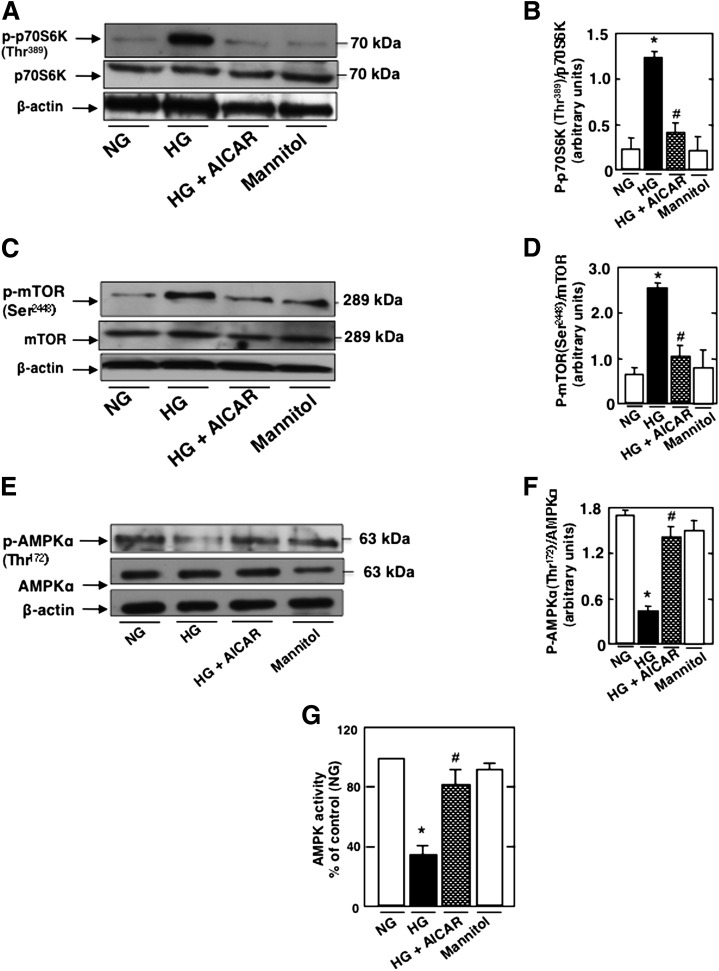
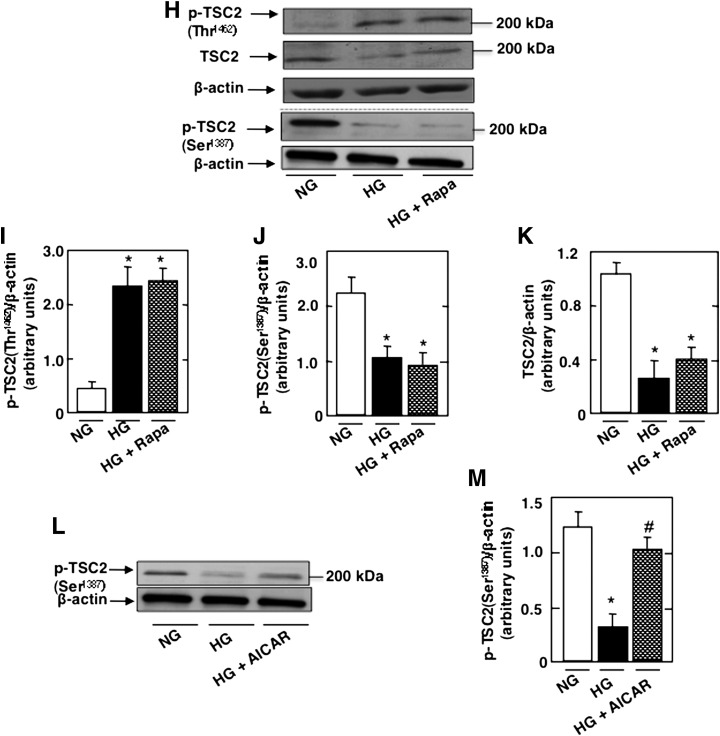
We have recently shown a role of AMPK in podocyte apoptosis (7). Because rapamycin prevents HG-induced podocyte apoptosis, we studied the role of AMPK in the regulation of HG-induced mTOR/p70S6K activation. Podocytes were exposed to HG in the absence or presence of AICAR. Treatment with AICAR prevents HG-increased p70S6K (Fig. 2A and B) and mTOR phosphorylation (Fig. 2C and D) and restores AMPKThr172 phosphorylation (Fig. 2E and F) and AMPK activity (Fig. 2G). In all experiments, an equimolar concentration of mannitol had no effect on the cultured cells (Fig. 2A–G). These data indicate that HG regulates the activation of mTOR/p70S6K at least partially through AMPK. In support of this, we found that HG increased phosphorylation of tuberin, the negative regulator of mTOR, on its inactivating site Thr1462 (Fig. 2H and I), whereas the phosphorylation on the AMPK-dependent activating site Ser1387 was decreased (Fig. 2H and J). Note that rapamycin had no effect on tuberin phosphorylation in cells exposed to HG (Fig. 2H–K), confirming that mTOR is downstream of tuberin. AICAR treatment prevents the HG-induced decrease in TSC2Ser1387 phosphorylation (Figs. 2L–M). However, treatment with the AMPK inhibitor ARA in NG reduced TSC2Ser1387 phosphorylation, mimicking the effect of HG (Supplementary Fig. 2A and B). These data indicate that the effect of HG to inhibit tuberin is at least partially due to AMPK inactivation.
FIG. 2.
HG regulates mTOR through AMPK to induce podocyte apoptosis. Podocytes were exposed to 25 mmol/L glucose (HG) with or without AICAR (1 mmol/L) for 48 h. In parallel experiments, podocytes were exposed to HG with or without rapamycin (Rapa) (10 nmol/L) for 48 h. Mannitol was used as osmotic control. A: Representative Western blot of p-p70S6KThr389, p70S6K, and β-actin levels. B: Histograms showing quantitation of p-p70S6KThr389/p70S6K results from four different experiments. C: Representative Western blot of p-mTORSer2448, mTOR, and β-actin levels. D: Histograms showing quantitation of p-mTORSer2448/mTOR results from four different experiments. E: Representative Western blot of p-AMPKThr172, AMPK, and β-actin levels. F: Histograms showing quantitation of p-AMPKThr172/AMPK results from four different experiments. G: Histograms representing AMPK activity measured in podocytes treated with HG in the presence or absence of AICAR. H: Representative Western blot of p-TSC2Thr1462, p-TSC2Ser1387, TSC2, and β-actin levels. Histograms showing quantitation of p-TSC2Thr1462/TSC2 (I), p-TSC2Ser1387/TSC2 (J), and TSC2/β-actin (K) (n = 4). L: Representative Western blot of p-TSC2Ser1387and β-actin levels. M: Histograms showing quantitation of p-TSC2Ser1387/β-actin (n = 4). All values are the mean ± SE from four independent experiments. *P < 0.05 vs. control; #P < 0.05 vs. HG.
mTOR regulates HG-induced ROS production, NADPH oxidase activity, Nox4 mRNA, and protein levels.
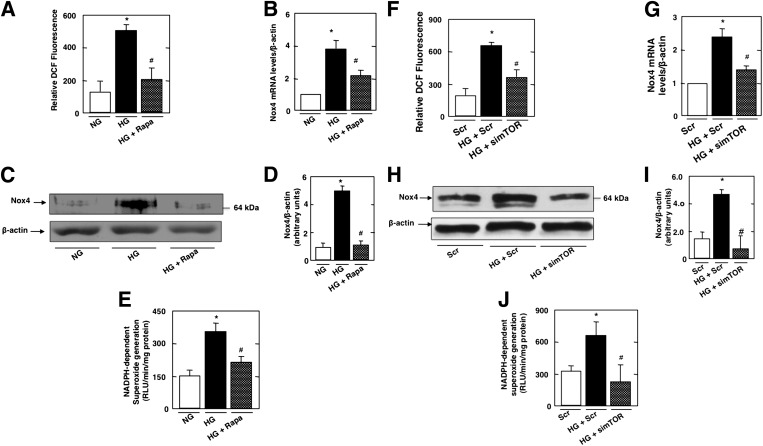
To determine if mTOR regulates ROS production and NADPH oxidase Nox4, mouse podocytes were incubated with HG in the absence or presence of rapamycin. Treatment with rapamycin prevented HG-induced ROS production (Fig. 3A) and Nox4 mRNA (Fig. 3B) and protein expression (Fig. 3C and D) and significantly blocked HG-induced NADPH oxidase activity (Fig. 3E). In parallel experiments, podocytes were transfected with SMARTpool simTOR or with Scr control siRNAs before the cells were exposed to HG. The use of simTOR had an effect similar to that of rapamycin on cultured podocytes (Fig. 3F–J). These data demonstrate that HG induced an increase in ROS production, Nox4 protein, and mRNA levels and that NADPH oxidase activation is mediated, at least partially, through an mTOR-dependent mechanism. We previously found that in cultured mouse podocytes, HG-induced Nox1 and Nox4 protein expression but had no effect on Nox2 protein (8). Our results show that rapamycin treatment inhibited HG-induced Nox1 protein upregulation (Supplementary Fig. 3A–D).
FIG. 3.
mTOR regulates HG-induced ROS production, Nox4 mRNA and protein levels, and NADPH oxidase activity. Mouse podocytes were serum deprived overnight and pretreated with rapamycin (Rapa) (10 nmol/L) for 1 h before incubation with HG for 48 h. A: ROS generation measured by DCF with a multiwell fluorescence plate reader. B: Relative mRNA levels of Nox4 in control and treated podocytes. C: Representative Western blots of Nox4 and β-actin levels. D: Histograms showing quantitation of Nox4/β-actin from four different experiments. E: NADPH-dependent superoxide generation. In parallel experiments, mouse podocytes incubated in NG or HG were transfected with nontargeting siRNA (Scr) or with SMARTpool of siRNA targeting mTOR (simTOR). F: ROS generation measured by DCF with a multiwell fluorescence plate reader. G: Relative mRNA levels of Nox4 in control and treated podocytes. H: Representative Western blot of Nox4 and β-actin levels. I: Histograms showing quantitation of Nox4/β-actin from four different experiments. J: NADPH-dependent superoxide generation. All values are the mean ± SE from four independent experiments. *P < 0.05 vs. control; #P < 0.05 vs. HG.
In parallel experiments, and to test whether AMPK and mTOR fall in a linear signaling pathway, podocytes were transfected with constitutively active mTOR expression vector. The transfected cells were incubated with HG in the presence of AICAR. As expected, AICAR prevented the stimulatory effect of HG on mTOR activity and Nox4 expression (Supplementary Fig. 2). Interestingly, expression of constitutively active mTOR blocked the AICAR-induced downregulation of Nox4 (Supplementary Fig. 4). These results demonstrate that inactivation of AMPK induces Nox4 expression by activation of mTOR.
mTOR/p70S6K pathway is activated in glomeruli in type 1 diabetes.
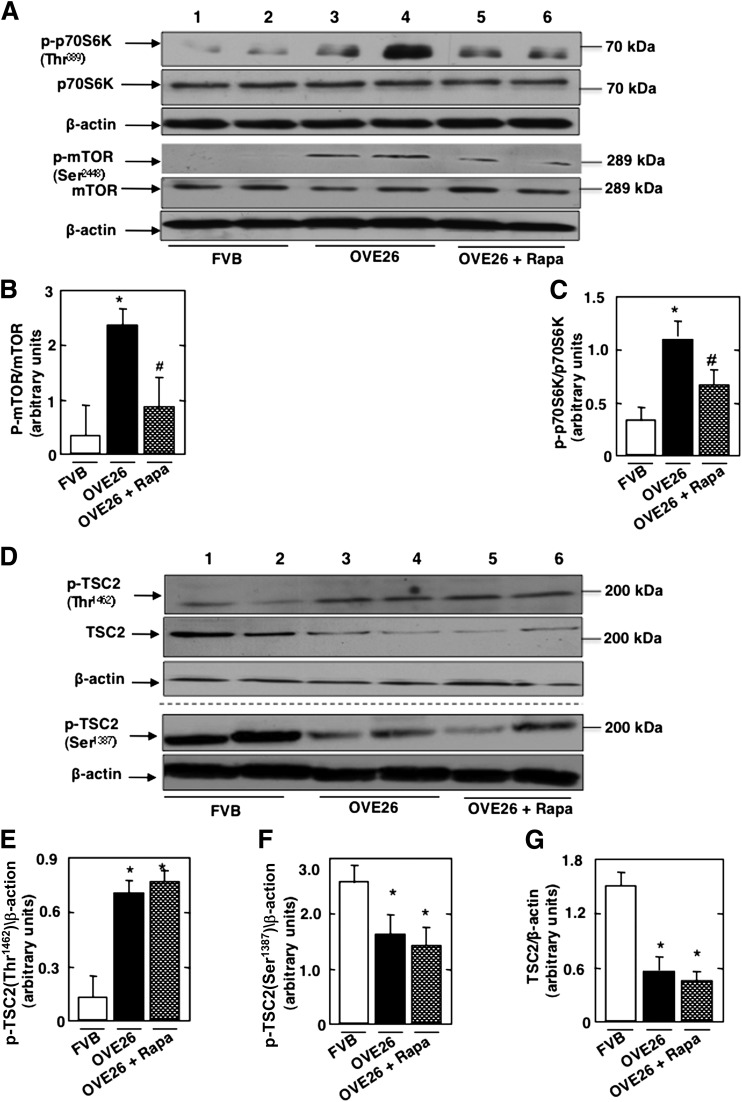
The effect of mTOR blockade by rapamycin was investigated in a mouse model of type 1 diabetes. OVE26 mice were treated with low and clinically relevant doses of rapamycin (0.5 mg/kg body weight three times a week for 5 weeks). Control FVB mice were treated with vehicle. OVE26 mice have elevated blood glucose levels compared with FVB mice and were not affected by rapamycin treatment (Table 1). Body weight was significantly reduced in the OVE26 mice and in the OVE26 mice treated with rapamycin compared with FVB littermates. Total kidney weight and kidney-to-body weight ratio, indices of renal hypertrophy, increased significantly in OVE26 mice compared with control FVB mice. Kidney size in OVE26 mice treated with rapamycin was significantly reduced compared with nontreated OVE26 mice (Table 1). Urine flow rate (UFR) was increased in OVE26 mice compared with FVB mice, and rapamycin treatment had no effect on UFR (Table 1). In isolated glomeruli, phosphorylated (p)-p70S6KThr389 was increased in OVE26 compared with FVB (Fig. 4A and B), indicating activation of mTOR kinase; this is accompanied by an increase in mTOR phosphorylation on Ser2448 (Fig. 4A and C). Tuberin phosphorylation on the inactivating site Thr1462 was also increased in the glomeruli of the OVE26 mice compared with their FVB littermates but was decreased on the activating site Ser1387, and this was paralleled by a decrease in tuberin expression (Figs. 4D–G). Rapamycin treatment decreased the phosphorylation of p70S6KThr389 (Fig. 4A and B) and mTORSer2448 (Fig. 4A and C) but had no effect on the phosphorylation of TSC2Thr1462 and TSC2Ser1387 or on tuberin expression (Fig. 4D–G).
TABLE 1.
Glucose level, body weight, kidney weight, kidney weight–to–body weight ratio, and UFR of FVB control mice, OVE26 type 1 diabetic mice, and OVE26 mice treated with rapamycin

FIG. 4.
mTOR/p70S6K is activated in type 1 diabetes. OVE26 mice (17 weeks old) were treated with rapamycin (Rapa) (0.5 mg/kg body weight) for 5 weeks (3 times/week). Mice in the control group received saline vehicle. Glomeruli were isolated from the kidneys of three groups of mice (n = 5): FVB control mice, OVE26 mice, and OVE26 mice treated with rapamycin. A: Representative Western blot of p-p70S6KThr389, p70S6K, p-mTORSer2448, mTOR, and β-actin levels. Histograms showing quantitation of results for p-mTOR/mTOR (B) and p-p70S6K/p70S6K (C) from five mice. D: Representative Western blot of p-TSC2Thr1462, p-TSC2Ser1387, TSC2, and β-actin levels. Histograms showing quantitation of results from p-TSC2Thr1462/β-actin (E), p-TSC2Ser1387/β-actin (F), and TSC2/β-actin (G) in five mice. Values are the means ± SE from five animals for each group. *P < 0.05 OVE26 mice vs. FVB mice; #P < 0.05 rapamycin-treated OVE26 mice vs. vehicle-treated OVE26 mice.
Decrease in the phosphorylation and activation of AMPK inactivates TSC2, activates the mTOR/S6K pathway, and leads to podocyte injury in type 1 diabetes.
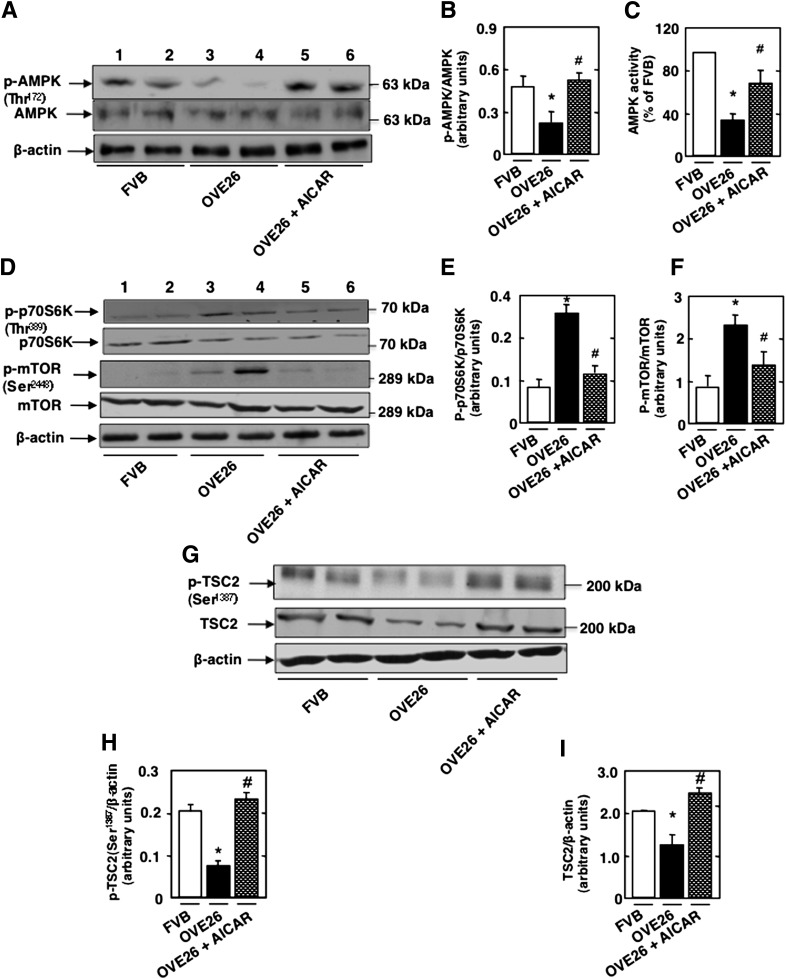
To determine if the mTOR/p70S6K pathway is downstream of AMPK, OVE26 mice were treated with AICAR for 5 weeks. Isolated glomeruli from OVE26 mice exhibited a decrease in AMPKThr172 phosphorylation and AMPK activity (Fig. 5A–C), and these effects were reversed in AICAR-treated animals (Fig. 5A–C). In addition, treatment with AICAR decreased diabetes-induced phosphorylation of p70S6KThr389 and mTORSer2448 (Fig. 5D–F). These results indicate that AMPK inactivation by the diabetic environment is associated with activation of the mTOR/p70S6K pathway in glomeruli.
FIG. 5.
Decrease in the phosphorylation and activation of AMPK inactivates TSC2 and activates the mTOR/S6K pathway and leads to podocyte injury in type 1 diabetes. OVE26 mice (17 weeks old) were treated with AICAR (750 mg/kg/day, dissolved in saline, i.p.) for 5 weeks. Mice in the control group received saline vehicle. Glomeruli were isolated from the kidneys of three groups of mice (n = 5): FVB control mice, OVE26 mice, and OVE26 mice treated with AICAR. A: Representative Western blot of p-AMPKαThr172 and total AMPKα from isolated glomeruli of control FVB mice, OVE26 mice, and OVE26 mice treated with AICAR. B: Histograms showing quantitation of results from 5 mice. C: Histograms showing AMPK activity. D: Representative Western blot of p-p70S6KThr389, p70S6K, p-mTORSer2448, and mTOR. Histograms showing quantitation of results for p-p70S6K/p70S6K (E) and p-mTOR/mTOR (F) from five mice. G: Representative Western blot of p-TSC2Ser1387, TSC2, and β-actin levels. Histograms showing quantitation of results for p-TSC2Ser1387/β-actin (H) and TSC2/β-actin (I) from five mice. All values are the means ± SE from five animals for each group. *P < 0.05 OVE26 mice vs. FVB mice; #P < 0.05 AICAR-treated OVE26 mice vs. vehicle-treated OVE26 mice.
Importantly, we also show that AMPK inactivation in glomeruli of OVE26 mice is associated with a decrease in TSC2Ser1387 phosphorylation and downregulation of tuberin protein levels and that these effects are reversed by AICAR (Fig. 5G and H). Our data suggest that inactivation of tuberin is linked to AMPK inhibition in diabetes. Note that rapamycin treatment had no effect on tuberin phosphorylation (Fig. 4), unlike treatment with AICAR, thereby confirming that mTOR is downstream of AMPK/tuberin.
mTOR/S6 kinase activation upregulates Nox4 and enhances NADPH oxidase activity in type 1 diabetes.
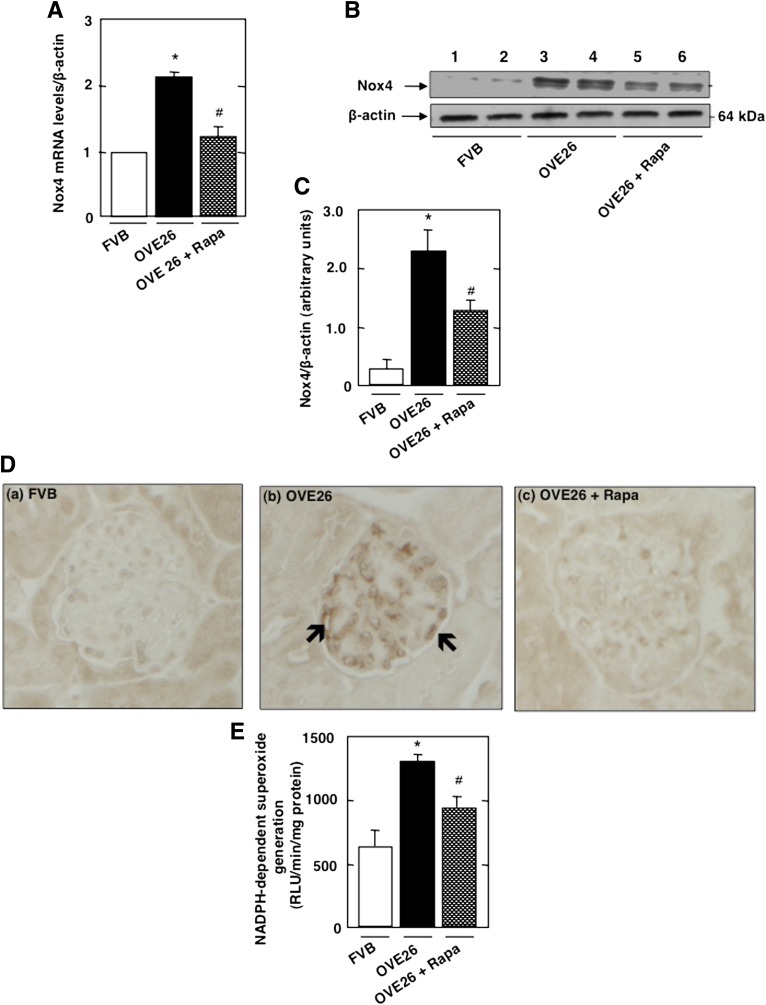
We examined the relationship between Nox4 and mTOR pathway in vivo. As expected, levels of Nox4 mRNA and proteins assessed by Western blotting and immunoperoxidase staining were increased in glomeruli of OVE26 mice, with prominent increase shown in glomerular epithelial cells, an effect inhibited by rapamycin treatment (Fig. 6A–D, black arrow, and Fig. 6E).
FIG. 6.
mTOR/S6 kinase activation upregulates Nox4 and enhances NADPH oxidase activity in type 1 diabetes. OVE26 mice (17 weeks old) were treated with rapamycin (Rapa) (0.5 mg/kg body weight) for 5 weeks (3 times/week). Mice in the control group received saline vehicle. Glomeruli were isolated from the kidneys of FVB control mice, OVE26 mice, and OVE26 mice treated with rapamycin (n = 5 mice/group). A: Relative mRNA levels of Nox4 in control FVB, OVE26, and OVE26 mice treated with rapamycin. B: Representative Western blot of Nox4 and β-actin levels. C: Histograms showing Nox4/β-actin quantitation of results from five mice. D: Nox4 expression and localization were detected by immunoperoxidase staining of kidney sections from control FVB (a), OVE26 (b), and OVE26 (c) mice treated with rapamycin. E: NADPH-dependent superoxide generation. All values are the means ± SE from five animals for each group. *P < 0.05, OVE26 mice vs. FVB mice; #P < 0.05, rapamycin-treated OVE26 mice vs. vehicle-treated OVE26 mice.
mTOR regulates GBM thickening, foot process effacement, podocyte loss, mesangial expansion, and albuminuria.
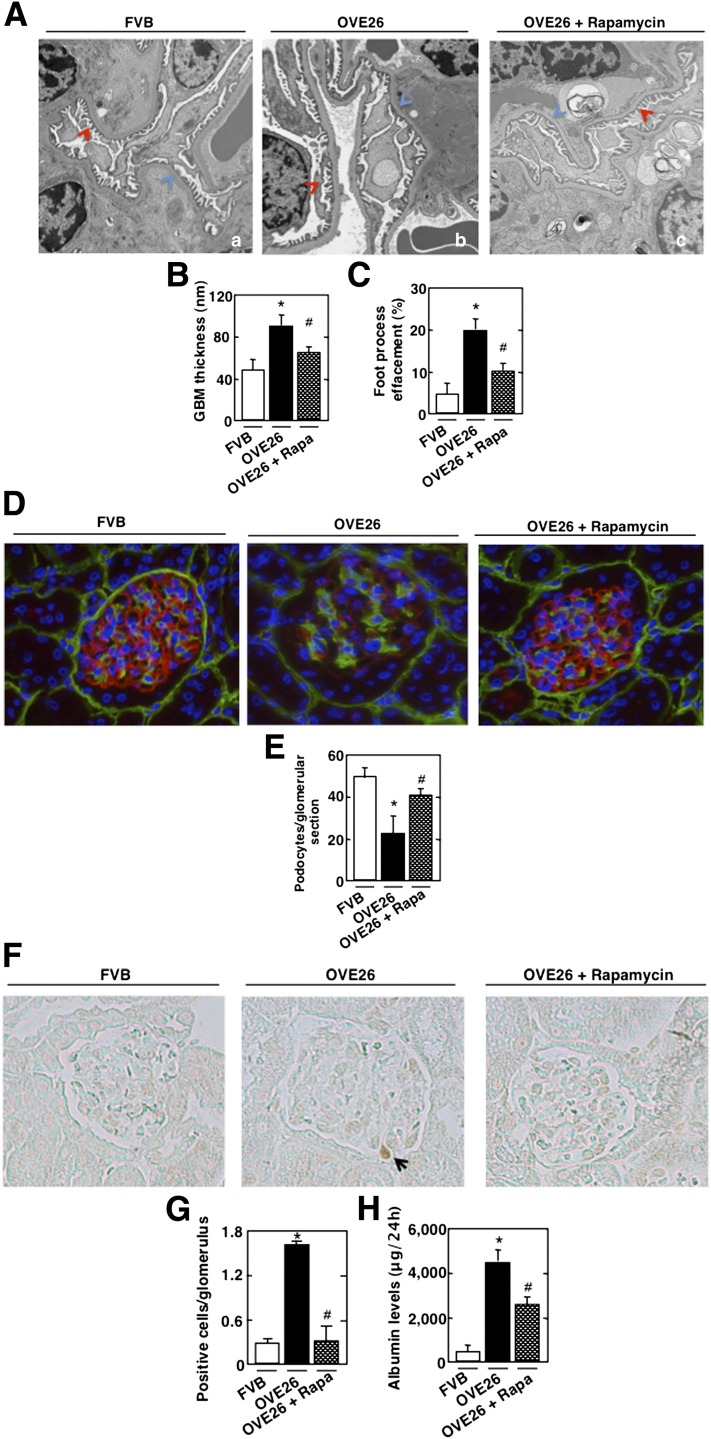
Electron microscopic analysis revealed a significant increase in GBM thickening in the OVE26 mice compared with FVB littermates (Fig. 7A, blue arrow, and Fig. 7B). Marked effacement of foot processes was also evident in the diabetic mice (Fig. 7A, red arrow, and Fig. 7C). OVE26 diabetic mice lose podocytes, as judged by the number of synaptopodin-positive cells (Fig. 7D and E) and TUNEL-positive cells in the glomeruli (Fig. 7F and G). They also show an increase in matrix expansion (Supplementary Fig. 5A and B). Importantly, rapamycin treatment results in a significant reversal of these glomerular changes (Fig. 7A–G and Supplementary Fig. 5A and B) and decreases albuminuria (Fig. 7H). Collectively, our in vivo studies demonstrate that in type 1 diabetic mice, mTOR/p70S6K activation is regulated through an AMPK/tuberin pathway. Activation of mTOR/p70S6K contributes to the enhanced Nox4 expression and NADPH oxidase activity and plays a critical role in glomerular cell injury and albuminuria.
FIG. 7.
mTOR regulates GBM thickening, foot process effacement, podocyte loss/apoptosis, and albuminuria in type 1 diabetic mice. OVE26 mice (17 weeks old) were treated with rapamycin (Rapa) (0.5 mg/kg body weight) 3 times/week for 5 weeks. Mice in the control group received saline vehicle. Glomeruli were isolated from the kidneys of FVB control mice, OVE26 mice, and OVE26 mice treated with rapamycin (n = 5 mice/group). A: Representative transmission electron photomicrographs of glomerular cross-section of FVB, OVE26, and OVE26 mice treated with rapamycin. The images show foot process effacement (panel b, red arrow) and GBM (panel b, blue arrow) of an OVE26 mouse. This effect was not seen in the OVE26 mice treated with rapamycin (panel c). Histograms representing thickness of the GBM measured in nmol/L (B) and semi-quantitative analysis of foot process effacement of glomeruli (C) from each group of animals. D: Representative immunofluorescence images of glomeruli stained with collagen IV (green), synaptopodin (red), and 4′,6-diamidino-2-phenylindole (blue). E: Histogram representing podocyte number per glomerular section. Kidney sections of FVB, OVE26, and OVE26 mice treated with rapamycin stained by TUNEL (F) and total number of TUNEL-positive cells (G). H: FVB, OVE26, and OVE 26 mice treated with rapamycin were placed in metabolic cages for 24 h, urine was collected, and albumin levels were measured. Values are the means ± SE. *P < 0.05 OVE26 mice vs. control FVB mice; #P < 0.05 decrease in albumin levels in rapamycin-pretreated OVE26 mice vs. nontreated OVE26 mice (n = 5 per group).
DISCUSSION
Albuminuria is a major risk factor for glomerulosclerosis and progressive renal fibrosis. The mechanisms of albuminuria in diabetes are incompletely characterized. There is strong evidence that podocyte injury, including apoptosis, contributes to albuminuria and progressive glomerulosclerosis (6–8). In this study, we provide evidence that apoptosis of podocytes is at least partially mediated through inactivation of AMPK and tuberin, activation of mTOR, upregulation of Nox4, and enhanced NADPH oxidase-mediated ROS generation. We also show that this proapoptotic pathway is operative in glomeruli of diabetic mice. Inhibition of mTOR in the diabetic mice by the administration of a rather low and clinically relevant dose of rapamycin attenuates Nox4 expression, reduces mesangial expansion, foot process effacement, GBM thickening, podocyte apoptosis/loss, and albuminuria.
mTOR elicits a number of biological responses (10,11), and its activity is tightly controlled by tuberin, the tumor suppressor that acts as a repressor of mTORC1. In the kidney cortex of diabetic animals, the mTORC1/p70S6K pathway is activated, whereas tuberin is inactivated, contributing to cytokine expression and matrix accumulation (1,2,30–34). Furthermore, podocyte-specific mTORC1 activation induced by ablation of an upstream negative regulator hamartin (TSC1) recapitulated many diabetic nephropathy features, including podocyte loss, GBM thickening, mesangial expansion, and proteinuria in nondiabetic young and adult mice (35,36). However, the role of the tuberin/mTOR pathway and their crosstalk with ROS production through NADPH oxidases in podocyte biology has not been explored. In this study, we demonstrate that HG is associated with enhanced phosphorylation/activation of mTOR and its downstream effector p70S6K and podocyte apoptosis. Our finding that a low and clinically relevant dose of rapamycin inhibits HG and hyperglycemia-induced podocyte apoptosis/loss and glomerular injury implicates mTOR in the podocyte injury. Mesangial cell injury and mesangial matrix expansion may result from podocyte injury or direct activation of mTOR in mesangial cells.
This study also examined the potential mechanism by which glucose enhances the phosphorylation and activation of mTOR in podocytes. We have demonstrated that excess glucose in vitro and hyperglycemia in vivo result in the inactivation of the nutrient sensor AMPK (14). AMPK is known to maintain the tumor-suppressor effect of tuberin and to prevent mTORC1 activation (16,37). We show that HG inactivates AMPK in podocytes and is associated with tuberin inactivation and mTORC1/p70S6K activation. Importantly, these events correlate with podocyte injury in vitro and in glomeruli in diabetes. The data in the isolated glomeruli of OVE26 mice support the observation in the cultured cells and demonstrate that the activation of AMPK by AICAR maintains the tumor-suppressor activity of tuberin and suppresses mTOR activation. We have previously shown that AICAR inhibits podocyte apoptosis in vitro and glomerular injury and podocyte loss/apoptosis and reduces albuminuria in OVE26 mice without affecting hyperglycemia (7). Under normal conditions, AMPK maintains the function of tuberin via its phosphorylation on specific sites to prevent the activation of downstream effectors, mTORC1/p70S6K, thereby maintaining podocyte survival. In diabetes or in an HG environment, the inactivation of AMPK results in impaired tuberin function and mTORC1 activation.
Recent studies have demonstrated that large doses of rapamycin may have beneficial effects on the progression of diabetic nephropathy in rodent models of type 1 and type 2 diabetes (1,2,30–33). Rapamycin administration reduces whole kidney and glomerular hypertrophy in animal models of type 1 and type 2 diabetes at early stages of the disease. In addition, the enhanced mRNA expression of transforming growth factor-β1 and connective tissue growth factor is also reduced by rapamycin treatment in the kidney cortex (1,31,33). It is important to note that the doses of rapamycin used in these studies far exceeded the doses used in the present work. The daily doses of rapamycin used in those studies ranged from 1.0 to 10 mg/kg body weight. Because of the long half-life of rapamycin, we administered the drug only three times a week at a dose of 0.5 mg/kg body weight. These considerations are critical for potential clinical translation of our studies.
Oxidative stress and, in particular, ROS produced by the NAD(P)H oxidases of the Nox family are critical for the pathogenesis of diabetic kidney disease (7,8,38,39). We have previously demonstrated that ROS generated by the isoform Nox4 play a key role in diabetes-induced podocyte injury (7,8). Impairment of Nox4 function using knockdown strategy in a diabetic milieu reduces HG-induced podocyte apoptosis through a p53-dependent pathway (7). Moreover, our previous work revealed a protective effect of AMPK activators against podocyte injury in diabetes via downregulation of Nox4 expression and inhibition of ROS production (7). In the current study, we established for the first time that mTOR is also positioned upstream of Nox4 and positively regulates the oxidase at both the mRNA and protein levels.
Furthermore, we extend our understanding of the protective effect of AMPK by providing the first evidence that the kinase exerts its effect on Nox4 through phosphorylation of tuberin on the activating site Ser1387, thereby maintaining mTORC1 activity in check. In the presence of HG, the inhibition of AMPK and the inactivation of tuberin result in an mTORC1-mediated increase in Nox4 as well as apoptosis. To the best of our knowledge, this is the first demonstration of a functional link among AMPK, tuberin/mTORC1, and Nox4. Interestingly, there is evidence that NAD(P)H oxidase and/or ROS may also act upstream of tuberin/mTORC1 (34,40,41), suggesting that ROS generated by mTOR-induced Nox4 may target tuberin via a feedback loop. Our data also point toward a role for Nox4 as the final proapoptotic executioner in this pathway, with AMPK and tuberin/mTORC1 as the most downstream cellular safeguards.
Tuberin-deficient cells derived from TSC tumors have increased mTOR activity and are sensitive to apoptosis (42). Furthermore, AMPK-mediated phosphorylation of tuberin at Thr1271 or Ser1387 protects cells from starvation-mediated apoptosis (16), and glucose starvation induces apoptosis of tuberin-deficient cells (43). However, we demonstrate in the current study that inactivation of tuberin by HG induces apoptosis. Note that in contrast to the results described above, where glucose starvation induces apoptosis, we demonstrate that HG increases apoptosis of podocytes in culture and in vivo in diabetes in an AMPK-dependent manner. More recently, mTOR inhibition has been shown to protect TSC-deficient cells from apoptosis induced by glucose deprivation–induced apoptosis (44). These authors showed that the protection induced by rapamycin was due to decreased AMPK activation and that this protective effect was p53-independent. As opposed to these results, we find that HG-induced apoptosis of podocytes in culture and in diabetic renal glomeruli is reversed by rapamycin. In fact, our data show that HG-induced AMPK inactivation is upstream of mTOR in podocytes. Furthermore, our data demonstrating that constitutively active mTOR restores Nox4 expression in cells treated with AICAR in the presence of HG suggest that HG induces Nox4 expression and apoptosis through a linear pathway that involves AMPK, tuberin, and mTOR.
Tumor tissue deficient in tuberin exhibits high mTOR activity and elevated p53 levels (43). Moreover, an mTOR-mediated increase in p53 mRNA translation is required for the glucose deprivation–induced apoptotic response of TSC-deficient cells. In contrast to these results, we have recently shown that HG increases the levels of p53 to induce apoptosis of podocytes (7). Whether the increase in mTOR activity is necessary for upregulation of p53 in cells exposed to HG needs further investigation.
Rapamycin is a potent inhibitor of mTOR-induced autophagic cell death (45,46). Although induction of autophagy has been proposed to enhance cell survival (45,46), rapamycin-mediated protection of TSC-deficient cells from glucose deprivation–induced apoptosis is not due to an autophagic response (44). Rather, rapamycin enhances utilization of glutamine in the tricarboxylic acid cycle, which generates NADH and the reduced form of flavin adenine dinucleotide (FADH2) to provide electrons to molecular oxygen in the respiratory chain for production of ATP. However, leakage of electrons in this process produces superoxide and increases the levels of ROS in the cell. Whether inhibition of mTOR reduces the levels of ROS to protect cells from glucose deprivation–induced apoptosis is not known. In the case of HG-induced apoptosis of podocytes, we have established a role of ROS derived from Nox4 (7,8). We demonstrate that mTOR inhibition decreases the expression of Nox4 and HG-induced NADPH oxidase activity. Thus, our results provide a previously unrecognized link between mTOR and Nox4 in HG-induced podocyte apoptosis and glomerular cell injury in vitro and in vivo.
Our observations indicate that mTOR inhibitors or AMPK activators and/or antioxidants targeting Nox4 may represent an adjunct therapy in addition to metabolic control to reduce glomerular injury in type 1 diabetes. Our novel finding that Nox4 is a downstream target of mTORC1 implies that mTORC1 inhibitors may be used as therapeutic agents that may counteract oxidant-mediated cell injury in diabetes.
ACKNOWLEDGMENTS
Support for these studies was provided by the following sources: transition award from the JDRF and a research grant from the National Center for Scientific Research Lebanon (to A.A.E.), JDRF Multiproject Research Grant (to H.E.A., Y.G., and K.B. and J.L.B.), and National Institutes of Health (NIH) Grant DK-R01-078971 and VA Merit Review (to H.E.A.). G.G.C. is a recipient of VA Senior Research Career Scientist Award and supported by NIH RO1-DK-50190, VA Merit Review, and JDRF Regular Research Grant 1-2008-185.
No potential conflicts of interest relevant to this article were reported.
A.A.E. generated the experimental data and wrote the manuscript. B.M.F., B.B., and R.d.C.C. helped with experimental data. K.B. contributed to discussion and edited the manuscript. J.L.B. helped with the immunohistochemistry experiments and analysis and contributed to writing the discussion. Y.G. and G.G.C. contributed to writing the discussion and edited the manuscript. H.E.A. conceived the work and edited the manuscript. A.A.E. is the guarantor of this work and, as such, had full access to all the data in the study and takes responsibility for the integrity of the data and the accuracy of the data analysis.
The authors thank Andrea Berrantine, Sergio Garcia, and Freydine Springer (all from the University of Texas Health Science Center, San Antonio, Texas) for technical assistance.
Footnotes
This article contains Supplementary Data online at http://diabetes.diabetesjournals.org/lookup/suppl/doi:10.2337/db12-1504/-/DC1.
REFERENCES
- 1.Lloberas N, Cruzado JM, Franquesa M, et al. Mammalian target of rapamycin pathway blockade slows progression of diabetic kidney disease in rats. J Am Soc Nephrol 2006;17:1395–1404 [DOI] [PubMed] [Google Scholar]
- 2.Flaquer M, Lloberas N, Franquesa M, et al. The combination of sirolimus and rosiglitazone produces a renoprotective effect on diabetic kidney disease in rats. Life Sci 2010;87:147–153 [DOI] [PubMed] [Google Scholar]
- 3.Mori H, Inoki K, Masutani K, et al. The mTOR pathway is highly activated in diabetic nephropathy and rapamycin has a strong therapeutic potential. Biochem Biophys Res Commun 2009;384:471–475 [DOI] [PubMed] [Google Scholar]
- 4.Pagtalunan ME, Miller PL, Jumping-Eagle S, et al. Podocyte loss and progressive glomerular injury in type II diabetes. J Clin Invest 1997;99:342–348 [DOI] [PMC free article] [PubMed] [Google Scholar]
- 5.Drummond K, Mauer M, International Diabetic Nephropathy Study Group The early natural history of nephropathy in type 1 diabetes: II. Early renal structural changes in type 1 diabetes. Diabetes 2002;51:1580–1587 [DOI] [PubMed] [Google Scholar]
- 6.Susztak K, Raff AC, Schiffer M, Böttinger EP. Glucose-induced reactive oxygen species cause apoptosis of podocytes and podocyte depletion at the onset of diabetic nephropathy. Diabetes 2006;55:225–233 [PubMed] [Google Scholar]
- 7.Eid AA, Ford BM, Block K, et al. AMP-activated protein kinase (AMPK) negatively regulates Nox4-dependent activation of p53 and epithelial cell apoptosis in diabetes. J Biol Chem 2010;285:37503–37512 [DOI] [PMC free article] [PubMed] [Google Scholar]
- 8.Eid AA, Gorin Y, Fagg BM, et al. Mechanisms of podocyte injury in diabetes: role of cytochrome P450 and NADPH oxidases. Diabetes 2009;58:1201–1211 [DOI] [PMC free article] [PubMed] [Google Scholar]
- 9.Wullschleger S, Loewith R, Hall MN. TOR signaling in growth and metabolism. Cell 2006;124:471–484 [DOI] [PubMed] [Google Scholar]
- 10.Dann SG, Selvaraj A, Thomas G. mTOR Complex1-S6K1 signaling: at the crossroads of obesity, diabetes and cancer. Trends Mol Med 2007;13:252–259 [DOI] [PubMed] [Google Scholar]
- 11.Sabatini DM. mTOR and cancer: insights into a complex relationship. Nat Rev Cancer 2006;6:729–734 [DOI] [PubMed] [Google Scholar]
- 12.Um SH, D’Alessio D, Thomas G. Nutrient overload, insulin resistance, and ribosomal protein S6 kinase 1, S6K1. Cell Metab 2006;3:393–402 [DOI] [PubMed] [Google Scholar]
- 13.Sarbassov DD, Guertin DA, Ali SM, Sabatini DM. Phosphorylation and regulation of Akt/PKB by the rictor-mTOR complex. Science 2005;307:1098–1101 [DOI] [PubMed] [Google Scholar]
- 14.Lee MJ, Feliers D, Mariappan MM, et al. A role for AMP-activated protein kinase in diabetes-induced renal hypertrophy. Am J Physiol Renal Physiol 2007;292:F617–F627 [DOI] [PubMed] [Google Scholar]
- 15.Shaw RJ. LKB1 and AMP-activated protein kinase control of mTOR signalling and growth. Acta Physiol (Oxf) 2009;196:65–80 [DOI] [PMC free article] [PubMed] [Google Scholar]
- 16.Inoki K, Zhu T, Guan KL. TSC2 mediates cellular energy response to control cell growth and survival. Cell 2003;115:577–590 [DOI] [PubMed] [Google Scholar]
- 17.Rosner M, Hanneder M, Siegel N, Valli A, Hengstschläger M. The tuberous sclerosis gene products hamartin and tuberin are multifunctional proteins with a wide spectrum of interacting partners. Mutat Res 2008;658:234–246 [DOI] [PubMed] [Google Scholar]
- 18.Gorin Y, Ricono JM, Wagner B, et al. Angiotensin II-induced ERK1/ERK2 activation and protein synthesis are redox-dependent in glomerular mesangial cells. Biochem J 2004;381:231–239 [DOI] [PMC free article] [PubMed] [Google Scholar]
- 19.Abboud HE, Ou SL, Velosa JA, Shah SV, Dousa TP. Dynamics of renal histamine in normal rat kidney and in nephrosis induced by aminonucleoside of puromycin. J Clin Invest 1982;69:327–336 [DOI] [PMC free article] [PubMed] [Google Scholar]
- 20.Jo YI, Cheng H, Wang S, Moeckel GW, Harris RC. Puromycin induces reversible proteinuric injury in transgenic mice expressing cyclooxygenase-2 in podocytes. Nephron, Exp Nephrol 2007;107:e87–e94 [DOI] [PubMed] [Google Scholar]
- 21.Dische FE. Measurement of glomerular basement membrane thickness and its application to the diagnosis of thin-membrane nephropathy. Arch Pathol Lab Med 1992;116:43–49 [PubMed] [Google Scholar]
- 22.Jensen EB, Gundersen HJ, Osterby R. Determination of membrane thickness distribution from orthogonal intercepts. J Microsc 1979;115:19–33 [DOI] [PubMed] [Google Scholar]
- 23.Hirose K, Osterby R, Nozawa M, Gundersen HJ. Development of glomerular lesions in experimental long-term diabetes in the rat. Kidney Int 1982;21:689–695 [DOI] [PubMed] [Google Scholar]
- 24.Carlson EC, Audette JL, Klevay LM, Nguyen H, Epstein PN. Ultrastructural and functional analyses of nephropathy in calmodulin-induced diabetic transgenic mice. Anat Rec 1997;247:9–19 [DOI] [PubMed] [Google Scholar]
- 25.Faulkner JL, Szcykalski LM, Springer F, Barnes JL. Origin of interstitial fibroblasts in an accelerated model of angiotensin II-induced renal fibrosis. Am J Pathol 2005;167:1193–1205 [DOI] [PMC free article] [PubMed] [Google Scholar]
- 26.Kim YH, Goyal M, Kurnit D, et al. Podocyte depletion and glomerulosclerosis have a direct relationship in the PAN-treated rat. Kidney Int 2001;60:957–968 [DOI] [PubMed] [Google Scholar]
- 27.Sanden SK, Wiggins JE, Goyal M, Riggs LK, Wiggins RC. Evaluation of a thick and thin section method for estimation of podocyte number, glomerular volume, and glomerular volume per podocyte in rat kidney with Wilms’ tumor-1 protein used as a podocyte nuclear marker. J Am Soc Nephrol 2003;14:2484–2493 [DOI] [PubMed] [Google Scholar]
- 28.Holz MK, Blenis J. Identification of S6 kinase 1 as a novel mammalian target of rapamycin (mTOR)-phosphorylating kinase. J Biol Chem 2005;280:26089–26093 [DOI] [PubMed] [Google Scholar]
- 29.Chiang GG, Abraham RT. Phosphorylation of mammalian target of rapamycin (mTOR) at Ser-2448 is mediated by p70S6 kinase. J Biol Chem 2005;280:25485–25490 [DOI] [PubMed] [Google Scholar]
- 30.Sakaguchi M, Isono M, Isshiki K, Sugimoto T, Koya D, Kashiwagi A. Inhibition of mTOR signaling with rapamycin attenuates renal hypertrophy in the early diabetic mice. Biochem Biophys Res Commun 2006;340:296–301 [DOI] [PubMed] [Google Scholar]
- 31.Yang Y, Wang J, Qin L, et al. Rapamycin prevents early steps of the development of diabetic nephropathy in rats. Am J Nephrol 2007;27:495–502 [DOI] [PubMed] [Google Scholar]
- 32.Nagai K, Matsubara T, Mima A, et al. Gas6 induces Akt/mTOR-mediated mesangial hypertrophy in diabetic nephropathy. Kidney Int 2005;68:552–561 [DOI] [PubMed] [Google Scholar]
- 33.Sataranatarajan K, Mariappan MM, Lee MJ, et al. Regulation of elongation phase of mRNA translation in diabetic nephropathy: amelioration by rapamycin. Am J Pathol 2007;171:1733–1742 [DOI] [PMC free article] [PubMed] [Google Scholar]
- 34.Simone S, Gorin Y, Velagapudi C, Abboud HE, Habib SL. Mechanism of oxidative DNA damage in diabetes: tuberin inactivation and downregulation of DNA repair enzyme 8-oxo-7,8-dihydro-2′-deoxyguanosine-DNA glycosylase. Diabetes 2008;57:2626–2636 [DOI] [PMC free article] [PubMed] [Google Scholar]
- 35.Inoki K, Mori H, Wang J, et al. mTORC1 activation in podocytes is a critical step in the development of diabetic nephropathy in mice. J Clin Invest 2011;121:2181–2196 [DOI] [PMC free article] [PubMed] [Google Scholar]
- 36.Gödel M, Hartleben B, Herbach N, et al. Role of mTOR in podocyte function and diabetic nephropathy in humans and mice. J Clin Invest 2011;121:2197–2209 [DOI] [PMC free article] [PubMed] [Google Scholar]
- 37.Kahn BB, Alquier T, Carling D, Hardie DG. AMP-activated protein kinase: ancient energy gauge provides clues to modern understanding of metabolism. Cell Metab 2005;1:15–25 [DOI] [PubMed] [Google Scholar]
- 38.Block K, Gorin Y, Abboud HE. Subcellular localization of Nox4 and regulation in diabetes. Proc Natl Acad Sci U S A 2009;106:14385–14390 [DOI] [PMC free article] [PubMed] [Google Scholar]
- 39.Gorin Y, Block K, Hernandez J, et al. Nox4 NAD(P)H oxidase mediates hypertrophy and fibronectin expression in the diabetic kidney. J Biol Chem 2005;280:39616–39626 [DOI] [PubMed] [Google Scholar]
- 40.Block K, Gorin Y, New DD, et al. The NADPH oxidase subunit p22phox inhibits the function of the tumor suppressor protein tuberin. Am J Pathol 2010;176:2447–2455 [DOI] [PMC free article] [PubMed] [Google Scholar]
- 41.Pérez de Obanos MP, López-Zabalza MJ, Arriazu E, Modol T, et al. Reactive oxygen species (ROS) mediate the effects of leucine on translation regulation and type I collagen production in hepatic stellate cells. Biochim Biophys Acta 2007;1773:1681–1688 [DOI] [PubMed]
- 42.Wataya-Kaneda M, Kaneda Y, Hino O, et al. Cells derived from tuberous sclerosis show a prolonged S phase of the cell cycle and increased apoptosis. Arch Dermatol Res 2001;293:460–469 [DOI] [PubMed] [Google Scholar]
- 43.Lee CH, Inoki K, Karbowniczek M, et al. Constitutive mTOR activation in TSC mutants sensitizes cells to energy starvation and genomic damage via p53. EMBO J 2007;26:4812–4823 [DOI] [PMC free article] [PubMed] [Google Scholar]
- 44.Choo AY, Kim SG, Vander Heiden MG, et al. Glucose addiction of TSC null cells is caused by failed mTORC1-dependent balancing of metabolic demand with supply. Mol Cell 2010;38:487–499 [DOI] [PMC free article] [PubMed] [Google Scholar]
- 45.Chen S, Rehman SK, Zhang W, Wen A, Yao A, Zhang J. Autophagy is a therapeutic target in anticancer drug resistance. Biochim Biophys Acta 2010;1806:220–229 [DOI] [PubMed]
- 46.Lum JJ, Bui T, Gruber M, et al. The transcription factor HIF-1alpha plays a critical role in the growth factor-dependent regulation of both aerobic and anaerobic glycolysis. Genes Dev 2007;21:1037–1049 [DOI] [PMC free article] [PubMed] [Google Scholar]


