

ABSTRACT
Although there are established relationships between physical and mental health, few studies have explored the relationship between health behaviors and mental health over time. To explore rates of health-compromising behaviors (HCBs) and the longitudinal relationship between HCBs and depression, anxiety, and stress, five waves of data were collected over 1 year from 482 patients at an urban public health clinic (47 % female, 68 % African-American, Mage = 28). Smoking (61 %), binge drinking (52 %), illegal drug use (53 %), unprotected sex with non-primary partners (55 %), and fast food consumption (71 %) were common, while consumption of fruits or vegetables (30 %) and breakfast (17 %) were rare. Cross-lagged models identified within-time associations between HCBs and depression/anxiety and stress. Additionally, depression/anxiety and stress predicted later HCBs, but HCBs did not predict later mental health. Results suggest that targeting mental health may be important to promoting improvements across multiple health behaviors.
KEYWORDS: Health behavior, Mental health, Depression, Anxiety, Perceived stress
Low socioeconomic status (SES) increases risk for multiple health problems [1–5] that, in turn, increase risk of premature morbidity and mortality [6–9]. Several mechanisms have been proposed to explain how SES “gets under the skin,” including downward social drift, increased allostatic load, and poorer health behaviors [10]. Of these, health-compromising behaviors, such as poor dietary habits [e.g., 11–13], lower levels of physical activity [e.g., 14], and higher rates of smoking [e.g., 15, 16], explain approximately half of the SES differences in mortality [17–19].
Health-compromising behaviors (HCBs) arise from multiple causes, including genetic vulnerability and environmental exposure as well as familial and other psychosocial factors. An important but understudied psychosocial correlate of HCB is poor mental health. Research shows that HCBs are more common among people living with stress, depression, and anxiety [20–25]. This relationship has been found for a variety of health behaviors, including substance use (tobacco, alcohol, and illegal drugs) [23, 24, 26, 27]; sedentary behavior and high body mass index [28]; sexual behavior [29, 30]; and sleep quality [31, 32].
Implicit in much of the research on the association between mental health and health behaviors is the notion that HCBs function as coping strategies; that is, HCBs are often used to cope with negative affect and other mental health problems [33]. For example, the stress-coping model [33, 34] suggests that alcohol, nicotine, and other drugs may be used to manage negative affect resulting from problems and stressors. This form of avoidant coping is generally maladaptive because it does not help individuals to address their stressors or to manage emotions resulting from these stressors, leading to unresolved problems and a continuation of distress [33]. Other HCBs such as the consumption of fatty and high caloric foods or engagement in sexual risk behavior may similarly be used as avoidant coping mechanisms; the pleasure associated with engaging in these behaviors may temporarily relieve some of the negative emotions associated with stressors [35, 36].
HCBs may also cause (or exacerbate) mental health problems. Smoking, drinking, inadequate sleep, and physical inactivity can increase inflammation, anxiety, and other stress indicators [37–39]. Use of HCBs as avoidant coping strategies (i.e., strategies that allow individuals to temporarily forget about their stressors or problems) may also lead to regret and anxiety [40], which can worsen the precipitating mental health symptoms [41]. In this way, HCBs may give rise to or exacerbate mental health problems [36, 42–45]. The relation between HCBs and mental health problems may even be bidirectional, with individuals who are experiencing anxiety, depression, or stress using HCBs as avoidant coping strategies, leading to regret and an exacerbation of mental health problems and then to increased use of HCBs for avoidant coping.
The extant literature reveals associations between SES and health behaviors and between mental health and health behaviors. However, fewer studies have connected these related literatures by examining the health behavior–mental health relationship in the context of socioeconomic disadvantage. Therefore, the purpose of the current research was to examine the relationship between HCBs and depression/anxiety and stress in a low-income sample in order to better understand the nature of their association over a 1-year period. To improve upon prior work, we use a methodologically sophisticated approach (viz, cross-lagged models) in a large, low-income, urban sample. This study fills a gap in the literature by determining whether mental health problems lead to subsequent HCBs (as has been assumed in much prior research), whether HCBs lead to subsequent mental health problems, or whether there is a bidirectional association between mental health and HCBs. We examine a range of HCBs, including substance use, risky sexual behavior, poor diet, sedentary behavior, and lack of or excessive sleep, to address two hypotheses: (1) depression/anxiety and stress will lead to HCBs, and (2) HCBs will also contribute to depression/anxiety and stress. In addition to testing these hypotheses, we explore rates of HCB and associations among multiple HCBs in this vulnerable population subgroup.
METHOD
Participants
Participants were 482 patients (47 % female, 68 % African-American, 20 % White, 8 % mixed race, Mage = 28.40 years, SDage = 9.63, 50 % with family income of <US $15,000/year) receiving care at a publicly funded sexually transmitted infection (STI) clinic who participated in a sexual risk reduction randomized controlled trial (RCT). Inclusion criteria for the RCT were as follows: (1) age 16 or older and (2) sexual risk behavior in the past 3 months. Patients were excluded from the RCT if they were (1) infected with HIV, (2) impaired (e.g., due to substance use), (3) receiving inpatient substance abuse treatment, or (4) planning to move out of the area within the next year. Participants in the RCT (N = 973) received either a sexual risk reduction intervention or a general health promotion intervention. We included only RCT participants who did not receive the general health promotion intervention (N = 482, 50 % of the total sample) in the current analysis so that our models would represent associations between health behavior and mental health in the absence of an intervention promoting a healthy diet, physical activity, and reductions in substance use.
Procedures
Eligible patients who provided written consent were asked to complete an audio computer-assisted self-interview (ACASI) on a laptop computer. All participants were reimbursed for their time. At 3, 6, 9, and 12 months post-intervention, participants completed an ACASI and were again reimbursed. The protocol was approved by the Institutional Review Boards of the participating institutions, and to protect participant privacy, a Federal Certificate of Confidentiality was obtained.
Measures: health-compromising behaviors
Our selection of HCBs (as well as categorizations for binge drinking, smoking, physical activity, and the dietary indicators) was informed by previous research on multiple health behaviors [e.g., 46, 47]. To increase the scope of research on HCBs, we also considered behaviors rarely incorporated in previous research on multiple health behaviors, including illegal drug use, unprotected sex, and excessive time spent sitting. All HCBs were dichotomously coded and then summed to create an index of HCBs. To minimize respondent burden in this public health setting, we selected brief measures that we and others have used in previous research.
Substance use behaviors
As a measure of (1) binge drinking, participants reported their frequency of drinking four or more drinks (women) or five or more drinks (men) in a single day during the past 3 months on a scale from 0 (never) to 9 (every day); those participants who had consumed four or five drinks at least once during the past 3 months were coded as engaging in binge drinking [48]. Participants reported their frequency of using (2) cigarettes or other tobacco products during the past 3 months on a scale from 0 (never) to 5 (about every day); participants were coded as smokers if they ever used tobacco products. As a measure of (3) illegal drug use, participants reported their frequency of using marijuana and their frequency of using crack cocaine or cocaine powder during the past 3 months on scales from 0 (never) to 5 (about every day); these substances were identified in prior research in this setting [49, 50] as the two most frequently used illegal drugs. Participants who used either of these substances in the past 3 months were coded as engaging in illegal drug use. None vs some coding for binge drinking, tobacco use, and illegal drug use is in line with how statistics related to these behaviors are reported by the CDC [51] as well as with goals set by Healthy People 2020 [52].
Sexual behaviors
As a measure of risky sexual behavior, participants reported the number of times they had engaged in (4) unprotected sex (sex without a condom) with a non-primary partner during the past 3 months; this variable was recoded to indicate whether participants had engaged in any unprotected sex with non-primary partners. We focused specifically on non-primary partners because hormonal contraception often replaces condom use as primary partnerships progress [53].
Exercise behaviors
As a measure of (5) physical activity, participants reported their frequency of engaging in vigorous activity for ≥20 min and their frequency of engaging in moderate activity for ≥30 min during the past 3 months on a scale from 0 (never) to 3 (nearly every day). Government guidelines [54] suggest exercising at least several times per week; therefore, participants who reported engaging in either vigorous or moderate activity never or rarely (0 or 1) were coded as engaging in a lack of exercise behavior. Participants also reported their (6) time spent sitting in hours and minutes. Because research suggests that more than 8 h of sitting per day may compromise health [55], participants who spent more than 8 h per day sitting on average were coded as engaging in excessive sitting.
Dietary behaviors
Participants reported their frequency of eating (7) breakfast during the past week from 0 to 7 days; participants who ate breakfast on five or fewer days per week were coded as having irregular breakfast consumption. Participants reported their frequency of consuming (8) fast food on a scale from 0 (never) to 7 (every day); participants who consumed fast food once or more per week (4 or higher) were coded as engaging in regular fast food consumption. Participants also completed six diet-related items from the National Health and Nutrition Examination Survey (NHANES) dietary screener [56], reporting their frequency of consuming vegetables (raw, cooked, canned, or frozen); fruit (fresh, frozen, or canned); regular soda; red meat (e.g., beef, pork, ham, or sausage); processed meat (e.g., bacon, deli meats, or hot dogs); and fried foods (e.g., French fries, fried chicken, or fried fish) on a scale from 0 (never) to 4 (daily, once a day, or more). We coded participants for (9) infrequent fruit and vegetable consumption (less than daily consumption of both fruits and vegetables), (10) daily soda consumption, and a (11) high-fat diet (red meat, processed meat, or fried food daily). We created dietary indicators similar to those utilized by Heinrich et al. [46].
Sleep behavior
Participants reported how many (l) hours of sleep they got on average each night during the past 4 weeks. Participants who slept fewer than 7 h or more than 9 h per night were coded for poor sleep, to reflect the guidelines for sleep of the National Sleep Foundation [57].
Index of HCBs
Because of our interest in looking at health behaviors as a group, we created an overall index of HCBs. Consistent with prior studies that have calculated indices of health and risk behaviors [58–61], we summed the number of HCBs to create a single indicator that could range from 0 to 12. This indicator was used in the cross-lagged models.
Measures: mental health indicators
Depression/anxiety
Participants completed four items from the Patient Health Questionnaire for Depression and Anxiety [the PHQ-4; 62], reporting their frequency of four symptoms of depression and anxiety (e.g., “feeling down, depressed, or hopeless” and “feeling nervous, anxious, or on edge”) in the last 2 weeks on a scale from 0 (not at all) to 3 (nearly every day). These items were averaged (αs at each time point = 0.87–0.89). A higher score indicated more symptoms of depression/anxiety. The PHQ-4 predicts impaired functioning nearly as well as longer measures of depression and anxiety and has high internal reliability [62].
Perceived stress
Participants completed four items from the Perceived Stress Scale (PSS) [63], reporting their frequency of indicators of stress in the last month (e.g., “How often have you felt you were unable to control the important things in your life?”) on a scale from 0 (never) to 4 (very often). These items were averaged (αs = 0.59–0.63). A higher score indicated greater perceived stress.
Measures: demographic controls
At baseline, participants reported their sex, race/ethnicity, income, and age. Dummy variables were created to indicate male sex, white race, mixed race, family income less than US $15,000 per year, and age over 25; these variables served as controls in cross-lagged models.
Data management and analysis
Missing data
There were three main sources of missing data in the current study. First, the design of the RCT involved one half of participants (randomly selected) completing intensive sexual health measures, while the other half completed general health measures. All demographic variables, all mental health variables, and the majority of HCBs included in the current study were assessed for the entire sample. However, several HCBs (including the NHANES items, the measure of sitting, and the measure of binge drinking) were assessed only in the one half of the sample completing general health measures. Thus, these few measures were missing completely at random (MCAR) from one half of the sample (N = 239, 50 %). Second, rolling enrollment in the RCT resulted in participants completing their follow-up assessments at different times, and a number of participants had not yet completed all follow-up assessments. Third, due to the longitudinal follow-ups and high-risk sample, some attrition occurred. Rolling enrollment and attrition resulted in 73 % of participants (N = 351) being included at 3 months, 56 % of participants (N = 268) at 6 months, 48 % of participants (N = 232) at 9 months, and 40 % of participants (N = 191) at 12 months. Rolling enrollment accounted for approximately 43 % of the missing data at 3 months, 58 % at 6 months, 69 % at 9 months, and 81 % at 12 months. To explore whether those missing follow-up assessments differed from those with complete data, we compared participants missing and not missing data at each time point on demographic characteristics as well as HCBs and mental health measures at baseline. There were no differences in any key study variables (including HCBs, depression, anxiety, and stress). Younger participants were slightly more likely than older participants to be missing data at the 3-month follow-up, χ2(1) = 4.75, p < 0.05, and mixed race participants were less likely than other participants to be missing data at the 12-month follow-up, χ2(1) = 5.12, p < 0.05. There were no other demographic differences.
The nature of the missing data (MCAR and missing at random) [64] made multiple imputation (MI) highly suitable. MI, which is preferred over traditional approaches to missing data analysis [65], allows for the entire sample to be maintained. We imputed 100 complete datasets [66] using the R program Amelia [67]. All study variables (including demographics, HCBs, and mental health measures) along with other variables thought to inform the imputation (including additional demographic and health behavior variables) were included in the imputation. Analyses were conducted with all 100 datasets, and parameter estimates were pooled using the imputation algorithms in Mplus 5 [68].
Analysis plan
The primary study analyses were conducted using an autoregressive cross-lagged panel model approach [69], allowing us to test associations within and across time. Cross-lagged path analysis is often used to infer causal associations in data from longitudinal research designs. These analyses were conducted with Mplus 5 using the maximum likelihood estimator. We modeled depression/anxiety and stress as latent constructs with items of the PHQ-4 and PSS scales serving as indicators. We applied equality constraints in cross-lagged models to impose stationarity; factor loadings, autoregressive paths (paths from a given variable at one time point to the same variable at the next time point), lagged paths (paths from a given variable at one time point to a different variable at the next time point), and within-time correlations between variables were constrained to be equal over time. The primary variables of interest (HCBs, depression/anxiety, and stress) were modeled over time. Several covariates were included in the models to rule out alternative explanations for the association between HCBs and mental health, including sex, race, income, and age. Paths that were highly nonsignificant (T < 1) were constrained to zero to increase model parsimony and stabilize estimates.
RESULTS
Rates of health-compromising behaviors
Overall rates of the HCBs at baseline are shown in Table 1. Of the 12 HCBs, participants engaged in an average of 6.2 (SD = 2.3). The majority of participants engaged in some binge drinking (52 %), smoking (61 %), illegal drug use (53 %), and unprotected sex with non-primary partners (55 %). Additionally, few participants regularly consumed breakfast (27 %) or fruits and vegetables (30 %); participants were likely to regularly consume fast food (71 %). The majority of participants (57 %) reported too little or too much sleep. Although these HCBs were common, participants were fairly active, with the majority reporting regular physical activity (65 %) and less than half reporting more than 8 h of sitting per day (45 %). Participants were also unlikely to report daily consumption of high-fat foods (25 %) or soda (17 %).
Table 1.
Descriptive statistics for health-compromising behaviors and mental health indicators
| Health compromising behaviors (HCBs) | M (SD) |
|---|---|
| Total Number of HCBs (0−12) | 6.2 (2.3) |
| % | |
| Substance use behaviors | |
| Binge drinking (past 3 months) | 52 |
| Smoking (past 3 months) | 61 |
| Illegal drug use (past 3 months) | 53 |
| Sexual behaviors | |
| Unprotected sex (past 3 months) | 55 |
| Physical activity behaviors | |
| Lack of physical activity (past 3 months) | 35 |
| Excessive sitting (past week) | 45 |
| Dietary behaviors | |
| Infrequent breakfast consumption (past week) | 83 |
| Regular fast food consumption | 71 |
| Infrequent fruit/vegetable consumption (past month) | 70 |
| High-fat diet (past month) | 25 |
| Daily soda consumption (past month) | 17 |
| Sleep behaviors | |
| Too little or too much sleep (past 4 weeks) | 57 |
| Mental health | M (SD) |
| Depression (PHQ; 0-3; past 2 weeks) | 0.8 (1.2) |
| Anxiety (PHQ; 0-3; past 2 weeks) | 1.0 (1.1) |
| Perceived stress (PSS; 0-4; past month) | 1.6 (0.8) |
HCB health-compromising behavior
Associations among diverse HCBs
We explored associations between the 12 HCBs by examining odds ratios (ORs). There were relatively few significant associations among the diverse HCBs; we mention only the significant ORs. Participants who smoked were more likely to engage in binge drinking, OR = 1.91, 95% confidence interval (CI) (1.20, 3.04), p < 0.01, and participants who engaged in illegal drug use were more likely to binge drink, OR = 2.39, 95% CI (1.52, 3.77), p < 0.001, and to use tobacco, OR = 3.88, 95% CI (2.63, 5.73), p < 0.001. Additionally, participants who engaged in binge drinking were more likely to have unprotected sex with outside partners, OR = 1.58, 95% CI (1.02, 2.44), p < 0.05. Participants who consumed fast food regularly also consumed breakfast infrequently, OR = 1.72, 95% CI (1.05, 2.80), p < 0.05. Finally, participants who reported too little or too much sleep were more likely to engage in unprotected sex, OR = 1.56, 95% CI (1.07, 2.26), p < 0.05, and to consume breakfast infrequently, OR = 2.66, 95% CI (1.63, 4.34), p < 0.001.
Demographic predictors of HCBs and mental health indicators
Linear regressions were used to explore the association of demographic characteristics with HCBs, depression/anxiety, and perceived stress. Very low-income participants (those earning less than US $15,000 per year) reported a higher number of HCBs, β = 0.74, 95 % CI (0.37, 1.11), p < 0.001, compared to higher-income participants. Very low-income participants also reported more symptoms of depression/anxiety, β = 0.19, 95 % CI (0.04, 0.34), p < 0.05, and higher levels of stress, β = 0.23, 95 % CI (0.09, 0.37), p < 0.001. Men reported fewer symptoms of depression/anxiety, β = −0.18, 95 % CI (−0.33, −0.03), p < 0.05, and stress, β = −0.19, 95 % CI (−0.33, −0.06), p < 0.01, than did women. There were no racial or ethnic differences or age differences in HCBs or mental health indicators. Demographic characteristics were controlled for in cross-lagged models.
Longitudinal associations between HCBs and depression/anxiety
The cross-lagged model (Fig. 1) provided a good fit to the data, χ2 (247) = 272.71, p = 0.12, comparative fit index (CFI) = 0.99, Tucker–Lewis index (TLI) = 0.99, root mean square error of approximation (RMSEA) = 0.02. The 3-month autoregressive coefficients for HCBs (i.e., the paths from HCBs at one time point to HCBs at the next time point) were significant, Bs = 0.37–0.39, ps < 0.001, indicating continuity in HCBs (i.e., those who engaged in more HCBs at one time point were likely to engage in more HCBs at the next time point as well). Additionally, there was longer-term continuity in HCBs, with HCBs at one time point predicting HCBs 6 months later, Bs = 0.23–0.25, ps < 0.001. The 3-month autoregressive coefficients for depression/anxiety were also significant, Bs = 0.42–0.58, ps < 0.001, as were the 6-month autoregressive effects, Bs = 0.20–0.25, ps < 0.001, indicating continuity in symptoms of depression/anxiety. Additionally, HCBs and depression/anxiety were significantly correlated at each time point, Bs=0.12-0.20, ps <.01, indicating that those who engaged in more HCBs at each time point also reported more symptoms of depression/anxiety.
Fig 1.
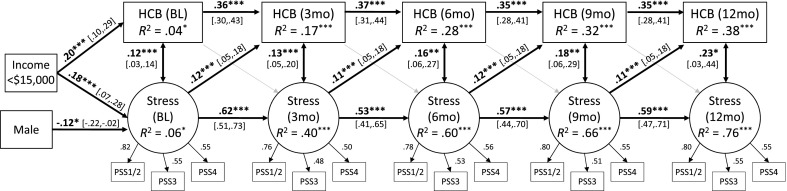
Cross-lagged model showing associations between health compromising behaviors and symptoms of anxiety/depression over 1 year. The four items from the Patient Health Questionnaire for Depression and Anxiety (PHQ-4) serve as indicators for the latent anxiety/depression construct; items 1 and 3 were averaged at each time point to create the first indicator. Standardized regression coefficients are reported. Control variables included sex, race, income, and age. Factor loadings, autoregressive paths, lagged paths, and within-time correlations between variables were constrained to be equal over time, although standardized values differ slightly. Long-term (6-month) autoregressive effects for HCBs and depression/anxiety were also significant. Gray arrows represent nonsignificant paths. Average fit indices across 100 multiply imputed datasets: χ2 (247) = 272.71, p = 0.12, CFI = 0.99, TLI = 0.99, RMSEA = 0.02. *p < 0.05; **p < 0.01; ***p < 0.01. HCB health-compromising behaviors, BL baseline, 3mo 3 months after baseline, 6mo 6 months, 9mo 9 months, 12mo 12 months
Finally, as hypothesized (hypothesis 1), there were significant lagged effects of depression/anxiety on HCBs, Bs = 0.09–0.10, ps < 0.01, indicating that individuals who reported more symptoms of depression/anxiety at one time point engaged in more HCBs at the next time point. However, contrary to hypothesis 2, there were no significant lagged effects of HCBs on depression/anxiety, Bs = 0.02, ps = 0.47, indicating that those who engaged in more HCBs at one time point did not report more symptoms of depression/anxiety at the next time point.
Longitudinal associations between HCBs and perceived stress
The cross-lagged model (Fig. 2) was a good fit to the data, χ2 (245) = 301.47, p < 0.01, CFI = 0.96, TLI = 0.95, RMSEA = 0.02. The 3-month autoregressive coefficients for stress were significant, Bs = 0.53–0.62, p < 0.001, as were the 6-month autoregressive effects, Bs = 0.28–0.31, ps < 0.001, indicating that levels of stress at one point were positively associated with levels of stress both 3 and 6 months later. Additionally, HCBs and stress were significantly correlated at each time point, Bs=0.12-0.23, ps<.05, indicating that those who engaged in more HCBs at each time point also reported higher levels of stress.
Fig 2.
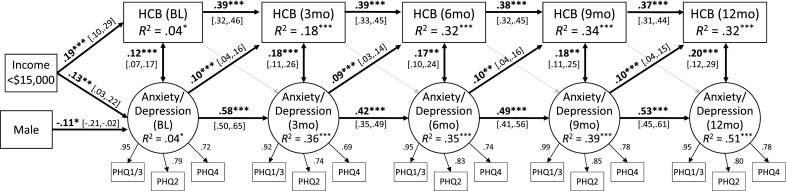
Cross-lagged model showing associations between health compromising behaviors and stress over 1 year. The four items from the Perceived Stress Scale serve as indicators for the latent stress construct; items 1 and 2 were averaged at each time point to create the first indicator. Standardized regression coefficients are reported. Control variables included sex, race, income, and age. Factor loadings, autoregressive paths, lagged paths, and within-time correlations between variables were constrained to be equal over time, although standardized values differ slightly. Long-term (6-month) autoregressive effects for HCBs and stress were also included in the model. Gray arrows represent nonsignificant paths. Average fit indices across 100 multiply imputed datasets: χ2(245) = 301.47, p < 0.01, CFI = 0.96, TLI = 0.95, RMSEA = 0.02. *p < 0.05; ***p < 0.01. HCB health-compromising behaviors, BL baseline, 3mo 3 months after baseline, 6mo 6 months, 9mo 9 months, 12mo 12 months
Finally, as hypothesized (hypothesis 1), there were significant lagged effects of stress on HCBs, Bs = 0.11–0.12, ps < 0.001, indicating that individuals who reported higher levels of stress at one time point engaged in more HCBs at the next time point. However, contrary to hypothesis 2, there were no significant lagged effects of HCBs on stress, Bs = 0.04, ps = 0.18, indicating that those who engaged in more HCBs at one time point did not report higher levels of stress at the next time point.
Longitudinal associations between subsets of HCBs and mental health
Although our primary interest was in a comprehensive index of HCBs, we tested two subsets of HCBs to see whether associations with depression/anxiety and perceived stress differed for different HCBs. The two subsets of HCBs were diet and activity (including the five dietary indicators as well as lack of exercise and excessive sitting) and risk behaviors (including the three substance use variables and unprotected sex).
Cross-lagged models showed that there were significant within-time associations between diet- and activity-related HCBs and depression/anxiety, Bs = 0.08–0.14, ps < 0.01, indicating that those with poorer diets and less activity at each time point also reported more symptoms of depression/anxiety at the same time point. Additionally, there were significant lagged effects of depression/anxiety on diet- and activity-related HCBs, Bs = 0.09–0.11, ps < 0.001, indicating that individuals who reported more symptoms of depression/anxiety at one time point reported poorer diets and lower activity levels at the next time point. There were no within-time associations between diet- and activity-related HCBs and stress, Bs = 0.04–0.11, ps = 0.15–0.20, indicating that individuals engaging in more diet- and exercise-related HCBs at each time point did not report higher or lower levels of stress at the same time point. However, there were significant lagged effects of stress on diet- and exercise-related HCBs, Bs = 0.12, ps < 0.001, indicating that individuals who reported higher levels of stress at one time point reported poorer diets and lower activity levels at the next time point. As in the model including all HCBs, there were no lagged effects of diet- and activity-related HCBs on depression/anxiety or stress, indicating that those with poorer diets and lower activity levels at one time point did not report more symptoms of depression/anxiety or higher levels of stress at the next time point.
Cross-lagged models also showed that there were significant within-time associations between risk behaviors and depression/anxiety, Bs = 0.06–0.12, ps < 0.01, indicating that those who engaged in more risk behaviors at each time point also reported more symptoms of depression/anxiety at the same time point. However, there were only marginal lagged effects of depression/anxiety on risk behaviors, Bs = 0.04–0.05, ps < 0.10, indicating that individuals who reported more symptoms of depression/anxiety at one time point were only marginally more likely to report substance use and unprotected sex at the next time point. There were also significant within-time associations between risk behaviors and stress, Bs = 0.07–0.21, ps < 0.05, indicating that those who engaged in more risk behaviors at each time point also reported higher levels of stress at the same time point. However, there were no lagged effects of stress on risk behaviors, Bs = 0.04–0.05, ps = 0.11, indicating that those reporting higher levels of stress at one time point were not more likely to report risk behaviors at the next time point. As in the model including all HCBs, there were also no lagged effects of risk behaviors on depression/anxiety or stress.
Exploratory analyses: indirect effects of income on HCBs
Given that very low income (<US $15,000/year) predicted both depression/anxiety and stress, we tested whether low income had indirect effects on HCBs via depression/anxiety and stress (i.e., whether depression/anxiety and stress-mediated effects of income on HCBs). There was a significant indirect effect of low income on HCBs via depression/anxiety, β = 0.05, CI (0.001, 0.10), p < 0.05, as well as a significant indirect effect of low income on HCBs via stress, β = 0.08, CI (0.01, 0.14), p < 0.05, indicating that very low income individuals reported more HCBs partially as a result of increased depression/anxiety and stress. Notably, low income was also associated directly with HCBs.
DISCUSSION
The current research showed that HCBs, including substance use, unprotected sex, poor diet, and insufficient or excessive sleep, were common among patients attending an urban public health clinic. Rates of substance use were quite high in this population, with 61 % reporting smoking in the past 3 months (as compared to 24 % current smokers in nationally representative samples [70]), 52 % reporting binge drinking in the past 3 months (as compared to a past month prevalence of 24 % in national samples [71]), and 53 % reporting illegal drug use in the past 3 months (as compared to a past month prevalence of 9 % in national samples [71]). Additionally, many participants in the current sample did not consume either fruit or vegetables on a daily basis (70 %, as compared to 25 % who do not consume vegetables and 62 % who do not consume fruit on a daily basis nationally [72]). Regular breakfast consumption was rare (17 %, as compared to 82 % eating breakfast in the past day nationally [73]), while regular fast food consumption was common (71 %, as compared to 41 % in a large, representative community sample [74]). The majority of participants also engaged in unprotected sex with non-primary partners (55 %) and did not get the recommended amount of sleep (57 %) [57]. More encouragingly, relatively few participants in our sample reported daily soda consumption (17 %), daily consumption of high-fat foods (25 %), or a sedentary or nearly-sedentary lifestyle (35 %). Very low-income participants engaged in more HCBs than did higher-income participants. Interestingly, there were very few associations between the various HCBs.
The key finding of this research is that symptoms of depression and anxiety as well as perceived stress predict later levels of HCB after controlling for both demographic factors and earlier HCBs. In contrast, we found no evidence that HCBs predict later mental health. Results were quite similar for depression/anxiety and stress. Researchers have suggested that poor mental health may contribute to HCBs because HCBs serve as coping mechanism for dealing with negative feelings and emotions [33, 36, 42–45]. The current study clearly suggests that HCBs follow depression/anxiety and stress; however, HCBs do not serve to reduce future mental health difficulties, indicating that HCBs are not effective coping mechanisms. This is consistent with previous research on stress and coping, which indicates that avoidant coping is ineffective and associated with later depressive symptoms [75, 76]. Additionally, the current study showed indirect effects of low income on HCBs via depression/anxiety and stress, indicating that very low income may lead to increased engagement in HCBs by increasing mental health symptoms. This adds to a literature showing indirect effects of low income on poor health outcomes (specifically, high blood pressure) via increased obesity and resting heart rate [4, 5]—poor mental health may be another mechanism by which low income impacts physical health outcomes. Notably, exploratory analyses of subsets of HCBs showed within-time associations between depression/anxiety and stress and both diet-/exercise-related HCBs and risk behaviors (i.e., substance use and unprotected sex), but depression/anxiety and stress more strongly predicted future diet-/exercise-related HCBs than they did future risk behaviors. Future research should continue to explore subsets of HCBs.
The current study is unique in that we recruited a low-income urban sample engaging in high levels of HCBs and used a five-wave longitudinal design. Limitations of this study include use of a brief measure of depression/anxiety to reduce participant burden, although the PHQ-4 has been shown to be valid [62] and was reliable in the current sample. Additionally, although we used dietary items from a national survey [56], items did not map directly onto national dietary guidelines. We created an index of health behaviors in order to examine these behaviors broadly, but the behaviors we included, while important predictors of morbidity and mortality, are only a subset of all possible HCBs. Additionally, although our study assessed an important population (i.e., urban, low income, African-American men and women that suffers from numerous health disparities, participants were recruited from an STD clinic, and, therefore, findings may not generalize to nonclinical populations or to individuals not seeking sexual health services. There was some attrition from the study, although this attrition was relatively modest. Rolling enrollment and study design also resulted in missing data; MI was used to retain all participants and to avoid biasing results. Finally, although we assessed HCBs and mental health longitudinally and used cross-lagged analyses to try to disentangle the direction of effects, because data are correlational, we cannot rule out all other possible explanations.
Implications: practice
Results of the current research show that depression, anxiety, and stress contribute to HCBs, suggesting that targeting mental health may be important to promoting improvements across multiple health behaviors. Indeed, a growing literature on “syndemics” suggests that health-damaging behaviors often cluster, especially among disadvantaged population subgroups such as those who are economically disadvantaged as well as racial, ethnic, and sexual minorities [77–79]. Syndemics theory suggests that comorbid conditions may interact to result in worsened health outcomes and that these comorbid conditions cannot be treated in isolation; syndemics theory also draws attention to the importance of social conditions (e.g., poverty) in heightening risk for the comorbid conditions that drive the syndemic. For example, researchers have suggested that there is a syndemic of substance abuse, violence, and AIDS [78]; these three conditions frequently co-occur, and the interactions between these conditions magnify the overall negative physical and mental health consequences. Our findings suggest that there may be a syndemic of stress, mental health, and HCBs; further, the finding that poverty had direct and indirect effects on HCBs suggests that poverty may, in part, drive this syndemic.
Clinicians and practitioners should recognize that there may be high rates of depression, anxiety, and stress, as well as HCBs, in low-income populations, and they should assess mental health as well as HCBs. Brief screenings such as the PHQ-4 and PSS could be administered in a clinic or primary care context to identify those at high risk of poor mental health, possibly using handheld devices to reduce clinician burden. Because our findings suggest that poor mental health leads to HCBs, it may be important to provide referrals for mental health counseling or stress reduction techniques in order to improve health behaviors and, in the longer term, physical health. Another option is to “bundle” these services [80]. Bundling involves aggregating diverse health services to increase the effectiveness of these services—for example, by reaching high-risk individuals who may not seek out separate care. In this case, providing mental health counseling in primary care clinics, STI clinics, or substance abuse programs may aid in decreasing HCBs.
Implications: research
More research is needed on multiple health behaviors in low-income populations. For example, it would be valuable to better understand the low associations between diverse health behaviors in this population. Longer-term longitudinal studies assessing the interplay between HCBs and mental health and studies assessing health behavior changes following mental health interventions would also contribute to our understanding of ties between mental and physical health. If associations between mental health and HCBs prove robust, research might test the cost-effectiveness of mental health treatments to address HCBs (versus targeting these behaviors directly). Additionally, future research should further explore pathways between mental health and HCBs to better understand why depression, anxiety, and stress contribute to these behaviors; identifying mediators of this association may suggest important targets for interventions to reduce HCBs. Although HCBs did not improve future mental health in our sample, associations between HCBs, various forms of mental health, and physical health are likely to be complex and should be further explored in future studies. For example, Jackson and colleagues [81, 82] have suggested that the use of HCBs as coping mechanisms for stress may be especially common among low-income African-Americans; associations between mental health, HCBs, and physical health may vary based on race/ethnicity or SES.
Acknowledgments
This research was supported by grant R01-MH068171 awarded to Michael P. Carey from the Center for Mental Health Research on AIDS, National Institute of Mental Health.
Conflict of interest
The authors have no conflict of interest to disclose.
Footnotes
Implications
Practice: To improve health behaviors and physical health, clinicians and practitioners should assess mental health and perceived stress and provide referrals for mental health counseling or stress reduction techniques when indicated.
Policy: Policymakers should consider the role that access to mental health services might play in addressing health behaviors.
Research: Mental health intervention studies should assess changes in health-compromising behaviors as outcomes.
References
- 1.Stringhini S, Sabia S, Shipley M, et al. Association of socioeconomic position with health behaviors and mortality. JAMA. 2010;303:1159–1166. doi: 10.1001/jama.2010.297. [DOI] [PMC free article] [PubMed] [Google Scholar]
- 2.Singh GK, Siahpush M. Increasing inequalities in all-cause and cardiovascular mortality among US adults aged 25–64 years by area socioeconomic status, 1969–1998. Int J Epidemiol. 2002;31:600–613. doi: 10.1093/ije/31.3.600. [DOI] [PubMed] [Google Scholar]
- 3.Mackenbach JP, Bos V, Andersen O, et al. Widening socioeconomic inequalities in mortality in six Western European countries. Int J Epidemiol. 2003;32:830–837. doi: 10.1093/ije/dyg209. [DOI] [PubMed] [Google Scholar]
- 4.Chaix B, Bean K, Leal C, et al. Individual/neighborhood social factors and blood pressure in the RECORD Cohort Study which risk factors explain the associations? Hypertension. 2010;55:769–775. doi: 10.1161/HYPERTENSIONAHA.109.143206. [DOI] [PubMed] [Google Scholar]
- 5.Brummett BH, Babyak MA, Siegler IC, et al. Systolic blood pressure, socioeconomic status, and biobehavioral risk factors in a nationally representative US young adult sample. Hypertension. 2011;58:161–166. doi: 10.1161/HYPERTENSIONAHA.111.171272. [DOI] [PMC free article] [PubMed] [Google Scholar]
- 6.Marmot MG, Stansfeld S, Patel C, et al. Health inequalities among British civil servants: the Whitehall II study. Lancet. 1991;337:1387–1393. doi: 10.1016/0140-6736(91)93068-K. [DOI] [PubMed] [Google Scholar]
- 7.Jakovljević D, Sarti C, Sivenius J, et al. Socioeconomic status and ischemic stroke. Stroke. 2001;32:1492–1498. doi: 10.1161/01.STR.32.7.1492. [DOI] [PubMed] [Google Scholar]
- 8.Chaturvedi N, Jarrett J, Shipley MJ, Fuller JH. Socioeconomic gradient in morbidity and mortality in people with diabetes: cohort study findings from the Whitehall study and the WHO multinational study of vascular disease in diabetes. BMJ. 1998;316:100–105. doi: 10.1136/bmj.316.7125.100. [DOI] [PMC free article] [PubMed] [Google Scholar]
- 9.Kogevinas M, Marmot MG, Fox AJ, Goldblatt PO. Socioeconomic differences in cancer survival. J Epidemiol Community Health. 1991;45:216–219. doi: 10.1136/jech.45.3.216. [DOI] [PMC free article] [PubMed] [Google Scholar]
- 10.Adler NE. Socioeconomic status and health: the challenge of the gradient. Am Psychol. 1993;49:15. doi: 10.1037/0003-066X.49.1.15. [DOI] [PubMed] [Google Scholar]
- 11.Shimakawa T, Sorlie P, Carpenter MA, et al. Dietary intake patterns and sociodemographic factors in the atherosclerosis risk in communities study. Prev Med. 1994;23:769–780. doi: 10.1006/pmed.1994.1133. [DOI] [PubMed] [Google Scholar]
- 12.Winkleby MA, Fortmann SP, Barrett DC. Social class disparities in risk factors for disease: eight-year prevalence patterns by level of education. Prev Med. 1990;19:1–12. doi: 10.1016/0091-7435(90)90001-Z. [DOI] [PubMed] [Google Scholar]
- 13.Stunkard AJ, Sorensen TIA. Obesity and socioeconomic status—a complex relation. N Engl J Med. 1993;329:1036–1037. doi: 10.1056/NEJM199309303291411. [DOI] [PubMed] [Google Scholar]
- 14.Ford ES, Merritt RK, Heath GW, et al. Physical activity behaviors in lower and higher socioeconomic status populations. Am J Epidemiol. 1991;133:1246–1256. doi: 10.1093/oxfordjournals.aje.a115836. [DOI] [PubMed] [Google Scholar]
- 15.Nogueira A, Marcopito L, Lanas F, et al. Socio-economic status and risk factors for cardiovascular disease: a multicentre collaborative study in the International Clinical Epidemiology Network (INCLEN) J Clin Epidemiol. 1994;47:1401–1409. doi: 10.1016/0895-4356(94)90084-1. [DOI] [PubMed] [Google Scholar]
- 16.Reynes JF, Lasater TM, Feldman H, Assaf AR, Carleton RA. Education and risk factors for coronary heart disease: results from a New England community. Am J Prev Med. 1993;9:365. [PubMed] [Google Scholar]
- 17.Strand BH, Tverdal A. Can cardiovascular risk factors and lifestyle explain the educational inequalities in mortality from ischaemic heart disease and from other heart diseases? 26 year follow up of 50 000 Norwegian men and women. J Epidemiol Community Health. 2004;58:705–709. doi: 10.1136/jech.2003.014563. [DOI] [PMC free article] [PubMed] [Google Scholar]
- 18.Lantz PM, House JS, Lepkowski JM, et al. Socioeconomic factors, health behaviors, and mortality. JAMA. 1998;279:1703–1708. doi: 10.1001/jama.279.21.1703. [DOI] [PubMed] [Google Scholar]
- 19.Laaksonen M, Talala K, Martelin T, et al. Health behaviours as explanations for educational level differences in cardiovascular and all-cause mortality: a follow-up of 60 000 men and women over 23 years. Eur J Public Health. 2008;18:38–43. doi: 10.1093/eurpub/ckm051. [DOI] [PubMed] [Google Scholar]
- 20.Ng DM, Jeffery RW. Relationships between perceived stress and health behaviors in a sample of working adults. Heal Psychol. 2003;22:638–642. doi: 10.1037/0278-6133.22.6.638. [DOI] [PubMed] [Google Scholar]
- 21.Steptoe A, Wardle J, Pollard TM, Canaan L, Davies GJ. Stress, social support and health-related behavior: a study of smoking, alcohol consumption and physical exercise. J Psychosom Res. 1996;41:171–180. doi: 10.1016/0022-3999(96)00095-5. [DOI] [PubMed] [Google Scholar]
- 22.Steptoe A, Lipsey Z, Wardle J. Stress, hassles and variations in alcohol consumption, food choice and physical exercise: a diary study. Br J Heal Psychol. 1998;3:51–63. doi: 10.1111/j.2044-8287.1998.tb00555.x. [DOI] [Google Scholar]
- 23.Ameringer KJ, Leventhal AM. Applying the tripartite model of anxiety and depression to cigarette smoking: an integrative review. Nicotine Tob Res. 2010;12:1183–1194. doi: 10.1093/ntr/ntq174. [DOI] [PMC free article] [PubMed] [Google Scholar]
- 24.Conner KR, Pinquart M, Gamble SA. Meta-analysis of depression and substance use among individuals with alcohol use disorders. J Subst Abus Treat. 2009;37:127–137. doi: 10.1016/j.jsat.2008.11.007. [DOI] [PMC free article] [PubMed] [Google Scholar]
- 25.Strine TW, Chapman DP, Kobau R, Balluz L. Associations of self-reported anxiety symptoms with health-related quality of life and health behaviors. Soc Psychiatry Psychiatr Epidemiol. 2005;40:432–438. doi: 10.1007/s00127-005-0914-1. [DOI] [PubMed] [Google Scholar]
- 26.Hassan I, Ali R. The association between somatic symptoms, anxiety disorders and substance use. A literature review. Psychiatr Q. 2011;82:315–328. doi: 10.1007/s11126-011-9174-2. [DOI] [PubMed] [Google Scholar]
- 27.Jané-Llopis E, Matytsina I. Mental health and alcohol, drugs and tobacco: a review of the comorbidity between mental disorders and the use of alcohol, tobacco and illicit drugs. Drug Alcohol Rev. 2006;25:515–536. doi: 10.1080/09595230600944461. [DOI] [PubMed] [Google Scholar]
- 28.Leas L, McCabe M. Health behaviors among individuals with schizophrenia and depression. J Heal Psychol. 2007;12:563–579. doi: 10.1177/1359105307078162. [DOI] [PubMed] [Google Scholar]
- 29.Carey MP, Carey KB, Maisto SA, Gordon CM, Vanable PA. Prevalence and correlates of sexual activity and HIV-related risk behavior among psychiatric outpatients. J Consult Clin Psychol. 2001;69:846. doi: 10.1037/0022-006X.69.5.846. [DOI] [PMC free article] [PubMed] [Google Scholar]
- 30.Carey MP, Carey KB, Maisto SA, et al. HIV-risk behavior among outpatients at a state psychiatric hospital: prevalence and risk modeling. Behav Ther. 1999;30:389–406. doi: 10.1016/S0005-7894(99)80017-3. [DOI] [PMC free article] [PubMed] [Google Scholar]
- 31.Mazza M, Della Marca G, Mennuni GF, Bria P, Mazza S. Sleep disturbances and depression: a review. Minerva Psichiatr. 2005;46:175–188. [Google Scholar]
- 32.Kim E-J, Dimsdale JE. The effect of psychosocial stress on sleep: a review of polysomnographic evidence. Behav Sleep Med. 2007;5:256–278. doi: 10.1080/15402000701557383. [DOI] [PMC free article] [PubMed] [Google Scholar]
- 33.Wills TA, Shiffman S. Coping and substance use: a conceptual framework. Coping Subst Use. 1985;3–24.
- 34.Lazarus RS, Folkman S. Stress, Appraisal, and Coping. New York: Springer; 1984. [Google Scholar]
- 35.Dallman MF, Pecoraro N, Akana SF, et al. Chronic stress and obesity: a new view of “comfort food”. Proc Natl Acad Sci. 2003;100:11696. doi: 10.1073/pnas.1934666100. [DOI] [PMC free article] [PubMed] [Google Scholar]
- 36.Dallman MF, Pecoraro NC, la Fleur SE. Chronic stress and comfort foods: self-medication and abdominal obesity. Brain Behav Immun. 2005;19:275–280. doi: 10.1016/j.bbi.2004.11.004. [DOI] [PubMed] [Google Scholar]
- 37.Friedman EM, Hayney MS, Love GD, et al. Social relationships, sleep quality, and interleukin-6 in aging women. Proc Natl Acad Sci U S A. 2005;102:18757. doi: 10.1073/pnas.0509281102. [DOI] [PMC free article] [PubMed] [Google Scholar]
- 38.Parrott AC. Does cigarette smoking cause stress? Am Psychol. 1999;54:817–820. doi: 10.1037/0003-066X.54.10.817. [DOI] [PubMed] [Google Scholar]
- 39.Salmon P. Effects of physical exercise on anxiety, depression, and sensitivity to stress: a unifying theory. Clin Psychol Rev. 2001;21:33–61. doi: 10.1016/S0272-7358(99)00032-X. [DOI] [PubMed] [Google Scholar]
- 40.Connolly T, Zeelenberg M. Regret in decision making. Curr Dir Psychol Sci. 2002;11:212–216. doi: 10.1111/1467-8721.00203. [DOI] [Google Scholar]
- 41.Roese NJ, Epstude K, Fessel F, et al. Repetitive regret, depression, and anxiety: findings from a nationally representative survey. J Soc Clin Psychol. 2009;28:671–688. doi: 10.1521/jscp.2009.28.6.671. [DOI] [Google Scholar]
- 42.Peele S, Brodsky A. Exploring psychological benefits associated with moderate alcohol use: a necessary corrective to assessments of drinking outcomes? Drug Alcohol Depend. 2000;60:221–247. doi: 10.1016/S0376-8716(00)00112-5. [DOI] [PubMed] [Google Scholar]
- 43.Lipton RI. The effect of moderate alcohol use on the relationship between stress and depression. Am J Public Health. 1994;84:1913–1917. doi: 10.2105/AJPH.84.12.1913. [DOI] [PMC free article] [PubMed] [Google Scholar]
- 44.Benowitz NL. Pharmacology of nicotine: addiction and therapeutics. Annu Rev Pharmacol Toxicol. 1996;36:597–613. doi: 10.1146/annurev.pa.36.040196.003121. [DOI] [PubMed] [Google Scholar]
- 45.DiClemente RJ, Wingood GM, Crosby RA, et al. A prospective study of psychological distress and sexual risk behavior among black adolescent females. Pediatrics. 2001;108:e85. doi: 10.1542/peds.108.5.e85. [DOI] [PubMed] [Google Scholar]
- 46.Heinrich KM, Maddock J. Multiple health behaviors in an ethnically diverse sample of adults with risk factors for cardiovascular disease. Perm J. 2011;15:12–18. doi: 10.7812/tpp/10.082. [DOI] [PMC free article] [PubMed] [Google Scholar]
- 47.De Vries H, van’t Riet J, Spigt M, et al. Clusters of lifestyle behaviors: results from the Dutch SMILE study. Prev Med. 2008;46:203–208. doi: 10.1016/j.ypmed.2007.08.005. [DOI] [PubMed] [Google Scholar]
- 48.Dufour MC. What is moderate drinking? Defining “drinks” and drinking levels. Alcohol Res Health. 1999;23:10. [PMC free article] [PubMed] [Google Scholar]
- 49.Carey MP, Senn TE, Vanable PA, Coury-Doniger P, Urban MA. Brief and intensive behavioral interventions to promote sexual risk reduction among STD clinic patients: results from a randomized controlled trial. AIDS Behav. 2010;14:504–517. doi: 10.1007/s10461-009-9587-1. [DOI] [PMC free article] [PubMed] [Google Scholar]
- 50.Carey MP, Vanable PA, Senn TE, Coury-Doniger P, Urban MA. Evaluating a two-step approach to sexual risk reduction in a publicly-funded STI clinic: rationale, design, and baseline data from the Health Improvement Project-Rochester (HIP-R) Contemp Clin Trials. 2008;29:569–586. doi: 10.1016/j.cct.2008.02.001. [DOI] [PMC free article] [PubMed] [Google Scholar]
- 51.Fact Sheets: Binge Drinking. Atlanta, GA: Centers for Disease Control and Prevention; 2010. [Google Scholar]
- 52.Healthy People. Washington, D.C.: U.S. Department of Health and Human Services; 2020. p. 2010. [Google Scholar]
- 53.Civic D. College students’ reasons for nonuse of condoms within dating relationships. J Sex Marital Ther. 2000;26:95–105. doi: 10.1080/009262300278678. [DOI] [PubMed] [Google Scholar]
- 54.Physical Activity Guidelines for Americans. Washington, D.C.: U.S. Department of Health and Human Services; 2008. p. 2008. [Google Scholar]
- 55.van der Ploeg HP, Chey T, Korda RJ, Banks E, Bauman A. Sitting time and all-cause mortality risk in 222,497 Australian adults. Arch Intern Med. 2012;172:494–500. doi: 10.1001/archinternmed.2011.2174. [DOI] [PubMed] [Google Scholar]
- 56.National Health and Nutrition Examination Survey Questionnaire. Hyattsville, MD: U.S. Department of Health and Human Services, Centers for Disease Control and Prevention; 2008. [Google Scholar]
- 57.National Sleep Foundation. How much sleep do we really need? Retrieved September 6, 2012 from http://www.sleepfoundation.org/article/how-sleep-works/how-much-sleep-do-we-really-need.
- 58.Donovan JE, Jessor R, Costa FM. Adolescent health behavior and conventionality-unconventionality: an extension of problem-behavior therapy. Heal Psychol. 1991;10:52. doi: 10.1037/0278-6133.10.1.52. [DOI] [PubMed] [Google Scholar]
- 59.Gallant MP, Connell CM. Neuroticism and depressive symptoms among spouse caregivers: do health behaviors mediate this relationship? Psychol Aging. 2003;18:587–592. doi: 10.1037/0882-7974.18.3.587. [DOI] [PubMed] [Google Scholar]
- 60.Feldman P, Steptoe A. How neighborhoods and physical functioning are related: the roles of neighborhood socioeconomic status, perceived neighborhood strain, and individual health risk factors. Ann Behav Med. 2004;27:91–99. doi: 10.1207/s15324796abm2702_3. [DOI] [PubMed] [Google Scholar]
- 61.Helgeson VS, Novak SA, Lepore SJ, Eton DT. Spouse social control efforts: relations to health behavior and well-being among men with prostate cancer. J Soc Pers Relat. 2004;21:53–68. doi: 10.1177/0265407504039840. [DOI] [Google Scholar]
- 62.Kroenke K, Spitzer RL, Williams JBW. An ultra-brief screening scale for anxiety and depression: the PHQ-4. Psychosomatics. 2009;50:613–621. doi: 10.1176/appi.psy.50.6.613. [DOI] [PubMed] [Google Scholar]
- 63.Cohen S, Kamarck T, Mermelstein R. A global measure of perceived stress. J Health Soc Behav. 1983;385–396. [PubMed]
- 64.Rubin DB. Multiple Imputation for Nonresponse in Surveys. Hoboken, NJ: Wiley; 1987. [Google Scholar]
- 65.Schafer JL. Multiple imputation: A primer. Stat Methods Med Res. 1999;8(1):3–15 [DOI] [PubMed]
- 66.Graham JW, Olchowski AE, Gilreath TD. How many imputations are really needed? Some practical clarifications of multiple imputation theory. Prev Sci. 2007;8:206–213. doi: 10.1007/s11121-007-0070-9. [DOI] [PubMed] [Google Scholar]
- 67.Honaker J, King G, Blackwell M. Amelia II: a program for missing data. J Stat Softw. 2011;45:1–47. [Google Scholar]
- 68.Muthén LK, Muthén BO. Mplus User’s Guide (6 ed.). Los Angeles, CA: Muthén & Muthén, 1998–2012.
- 69.Curran PJ. A latent curve framework for the study of developmental trajectories in adolescent substance use. In: Rose JS, Chassin L, Presson CC, Sherman SJ, editors. Multivariate Applications in Substance Use Research. Mahwah, NJ, US: Lawrence Erlbaum Associates Publishers; 2000. pp. 1–42. [Google Scholar]
- 70.Reeves MJ, Rafferty AP. Healthy lifestyle characteristics among adults in the United States, 2000. Arch Intern Med. 2005;165:854–857. doi: 10.1001/archinte.165.8.854. [DOI] [PubMed] [Google Scholar]
- 71.Health, United States, 2011. Hyattsville, MD: National Center for Health Statistics; 2012. [PubMed] [Google Scholar]
- 72.Casagrande SS, Wang Y, Anderson C, Gary TL. Have Americans increased their fruit and vegetable intake? The trends between 1988 and 2002. Am J Prev Med. 2007;32:257–263. doi: 10.1016/j.amepre.2006.12.002. [DOI] [PubMed] [Google Scholar]
- 73.Kant AK, Graubard BI. Secular trends in patterns of self-reported food consumption of adult Americans: NHANES 1971–1975 to NHANES 1999–2002. Am J Clin Nutr. 2006;84:1215–1223. doi: 10.1093/ajcn/84.5.1215. [DOI] [PMC free article] [PubMed] [Google Scholar]
- 74.Lucan S, Mitra N. Perceptions of the food environment are associated with fast-food (not fruit-and-vegetable) consumption: findings from multi-level models. Int J Public Health. 2012;57:599–608. doi: 10.1007/s00038-011-0276-2. [DOI] [PubMed] [Google Scholar]
- 75.Seiffge-Krenke I, Klessinger N. Long-term effects of avoidant coping on adolescents’ depressive symptoms. J Youth Adolesc. 2000;29:617–630. doi: 10.1023/A:1026440304695. [DOI] [Google Scholar]
- 76.Moneyham L, Hennessy M, Sowell R, et al. The effectiveness of coping strategies used by HIV-seropositive women. Res Nurs Heal. 1998;21:351–362. doi: 10.1002/(SICI)1098-240X(199808)21:4<351::AID-NUR7>3.0.CO;2-E. [DOI] [PubMed] [Google Scholar]
- 77.Stall R, Friedman M, Catania JA. Interacting epidemics and gay men’s health: a theory of syndemic production among urban gay men. In: Wolitski RJ, Stall R, Valdiserri RO, editors. Unequal Opportunity: Health Disparities Affecting Gay and Bisexual Men in the United States. Oxford: Oxford University Press; 2008. pp. 251–274. [Google Scholar]
- 78.Singer MC, Erickson PI, Badiane L, et al. Syndemics, sex and the city: understanding sexually transmitted diseases in social and cultural context. Soc Sci Med. 2006;63:2010–2021. doi: 10.1016/j.socscimed.2006.05.012. [DOI] [PMC free article] [PubMed] [Google Scholar]
- 79.Senn TE, Carey MP, Vanable PA. The intersection of violence, substance use, depression, and STDs: testing of a syndemic pattern among patients attending an urban STD clinic. J Nat Med Assoc. 2010;102:614. doi: 10.1016/s0027-9684(15)30639-8. [DOI] [PMC free article] [PubMed] [Google Scholar]
- 80.Ickovics JR. “Bundling” HIV prevention: integrating services to promote synergistic gain. Prev Med. 2008;46:222–225. doi: 10.1016/j.ypmed.2007.09.006. [DOI] [PMC free article] [PubMed] [Google Scholar]
- 81.Jackson JS, Knight KM, Rafferty JA. Race and unhealthy behaviors: chronic stress, the HPA axis, and physical and mental health disparities over the life course. Am J Public Health. 2010; 100. [DOI] [PMC free article] [PubMed]
- 82.Mezuk B, Rafferty JA, Kershaw KN, et al. Reconsidering the role of social disadvantage in physical and mental health: stressful life events, health behaviors, race, and depression. Am J Epidemiol. 2010;172:1238–1249. doi: 10.1093/aje/kwq283. [DOI] [PMC free article] [PubMed] [Google Scholar]