

Abstract
Hepatitis C virus (HCV) is mostly transmitted through blood-to-blood contact during injection drug use via shared contaminated syringes/needles or injection paraphernalia. This paper used meta-analytic methods to assess whether HCV prevalence and incidence varied across different racial/ethnic groups of injection drug users (IDUs) sampled internationally. The 29 prevalence and 11 incidence studies identified as part of the HCV Synthesis Project were categorized into subgroups based on similar racial/ethnic comparisons. The effect estimate used was the odds or risk ratio comparing HCV prevalence or incidence rates in racial/ethnic minority groups versus those of majority status. For prevalence studies, the clearest disparity in HCV status was observed in the Canadian and Australian Aboriginal versus White comparison, followed by the US non-White versus White categories. Overall, Hispanic IDUs had greater HCV prevalence, and HCV prevalence in African-Americans was not significantly greater than that of Whites in the US. Aboriginal groups showed higher HCV seroconversion rates when compared to others, and African-Americans had lower seroconversion rates compared to other IDUs in the US. The findings suggest that certain minority groups have elevated HCV rates in comparison to other IDUs, which may be a consequence of stigma, discrimination, different risk behaviors or decreased access to health care, services and preventive education. Future research should seek to explicitly explore and explain racial/ethnic variations in HCV prevalence and incidence, and define the groups more precisely to allow for more accurate detection of possible racial/ethnic differences in HCV rates.
Keywords: Hepatitis C virus (HCV), Injection drug use (IDU), Race/ethnicity, Meta-analysis, Health disparities, Review
Hepatitis C virus (HCV) is hyperendemic in injection drug users (IDUs) (Hagan, 1998) and its prevalence in this population can reach levels of over 90% (McCarthy & Flynn, 2001). Chronic HCV can lead to cirrhosis, hepatocellular carcinoma, end-stage liver disease and death (Sulkowski & Thomas, 2005). HCV is transmitted most frequently through blood-to-blood contact during injection drug use (Alter & Moyer, 1998; Estrada, 2002) via sharing of contaminated syringes/needles (Hagan et al., 2001; Hahn, Page-Shafer, Lum, Ochoa, & Moss, 2001; Smyth, Barry, & Keenan, 2005; Thorpe, Bailey, Huo, Monterroso, & Ouellet, 2001; Thorpe et al., 2002) or injection paraphernalia (Cox, Lawless, Cassin, & Geoghegan, 2000; Hagan et al., 2001; Huo, Bailey, Garfein, & Ouellet, 2005; Maher et al., 2001).
In this paper, we ask whether HCV rates vary across racially or ethnically distinct IDU groups globally. As discussed below, we raise this question because (1) pronounced racial/ethnic differences exist in the prevalence of another injection-related infection – human immunodeficiency virus (HIV) – among IDUs (Friedman et al., 1999), which may also be reflected in HCV infection rates; and (2) systematically documenting the existence of racial/ethnic differences in HCV prevalence may strengthen scientific knowledge related to HCV etiology, and efforts to prevent its transmission. Defining “race” and “ethnicity” is challenging, particularly in a global context. We preface this discussion by defining these concepts.
Race and ethnicity are complex social constructs, therefore it is difficult to find a common definition that cuts across multiple societies. We consulted the guidelines of the “World Conference against Racism, Racial Discrimination, Xenophobia and Related Intolerance” (WCAR) (Durban, South Africa, 2001, http://www.un.org/WCAR/) to define these concepts in a global context. The guidelines identified racial minorities, migrants and indigenous peoples as individuals who experience social exclusion, persistent intolerance and discrimination due to their descent, color, and national or ethnic background.
Strides in the research of the HIV epidemic have revealed frameworks that could also be applied to understanding the etiology of HCV in IDUs. A number of studies have shown that HIV is distributed unevenly across racial/ethnic IDU groups in the US, with Blacks and Hispanics having disproportionately higher rates than Whites (Friedman et al., 1999; Haverkos, Turner, Moolchan, & Cadet, 1999; Kottiri, Friedman, Neaigus, Curtis, & Des Jarlais, 2002). Although trends of HIV infection in New York City showed declines in all groups between 1991 and 1996, Hispanics and Blacks were still significantly more likely to be infected compared to Whites over the course of six years (Friedman et al., 1999). Evidence of racial/ethnic disparities in HIV prevalence has also been recorded internationally. In the UK, between 1994 and 2000, there have been increases in new HIV diagnoses in the Black population, while the reverse was seen for Whites (Barry et al., 2002).
Given that HIV and HCV share common parenteral transmission routes (Hagan, Thiede, & Des Jarlais, 2005; Haydon et al., 1998; Huckans, Blackwell, Harms, Indest, & Hauser, 2005; Nyamathi et al., 2005; Sulkowski & Thomas, 2005; Zocratto et al., 2006), it is plausible that disparities in HCV distributions may also occur. Relatively few empirical studies, however, have examined the association between HCV infection and racial/ethnic membership among IDUs. For example, in Australia, (Maher, Li, Jalaludin, Chant, & Kaldor, 2007) although ethnic minority new injectors reported similar risk behaviors to their Anglo-Australian counterparts, they had considerably higher HCV seroconversion rates. Further, in the US, minority IDUs disproportionately account for cases of HIV/AIDS, HCV, HBV and tuberculosis (Estrada, 2002).
Documenting possible disparities in HCV across IDU groups has the potential to lay the foundation for further research intended to strengthen our scientific understanding of HCV etiology in IDUs. A large body of research has addressed health disparities, yielding diverse definitions, causes, prevention and intervention strategies (Carter-Pokras & Baquet, 2002). The term health disparity implies an injustice due to “unequal access to resources such as education, health care, clean air and water or … [living] in unhealthy conditions” (p. 429), resulting in uneven disease distribution. Underpinning such disparities may be societal vulnerability (Mann & Tarantola, 1996), a set of contextual factors that demarcate and limit personal and programmatic vulnerability. Vulnerability is a predisposition to risk due to individual, community or social conditions of disadvantage (including having a racial/ethnic minority status) (Ezard, 2001). For drug users, vulnerability encompasses both individual risks and reduced access to health care, services and prevention.
Increasingly, infectious disease transmission is being interpreted by use of social and structural level factors, which, although produced and reproduced at levels above the individual, have a profound impact on individual risk and/or protective behaviors (Miller & Neaigus, 2001; Rhodes, Singer, Bourgois, Friedman, & Strathdee, 2005). Individualistic frameworks used to explain the epidemiology and build the prevention of blood-borne viruses like HCV and HIV may not reduce risk behavior to a sufficient degree to achieve significant drops in infection rates (Rhodes et al., 2005). IDUs’ risk environments need to be considered, as they assume multiple level influences from interpersonal relationships to national or global policies. Rhodes et al. (2005) note that besides their independent impact on HIV transmission, structural factors like unequal racial/ethnic, social, economic, cultural and/or gender positions often converge to act concomitantly towards the reproduction of the HIV epidemic, placing some groups at a disadvantage. Poverty, which is often concentrated among specific racial/ethnic groups, has been documented to be a strong structural factor mediating HIV transmission and to be associated with higher density of IDUs and incident HIV infections (Rhodes et al., 2005). Impoverished communities tend to have reduced social cohesion and protective resources, but increased drug use and sexual risk.
Residential segregation, a purposeful strategy of spatial separation of groups to create dissimilar privilege, may also be linked to hypotheses of higher HCV rates in minority IDUs. Segregation has deep negative implications for minorities, including the creation of health disparities (Williams & Collins, 2001). Segregation is primarily a US phenomenon and a product of racism, which may create vulnerability to HCV. However, racism will manifest differently in different countries, and thus may produce country-specific vulnerabilities to HCV. Segregation in the US is an institutional act of racism that induces poverty, and reduces access to standard education, resources and employment opportunities for minority groups. Further, members of segregated communities (e.g., African-Americans and Latinos in the US) form distinct in-group networks, which often explain high rates of infectious disease.
Such risk and social networks are mechanisms for HIV and HCV transmission in IDUs (Friedman et al., 1997; Kottiri et al., 2002; Miller & Neaigus, 2001). Specifically, one’s social affiliations, and injection and sexual risk practices expose them to blood-borne viruses due to their contact with high risk in-group members. The latter in turn have connections with other members, associations that assure the effective transmission of HIV and HCV within these networks. Socializing, including injection practices and drug transactions, tends to take place through in-group connections and infrequently involves members of other groups (Friedman et al., 1999; Kottiri et al., 2002). Further, Miller and Neaigus (2001) state that large social networks with strong peer risk norms are good preservers of risk behaviors and are resistant to change, thus posing a challenge to interventions. This research has shed light on how transmission of blood-borne viruses is facilitated by one’s direct and indirect connections with other members within their own risk networks. Therefore, increased prevalence and incidence of infection can be perpetuated within specific racial/ethnic groups of lesser privilege in the US and other countries.
As has happened with HIV, documenting variability in HCV rates across racial/ethnic groups has important implications for directing prevention efforts where they may be scant or missing all together (Friedman et al., 1999). Inequitable distribution of health services, prevention and treatment leads to vulnerability that varies geographically and is a structural determinant of epidemics among poor and subordinated IDUs. Higher rates of HCV conversion in ethnic minorities in Australia were attributed to increased social isolation and limited knowledge of blood-borne viruses (Maher et al., 2007). Similarly, the increased cases of HIV/AIDS, HCV, HBV and tuberculosis in US minorities were associated with poorer access to health care, later disease detection, and costly treatments among racially/ethnically marginalized populations (Estrada, 2002). Thus, documenting racial/ethnic disparities in HCV infection in IDUs carries public health importance due to the implications it has for tailoring prevention and care programming to the needs of diverse groups, and ensuring that services are accessible to those in most need.
In this paper, we examine the available empirical evidence from the HCV Synthesis Project (Hagan et al., 2007; Scheinmann et al., 2007) to determine whether certain racial/ethnic groups bear a disproportionate burden of disease (Rhodes et al., 2005). Further, underprivilege based on one’s racial/ethnic identity is not a monolithic experience, and this paper seeks to systematically capture variations in HCV prevalence and incidence both across and within minority IDU groups inhabiting various national and global territories.
Methods
The HCV Synthesis Project overview
The data in this paper were collected during the NIDA-funded “Synthesis: A meta-analysis of HCV epidemiology and prevention in drug users” (the HCV Synthesis Project), which is a systematic review of international research examining the epidemiology and prevention of hepatitis C in drug-user populations. Published and unpublished studies from the US and other countries on the prevalence and incidence of HCV infection, the molecular epidemiology of HCV genotypes, and HCV co-infection with HIV, HBV and HAV in drug users were retrieved and coded. We retrieved reports released between January 1, 1989, when testing for HCV became available (Kuo et al., 1989), and December 31, 2006. Previous publications (Hagan et al., 2007; Scheinmann et al., 2007) describe the HCV Synthesis methods in further detail.
As noted in the introduction, we relied on the WCAR definition of race and ethnicity. Based upon this definition, the following groups of IDUs from our sample were examined: (1) racial/ethnic minorities: African-Americans or Hispanics in the US, the Roma in Bulgaria, Asians in Australia, non-Western Europeans in the Netherlands and non-Han groups in China; and (2) indigenous individuals: Aboriginals in Canada and Australia. In this paper we refer to those vulnerable and marginalized as “minority” groups and to their more advantaged counterparts as “majority” groups (even if the majority may be smaller in numbers than the minority).
We excluded from our statistical analyses subgroups or studies with vaguely described racial/ethnic categories (e.g., undifferentiated non-Aboriginal). In some cases, although the group definition was unclear, based on the PI’s and co-investigators’ knowledge of the study, we were able to estimate the composition of the group and included those cases in the analysis, such as ‘White/other’ (Hagan et al., 2001) or ‘non-White’ (Murrill et al., 2002). We also excluded subgroups that could not be classified with similar categories across the studies (e.g., American Indian/Pacific Islander). Some studies had overlapping data (e.g., originated from the same study sample), in which case only one study was chosen for analysis, based on the level of detail provided. Lastly, some studies reported data for distinct groups (e.g., White, Hispanic, African-American), while others grouped one or more racial/ethnic categories together (e.g., non-Western European including Turkish/Moroccan, Surinamese, Antillean and other IDU). For each metaanalysis, we selected groups that best fit our definitions of “minority” or “majority” status groups.
Three reports (Hagan, Vassilev, & Des Jarlais, 2006; van de Laar et al., 2005; Miller et al., 2006) contained more than one study because they provided data for different time periods or demographic characteristics. For example, van de Laar et al. (2005) provided data for the time periods of 1985–1989 and 2000–2004 for different samples (these appear in Table 1 as prevalence 1 and prevalence 2). Further, some reports had both a prevalence and incidence study and appear accordingly in our results and tables. Prevalence and incidence rates were abstracted from each study as given, or were calculated when a denominator and/or numerator of positive cases or percentage of positive cases were available. Self-reported HCV positive status was not considered reliable, therefore such studies were excluded all together from the HCV Synthesis sample. Only participants subjected to HCV antibody testing were included.
Table 1.
Study characteristics
| Study (study name) | Location | Dates | Recruitment method | Recruitment setting | Sample characteristics |
|---|---|---|---|---|---|
|
Prevalence studies
| |||||
| Bradshaw et al. (2005) | Melbourne, Australia | 1999–2002 | Street outreach | Needle exchange; street locations | Mean age =26 years; 4 years= median duration IDU =4 years; 63% male; 71% White, 11% Aboriginal, 7% Southeast Asian, 11% Other |
| Butler et al. (1999) | New South Wales, Australia | March– September 1996 |
Systematic | Correctional | 75.6% male; 29% Aboriginal, 71% non-Aboriginal |
| Des Jarlais et al. (2005) | New York, NY, USA | 2000–2001 | Systematic | Drug treatment center | 27% White, 54% Hispanic, 18% Black, 1% Other |
|
Garfein and Vlahov (1996)a (AIDS Link to Intravenous Experience) |
Baltimore, MD, USA | 1988–1992 | Self-referral; peer driven |
Drug treatment center; medical setting; STD clinic; HIV clinic; other community based organizations; correctional; street outreach; public housing |
Mean age= 28.6 years; 72.5% male; 88% Black, 12% Other |
|
Garfein et al. (1998) (Risk Evaluation Assessment of Community Health) |
Baltimore, MD, USA | 1994–1996 | Self-referral; street outreach |
Drug treatment center; public health clinic; medical setting; STD clinic; HIV clinic; other community based organizations; homeless shelters; street outreach |
Median age= 23.5 years; median duration IDU= 2.5 years; 46% male; 79% African-American, 21%, non-African-American |
| Gunn et al. (2003) | San Diego, CA, USA | 1999–2000 | 100% sample | STD clinic | 71% are at least 30 years old; 8% African-American, 91% Other |
| Gynarmathy, Neaigus, Miller, Friedman and Des Jarlais (2002) |
New York, NY, USA | 1996–2001 | Peer driven; street outreach |
Street locations | 71% male; 32% White, 45% Hispanic, 19% Black, 6% Other |
| Hagan et al. (2006) prevalence 1 | Sofia, Bulgaria | 2003–2004 | Street outreach; unspecified |
Drug treatment center; needle exchange | Mean age= 25.9 years; mean duration IDU =7.1 years; 80% male; 100% White |
| Hagan et al. (2006) prevalence 2 | Sofia, Bulgaria | 2003–2004 | Street outreach; Unspecified |
Drug treatment center; needle exchange | Mean age= 29.4 years; mean duration IDU =7.6 years; 76% male; 100% Roma |
| Hahn et al. (2001) UFO Study | San Francisco, CA, USA | 1997–1999 | Street outreach | Street locations; community based organizations |
Median age =22 years; median duration IDU= 5 years; 69% male; 77% White, 23% non-White |
| Kwiatkowski et al. (2002) | Denver, CO, USA | 1998–1999 | Street outreach | Street locations | Mean age= 34.09 years; mean duration IDU= 13.43 years; 63% male; 58% White, 42% non-White |
| Maher et al. (2004) | Sydney; Australia | 1999–2002 | Peer driven; street outreach |
Drug treatment center; medical setting; needle exchange; street locations; youth health service |
Mean age= 23.1 years; mean duration IDU= 4.3 years; 66% male; 66% White, 27% Asian, 7% Aboriginal |
| McCarthy and Flynn (2001) | Sacramento, CA, USA | Unspecified | 100% sample | Drug treatment center | 55% White, 17% Hispanic, 12% African-American, 16% Other |
|
Miller et al. (2002)a VIDUS (Vancouver Injection Drug User Study) |
Vancouver, Canada | 1996– unspecified |
Self-referral; street outreach |
Street locations | Median age =21 years; age range =13-24; 50% male; 24% Aboriginals; 76% non-Aboriginals |
| Miller et al. (2006) prevalence 1 VIDUS | Vancouver, Canada | 1996–2003 | Self-referral; street outreach |
Street locations | Median age =16 years; median duration IDU =5 years; 35% male; 100% Aboriginal |
| Miller et al. (2006) prevalence 2 VIDUS | Vancouver, Canada | 1996–2003 | Self-referral; street outreach |
Street locations | Median age =17 years; median duration IDU= 3 years; 55% male; 100% non-Aboriginal |
|
Murrill et al. (2002) (CDC National HIV Seroprevalence Studies) |
San Francisco, CA, USA | 1993–1994 | 100% sample | Drug treatment center | 67% male; 67% White, 33% non-White |
| Nyamathi et al. (2002) | Los Angeles, CA, USA | 1995–1999 | Peer driven; street outreach; referral from agencies |
Street locations; homeless shelters; other | 67% male; 67% White, 33% non-White |
| Ompad et al. (2002) REACH II | Baltimore, MD, USA | 1997–1999 | Self-referral; peer driven; street outreach |
Street locations | Mean age= 25.96 years; median duration IDU= 2.1 years; 33% male; 23% White; 77% African-American |
| Patrick et al. (2001) VIDUS | Vancouver, Canada | 1996–1999 | Street outreach | Street locations | Median age =34 years; median duration IDU= 11 years; 66% male; 60% White, 25% Aboriginal, and 15% Other |
| Ruan et al. (2004) | Sichuan Province, China | November 2002 |
Peer driven; street outreach |
Street locations | 83% male; 64% Han, 36% Other |
| Samuel et al. (2001) | Albuquerque, Clovis, Roswell, Hobbs, Carlsbad, and Las Cruces; New Mexico; USA |
1995–1997 | Self-referral; street outreach |
Street locations | Median age= 37 years; median duration IDU =17 years; 73% male; 18% White, 73% Hispanic, 5% African-American; 4% American Indian |
| Thomas (2006) | Multnomah County, OR, USA | January– August 2000 |
Unspecified | Drug treatment center; STD clinic; HIV clinic; correctional |
66% male; 76% White, 9% African-American, 6% Pacific Islander, 6% Aboriginal |
|
Thorpe et al. (2000) CIDUS II (Collaborative Injection Drug Users Study II) |
Chicago, IL, USA | 1997–1999 | Self-referral; peer driven; street outreach |
Street locations | Median duration IDU= 2 years; 65% males; 58% White, 22% Hispanic, 17% Black, 3% Other |
|
van de Laar et al. (2005) prevalence 1 (Amsterdam Cohort Studies) |
Amsterdam, The Netherlands | 1985–1989 | Peer driven; street outreach |
Drug treatment center; street locations; STD clinic |
44% male; 8% non-Western Europeans, 92% Western Europeans; 60% injected at least 4 years; 85% borrowed used needles |
|
van de Laar et al. (2005) prevalence 2 (Amsterdam Cohort Studies) |
Amsterdam, The Netherlands | 2000–2004 | Peer driven; street outreach |
Drug treatment center; street locations | 59% male; 18% non-Western Europeans, 82% Western Europeans; 50% injected at least 4 years; 44% borrowed used needles |
|
Wood et al. (2005) (Scientific Evaluation of Supervised Injecting) |
Vancouver, Canada | 2003–2004 | Systematic | Safer injection facility | 71% male; 18% Aboriginal, 82% Other |
| Wylie et al. (2006) | Winnipeg, Manitoba, Canada | 2003–2004 | Self-referral; peer driven |
Medical setting; street locations | 57% male; 35% White, 65% Aboriginal |
| Zeldis et al. (1992) | Sacramento, CA, USA | 1987–1989 | Self-referral | Drug treatment center | Mean age =33 years; 59% male; 74% White, 17% Hispanic, 5% African-American, 2% Asian, 1% American Indian/Pacific Islander, 1% Other |
| Zocratto et al. (2006) AJUDE | Sao Paulo; Sorocaba; Sao Jose do Rio Preto; Itajai; Porto Alegre; Brazil |
June 1998 | Targeted; street outreach |
Needle exchange | Mean age =29.25 years; 83% male; 50% White, 50% Other |
| Incidence studies | |||||
| Butler et al. (2004) | New South Wales, Australia | 1996 | Systematic | Correctional | 90% male; 35% Aboriginal, 65% Other |
| Des Jarlais et al. (2003)a CIDUS II | New York, NY, USA | 1997–1999 | Self-referral; peer driven; street outreach |
Street locations | N/A |
| Dolan et al. (2005) | Sydney, New South Wales, Australia | 1997–1998 | 100% sample | Correctional | 100% male |
|
Hagan et al. (1999)a RAVEN (Risk Activity Variables, Epidemiology, and Network Study) |
Seattle, WA, USA | 1994–1996 | Systematic | Drug treatment center; other community based organizations; correctional; drug use assessment agencies |
61% male; 77% White, 12% Black, 11% Other |
| Hagan et al. (2001) RAVEN | Seattle, WA, USA | 1994–1997 | Systematic | Drug treatment center; needle exchange; correctional; and street locations |
60% male; 18% African-American, 82% White/Other |
|
Hagan, Thiede and Des Jarlais (2004)a RAVEN |
Seattle, WA, USA | 1994–2001 | Systematic | Drug treatment center; other community based organizations; correctional; drug use assessment agencies |
62% male; 76% White, 14% African-American, 10% Other |
| Hahn et al. (2002) | San Francisco, CA, USA | 2000–2001 | Self-referral; peer driven; street outreach |
Street locations | 22 years= median age; 64% male; 80% White, 20% non-White |
| Maher et al. (2006) | New South Wales, Australia | 1999–2002 | Self-referral; street outreach |
Drug treatment center; STD clinic; street locations |
28% ethnic minorities, 72% non-minorities |
| Miller et al. (2002)a VIDUS | Vancouver, Canada | 1996– unspecified |
Self-referral; street outreach |
Street locations | 18% Canadian, 82% non-Aboriginal |
| Patrick et al. (2001) VIDUS | Vancouver, Canada | 1996–1999 | Street outreach | Street locations | Median age= 28 years; age range =15-55 years; median duration IDU= 7 years; 70% male; 54% White, 16% Aboriginal, and 30% Other |
| Thorpe et al. (2002) CIDUS II | Chicago, IL, USA | 1997–1999 | Self-referral; peer driven; street outreach |
Street locations | 64% male; 64% White, 12% Hispanic, 13% Black |
Not included in statistical analyses due to overlapping or insufficient data.
Quality measures
Guided by the MOOSE group’s recommendations (Stroup et al., 2000), a quality rating scale was developed and applied to each study. Based on previous meta-analyses (Navas-Acien et al., 2005; Thakkinstian et al., 2005), we developed two separate scales for prevalence and incidence studies to assess their methodology and data reporting. Examples from the scales include: (1) Were the selection criteria for the sample well defined and explained? (2) Were details of recruitment methods given? A full description of our non-injection drug users (NIDUs) quality scale items can be found in Scheinmann et al. (2007), which is identical to the IDU scale used in the current paper except for a few elements characteristic to NIDUs. The quality coding and scoring was done for each report by research associates (CLW and RS), and inconsistencies were resolved at staff meetings.
We performed Cronbach’s alpha reliability analyses to verify the scales’ internal consistency by using all the studies from the HCV Synthesis Project. The alpha values were 0.73 for prevalence and 0.71 for incidence studies, both of which reflecting adequate scale coherence. The distributions of quality scores for both prevalence and incidence were bimodal, and were recoded dichotomously by splitting between the modes. For prevalence studies (19 items), the modes were 12 and 16, the split was <14 versus ≥14, and the median was 16. Of the 29 prevalence studies in this analysis, 22 scored ≥14 (coded as 1) and seven scored <14 (coded as 0). For incidence studies (9 items), the median was 5, the mode was 6, and the split was <5 versus ≥5. Of the 11 incidence studies in this analysis, 10 scored ≥5 (coded as 1) and one scored <5 (coded as 0). The higher the quality score, the more rigorous the methodology, and reporting of research design, setting, sample, analyses and findings.
Statistical analysis
Study effects were categorized preliminarily into subgroups based on similar racial/ethnic comparisons (e.g., Black–White comparisons in the US, or Aboriginal–White comparisons in Canada and Australia). The effect estimate of the racial/ethnic comparison was the odds or risk ratio (OR or RR) (for prevalence and incidence studies, respectively) comparing the rates of HCV in the racial/ethnic ‘minority’ (vulnerable) group to the ‘majority’ (more privileged) group.
Effects were considered homogeneous if they were similar across studies, and heterogeneous if they were not. Identification of homogeneous subgroups for statistical analysis was an iterative process of graphical displays and statistical testing using the Comprehensive Meta-Analysis software (Borenstein, Hedges, Higgins, & Rothstein, 2005). Homogeneity of effects was tested statistically using Cochran’s Q and the I2 statistic (DerSimonian & Laird, 1986; Higgins & Thompson, 2002; Higgins, Thompson, Deeks, & Altman, 2003). For Q, homogeneity is confirmed by comparison with the chi-square distribution using standard significance criteria and is indicated by a non-significant result. I2 is a continuous measure of inconsistency of effects, and ranges from 0% to 100%; values below 50% indicate homogeneity (Higgins & Thompson, 2002).
Two-tailed z tests for the pooled ORs or RRs were also calculated. To maximize the generalizability of the results, we assumed random effects. We also explored statistical power and study quality scores as effect moderators in order to account for heterogeneity in the comparisons (Cooper & Hedges, 1994).
One incidence study (Patrick et al., 2001) only provided follow-up time per person averaged across all the racial-ethnic groups. Therefore, the average follow-up time was assumed to be equal across racial-ethnic groups for incidence calculations.
Power calculations
Each subgroup comparison was evaluated to determine whether adequate statistical power existed to detect a meaningful difference. Given that most of the studies did not have race/ethnicity associations as a stated research objective, we set values of 70% or above to indicate sufficient power. To represent an important difference between racial/ethnic groups, power was calculated using a two-tailed 0.05 significance level, and an odds ratio of 2.0 for prevalence, and a 10% change for incidence. Calculations were performed using NCSS/PASS software (Hintze, 2006), based on procedures for logistic regression (Hsieh, Block, & Larsen,1998), and case–control cohort data (Machin, Campbell, Fayers, & Pinol, 1997).
Results
Sample characteristics
The HCV Synthesis Project identified 29 prevalence and 11 incidence studies reporting HCV data by racial/ethnic categories (Table 1). The 40 studies represent a modest 6% of our entire HCV Synthesis sample. Furthermore, in only four reports (Bradshaw, Pierce, Tabrizi, Fairley, & Garland, 2005; Hagan et al., 2006; Miller et al., 2006; Thorpe, Ouellet, Levy, Williams, & Monterroso, 2000) was the examination of race/ethnicity in relation to HCV a stated objective. In the majority of studies, the participants were recruited from street locations, drug treatment programs and medical settings, via street outreach or self-referral.
Studies demographics
Sample sizes in the studies varied between 61 and 1345 for prevalence studies and from 29 to 484 for incidence studies. The majority of participants were males. Nine prevalence studies included young injectors only (30 years old and under) (Table 1). The majority of studies reporting age characteristics had samples with a mean/median age of 23–29 years old. Mean/median duration of injection was ≤3 years in three studies, 4–8 years in five studies and 11–17 years in three studies. Of the incidence studies, two reported median age of their sample and four studies included only young injectors (under the age of 30). One study reported the median duration of injection to be 7 years.
Prevalence studies
A stream of studies from the US shows higher HCV rates in non-Whites (Table 2). In Denver, non-White IDUs had a 79% HCV prevalence compared to 48% in White IDUs (Kwiatkowski, Corsi, & Booth, 2002). Non-Whites in San Francisco had higher HCV prevalence than Whites (87% versus 60%) (Murrill et al., 2002). One study reported 80% HCV prevalence for African-Americans and Hispanics, and 70% for Whites in Los Angeles (Nyamathi et al., 2002). In Oregon, White IDUs had lower HCV prevalence (51%) compared to African-Americans (76%) (Thomas, 2006). In Chicago,Thorpe et al. (2000) found the HCV prevalence distribution in young Hispanic, Black and White IDUs to be: 41%, 29% and 21%, respectively. Lower HCV rates in White IDUs (69%) than in Hispanics and African-Americans were found in Sacramento California (83% and 77%, respectively) (Zeldis et al., 1992). Exceptions to the above rates are two US studies showing no differences in HCV rates between Whites and non-Whites (Des Jarlais et al., 2005; McCarthy & Flynn, 2001). Further, four US studies presented higher HCV rates in White IDUs. In New Mexico, Hispanic/White, White, American Indian/Pacific Islander, and African-American IDUs had HCV prevalence rates of 86%, 77%, 68% and 53%, respectively (Samuel, Doherty, Bulterys, & Jenison, 2001). In San Francisco, Black IDUs had the lowest HCV rates compared to Whites, Hispanics and others: 33%, 45%, 42% and 48%, respectively (Hahn et al., 2001). Finally, African-American IDUs in Baltimore had considerably lower HCV prevalence compared to Whites and Whites/Others (Garfein et al., 1998; Ompad, Fuller, Vlahov, Thomas, & Strathdee, 2002).
Table 2.
HCV prevalence across diverse racial/ethnic IDU groups
| Study | Racial/ethnic category | Total IDU tested |
Prevalence (%) |
|---|---|---|---|
| US studies | |||
| Des Jarlais et al. (2005) | Black | 76 | 59.0 |
| Hispanic | 221 | 63.0 | |
| White | 111 | 65.0 | |
| Garfein et al. (1998) | African-American | 180 | 34.0 |
| Other | 49 | 51.0 | |
| Hahn et al. (2001) | Black | 6 | 33.3 |
| Hispanic | 12 | 41.7 | |
| White | 237 | 45.1 | |
| Other | 52 | 48.0 | |
| Kwiatkowski et al. (2002) | Non-Whitea | 67 | 79.1 |
| White | 91 | 48.4 | |
| McCarthy and Flynn (2001) | Hispanic/Mexican | 70 | 94.0 |
| African-American | 49 | 94.0 | |
| White | 227 | 96.0 | |
| Other | 67 | 96.0 | |
| Murrill et al. (2002) | Non-White | 117 | 87.0 |
| White | 238 | 60.0 | |
| Nyamathi et al. (2002) | African-American | 83 | 79.5 |
| Hispanic | 25 | 79.5 | |
| White | 43 | 70.0 | |
| Other | 2 | 100.0 | |
| Ompad et al. (2002) | White and Other | 24 | 62.5 |
| African-American | 82 | 37.8 | |
| Samuel et al. (2001) | American Indian/Pacific Islander |
– | 67.6 |
| Hispanic/White | – | 86.3 | |
| African-American | – | 53.3 | |
| White | – | 76.7 | |
| Thomas (2006) | Mixed heritage | 13 | 38.5 |
| Asian/Pacific Islander | 2 | 0.0 | |
| American Indian | 27 | 66.6 | |
| African-American | 42 | 76.2 | |
| White | 349 | 50.7 | |
| Other | 16 | 62.5 | |
| Thorpe et al. (2000) | Black | 118 | 28.8 |
| Hispanic | 155 | 41.3 | |
| White | 404 | 21.3 | |
| Other | 21 | 28.6 | |
| Zeldis et al. (1992) | African-American | 30 | 76.7 |
| Hispanic | 100 | 83.0 | |
| White | 430 | 69.3 | |
| Otherb | 25 | 68.0 | |
| Aboriginals in Canada and Australia | |||
| Bradshaw et al. (2005) | Mostly Middle Eastern & European |
35 | 71.0 |
| Southeast Asian | 22 | 55.0 | |
| Aboriginal | 34 | 94.0 | |
| White | 223 | 73.0 | |
| Butler et al. (1999) | Aboriginal | 96 | 65.6 |
| Non-Aboriginal | 232 | 75.4 | |
| Miller et al. (2006) | Non-Aboriginal | 211 | 37.9 |
| Aboriginal | 80 | 66.3 | |
| Patrick et al. (2001) | Aboriginal | 338 | 91.0 |
| Other | 199 | 63.0 | |
| White | 808 | 82.0 | |
| Wood et al. (2005) | Aboriginal | 123 | 90.2 |
| Other | 568 | 87.0 | |
| Wylie et al. (2006) | Aboriginal Canadian | 237 | 59.5 |
| White | 128 | 44.5 | |
| Other groups | |||
| Hagan et al. (2006) | White Bulgarians | 599 | 70.0 |
| prevalence 1 & 2 | Roma | 136 | 90.4 |
| Maher et al. (2004) | Non-Asianc | 270 | 31.5 |
| Asian | 102 | 50.0 | |
| Ruan et al. (2004) | Other (not Han) | 136 | 78.7 |
| Han | 243 | 66.6 | |
| van de Laar et al. (2005) | Non-Western Europeand | 16 | 87.5 |
| prevalence 1 | Western European | 173 | 90.8 |
| van de Laar et al. (2005) | Non-Western Europeand | 11 | 36.4 |
| prevalence 2 | Western European | 50 | 46.0 |
| Zocratto et al. (2006) | Non-White | 137 | 46.7 |
| White | 134 | 59.7 | |
Hispanic, African-Americans, Native Americans, and other ethnicity.
Asian Americans, Native Americans, and people whose ethnic origin could not be classified.
White and Aboriginals (mostly White).
Turkish/Moroccan, Surinamese, Antillean, and other.
In both Australia and Canada, Aboriginals consistently had the highest HCV prevalence rates (Bradshaw et al., 2005; Miller et al., 2006; Patrick et al., 2001; Wylie, Shah, & Jolly, 2006). Asians in Australia had increased HCV rates compared to non-Asians (Maher, Chant, Jalaludin, & Sargent, 2004). Roma IDUs in Bulgaria had higher HCV prevalence than White Bulgarians (Hagan et al., 2006), as did non-Han IDUs in China compared to the Han majority IDUs (Ruan et al., 2004).
Imprisoned Aboriginal IDUs had slightly lower rates compared to non-Aboriginals in Australia, although the referent group may have been a heterogeneous sample of low and higher risk individuals, including immigrants (Butler et al., 1999). In the Netherlands, van de Laar et al. (2005) found higher HCV prevalence in 1985–1989 and in 2000–2004 for Western European IDUs compared to that of non-Western Europeans (consisting of Turkish, Moroccan, Surinamese, Antilleans and other IDUs). In Brazil, Zocratto et al. (2006) found that non-White IDUs had lower HCV rates compared to White IDUs.
Prevalence studies meta-analyses
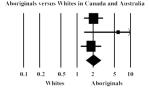
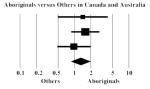
Aboriginals versus Whites in Canada and Australia
Three studies compared Aboriginal groups to Whites (Table 3). The summary OR for HCV prevalence among Aboriginals as compared to Whites was 2.04 (95% CI = 1.48, 2.82). The I2 of 12% and Q = 2.3, NS, indicate homogeneity in the comparison.
Table 3.
Meta-analyses of HCV prevalence and incidence in diverse racial/ethnic IDU groups
| Prevalence Studies | ||||||
|---|---|---|---|---|---|---|
| Study | Odds Ratio | Lower limit | Upper limit | Group Comparison | Qualitya | Powerb |
| Patrick el al., 2001 | 2.04 | 1.36 | 3.06 |
|
1 | 1 |
| Bradshaw el al.. 2005 | 5.89 | 1.37 | 25.33 | 1 | 0 | |
| Wylie et al., 2006 | 1.83 | 1.28 | 2.82 | 1 | 1 | |
| Random Effects | 2.04 | 1.48 | 2.82 | |||
| I2=12%; Q=2.3, NS | ||||||
| Hagan et al., 2006 | 4,06 | 2.24 | 7.39 |
|
1 | 1 |
| Maher et al., 2004 | 2.18 | 1.37 | 3.47 | 1 | 1 | |
| Ruan et al.. 2004 | 1.84 | 1.13 | 3.01 | 1 | 1 | |
| van de Laar et al.. 2005.1 | 0.71 | 0.15 | 3.42 | 1 | 0 | |
| van de Laar et al., 2005.2 | 0.67 | 0.17 | 2.58 | 1 | 0 | |
| Random Effects | 1.97 | 1.20 | 3.24 | |||
| I2=58%: Q=9.5, p=0.05 | ||||||
| Des Jarlais et al., 2005 | 0.79 | 0.43 | 1.43 |
|
0 | 0 |
| Hahn et al., 2001 | 0.61 | 0.11 | 3.38 | 1 | 0 | |
| McCarthy & Flynn 2001 | 0.56 | 0.14 | 2.19 | 0 | 0 | |
| Nyamathi et al., 2002 | 1.68 | 0.73 | 3.90 | 0 | 0 | |
| Thomas, 2006 | 3.1 i | 1.48 | 6.52 | 0 | 0 | |
| Thorpe et al.. 2000 | 1.50 | 0.94 | 2.38 | 1 | 1 | |
| Zeldis et al., 1992 | 1.46 | 0.61 | 3.48 | 1 | 0 | |
| Random Effects | 1.34 | 0.89 | 2.02 | |||
| I2=45%: Q= 10.9. p=0.09 | ||||||
| Des Jarlais et al., 2005 | 0.92 | 0.57 | 1.48 |
|
0 | 1 |
| Hahn et al., 2001 | 0.87 | 0.27 | 2.81 | 1 | 0 | |
| McCarthy & Flynn 2001 | 0.60 | 0.18 | 2.06 | 0 | 0 | |
| Nyamathi et al., 2002 | 1.73 | 0.53 | 5.62 | 0 | 0 | |
| Thorpe et al., 2000 | 2.60 | 1.75 | 3.87 | 1 | 1 | |
| Zeldis et al., 1992 | 2.16 | 1.23 | 3.79 | 1 | 1 | |
| Random Effects | 1.44 | 0.87 | 2.38 | |||
| I2=68%; Q=15.5, p=0.15 | ||||||
| Kwiatkowski et al., 2002 | 4.04 | 1.97 | 8.29 |
|
1 | 0 |
| Murrill et al., 2002 | 4.52 | 2.48 | 8.24 | 0 | 1 | |
| Random Effects | 4.32 | 2.72 | 6.84 | |||
| I2=0%; Q=0.1, NS | ||||||
|
| ||||||
| Incidence Studies | ||||||
|
| ||||||
| Study | Rate Ratio | Lower limit | Upper limit | Group Comparison | Qualitya | Powerb |
|
| ||||||
| Butler et al., 2004 | 1.43 | 0.50 | 4.12 |
|
0 | 0 |
| Patrick et al., 2001 | 1.59 | 0.88 | 2.88 | 1 | 0 | |
| Dolan et al., 2005 | 0.98 | 0.49 | 1.96 | 1 | - | |
| Random Effects | 1.31 | 0.87 | 1.99 | |||
| I2=0%; Q=1.1, NS | ||||||
| Thorpe etal.,2002 | 0.68 | 0.24 | 1.96 |
|
1 | 1 |
| Hagan et al., 2001 | 0.28 | 0.09 | 0.90 | 1 | 1 | |
| Random Effects | 0.45 | 0.19 | 1.08 | |||
| I2=18%: Q=1.2, NS | ||||||
Quality scores: 1 = ≥14, 0 = < 14
Power scores: 1 = sufficiently powered comparison. 0 = underpowered comparison
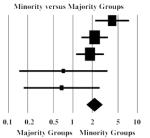
Ethnic minorities versus majority groups
This group had eight potential comparisons drawn from six studies that contrasted HCV in ethnic minorities to various local majority groups (Bradshaw et al., 2005; Hagan et al., 2006; van de Laar et al., 2005; Maher et al., 2004; Ruan et al., 2004; Zocratto et al., 2006). When all the groups were included in the analysis, the heterogeneity in the data was high (I2 = 82%) and the difference was not significant (data not shown). When we limited the meta-analysis to comparisons for which the composition of the contrasted groups was not ambiguous (see Methods section for details) (Hagan et al., 2006; van de Laar et al., 2005; Maher et al., 2004; Ruan et al., 2004), the effect size indicated higher HCV prevalence in minorities (OR = 1.97, 95% CI = 1.20, 3.24), I2 = 58% and Q = 9.5, p = 0.05.
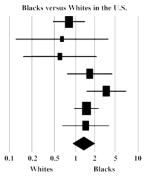
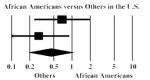
Blacks versus Whites in the US
Seven studies reported HCV prevalence in Black or African-American in contrast to White IDUs. The summary OR was 1.34 (95% CI = 0.89, 2.02), indicating that Blacks had marginally higher HCV prevalence, but the difference was not significant. Heterogeneity (I2 = 45%, Q = 10.9, p = 0.09) was reduced (I2 = 0%) when we selected only those studies meeting our quality criteria, but neither the pooled effect size nor statistical significance changed substantially (data not shown).
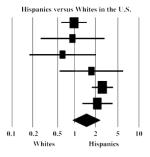
Hispanics versus Whites in the US
Six studies reported HCV prevalence data that allowed a Hispanic–White comparison, however, the associations were heterogeneous (I2 = 68% and Q = 15.5, p = 0.15) and the summary OR was 1.44 (95% CI = 0.87, 2.38). When studies with quality scores below 14 were removed, heterogeneity was reduced (I2 = 34%) and there was excess HCV prevalence among Hispanics (OR = 2.14, 95% CI = 1.39, 3.29) (data not shown).
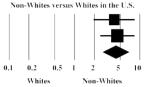
Non-Whites versus Whites in the US
Kwiatkowski et al. (2002) and Murrill et al. (2002) compared non-Whites versus Whites, the former including primarily Blacks and Hispanics. There was a strong significant effect size indicating higher HCV prevalence among non-White groups (OR = 4.32, 95% CI = 2.72, 6.84), and the data were homogeneous (I2 = 0% and Q = 0.1, NS). Overall statistical power was adequate (≥70%) for each pooled prevalence comparison.
Incidence studies
Of the 11 studies that reported HCV incidence in relation to race/ethnicity, only seven were included in our analyses (three had overlapping data and one did not report data relevant to our analyses). Four studies reported elevated HCV incidence rates in vulnerable groups (Table 4). In Australia, the incidence in Aboriginals was 24 per 100 Person Years (PY) versus 16.8 per 100 PY for non-Aboriginals, although the sample size was small (Butler, Kariminia, Levy, & Kaldor, 2004). In another Australian study, HCV incidence in ethnic minorities was 55.9 per 100 PY compared to 22 per 100 PY for non-ethnic minorities (Maher et al., 2006). In Canada, Aboriginals had an incidence of 58.4 per 100 PY compared to 42.9 per 100 PY for Whites (Patrick et al., 2001), and in Chicago, HCV incidence was 1.51 times higher in Hispanics versus Whites (95% CI = 0.63, 3.61) (Thorpe et al., 2002).
Table 4.
HCV incidence across diverse racial/ethnic IDU groups
| Study | Racial/ethnic category | Total IDU tested | HCV positive | Person Years | Incidence/100 PY |
|---|---|---|---|---|---|
| Butler et al. (2004) | Aboriginal | 10 | 6 | 25.0a | 24.0 |
| Non-Aboriginal | 19 | 8 | 47.6a | 16.8 | |
| Dolan et al. (2005) | Other | – | 28 | 130.0 | 22.0 |
| Aboriginal | – | 11 | 53.0 | 21.0 | |
| Hagan et al. (2001) | White/Other | 261 | 50 | 261.0 | 19.2 |
| African-American | 56 | 3 | 56.0 | 5.4 | |
| Hahn et al. (2002) | Non-White | 39 | 8 | 38.8a | 20.6 |
| White | 156 | 40 | 142.4a | 28.1 | |
| Maher et al. (2006) | Non-ethnic minority | 265 | 36 | 163.8 | 22.0 |
| Ethnic minority | 103 | 32 | 57.2 | 55.9 | |
| Patrick et al. (2001) | Aboriginal | 24 | 14 | 32.2b | 43.5a |
| Other | 47 | 12 | 63.1b | 19.0a | |
| White | 84 | 36 | 112.7b | 31.9a | |
| Thorpe et al. (2002) | African-American | 67 | 4 | 60.5a | 6.6a |
| Hispanic | 60 | 8 | 54.2a | 14.8a | |
| White | 226 | 17 | 204.2a | 8.3a |
Calculated.
Estimated.
Two US studies showed lower seroconversion rates in non-White IDUs. Specifically, HCV incidence in African-Americans and Whites/Others in Seattle were 5.4 per 100 PY and 19.2 per 100 PY, respectively (Hagan et al., 2001). In San Francisco, the HR for non-Whites versus Whites was 0.7 (95% CI = 0.4, 1.5) (Hahn et al., 2002). Two studies found no differences (Dolan et al., 2005; Thorpe et al., 2002).
Incidence studies meta-analyses
Two meta-analyses seemed conceptually feasible for incidence data. The first one consisted of Aboriginal IDUs versus others in Australia and Canada (Butler et al., 2004; Dolan et al., 2005; Patrick et al., 2001). Aboriginal groups had higher HCV seroconversion rates, although the difference was not statistically significant (RR = 1.31, 95% CI = 0.87, 1.99); there was no heterogeneity in the data (I2 = 0% and Q = 1.1, NS). In the second meta-analysis, we examined seroconversion rates in African-Americans versus other IDUs in the US (Hagan et al., 2001; Thorpe et al., 2002). There was no evidence of heterogeneity (I2 = 18% and Q = 1.2, NS), and African-Americans had lower seroincidence rates than other IDUs in the US, although the pooled effect lacked statistical significance (RR = 0.45, 95% CI = 0.20, 1.08). Overall statistical power for the pooled incidence comparisons was adequate (≥70%) for Aboriginals versus other IDUs in Australia and Canada, but not adequate for African-Americans versus other IDUs in the US.
Discussion and conclusions
By use of systematic reviews and meta-analytic methods, this paper examined whether HCV rates in IDUs varied across racial/ethnic groups, specifically asking if marginalized or vulnerable groups may present higher rates of HCV infection. It is extremely challenging to unpack the concept of race/ethnicity, as it encapsulates a conglomerate of social, economic, political and cultural forces. Given the international sample of studies included in our analyses, the particulars of what determines one’s position of disadvantage varied based on geography and unique histories of each minority group for which data were available. Our findings need to be interpreted with the awareness that although several groups may be classified as belonging to a minority group, their underlying characteristics and conditions may not yield homogeneous distributions of HCV infection.
From the HCV Synthesis Project database, we identified 29 prevalence and 11 incidence studies which presented HCV infection rates in diverse racial/ethnic IDUs groups; this represents only 6% of the studies on drug users and HCV in the database. Further, in only four reports was race/ethnicity a stated objective of the paper, indicating that little attention has been paid to studying HCV variation in relation to IDUs’ racial/ethnic membership. Given that only four out of the 40 studies intended to study race/ethnicity, publication bias may be ruled out. Further, when the four studies (Bradshaw et al., 2005; Hagan et al., 2006; Miller et al., 2006; Thorpe et al., 2000) were removed from analyses, the results did not change.
Several of our comparisons revealed marginal or significant heterogeneity, with some subsets of those yielding homogeneous and significant differences indicating excess HCV in minority IDUs. Given that we combined in the same meta-analyses groups from different countries and settings, with unique histories and racial/ethnic attributes, it could be argued that looking at these data in a meta-analytic manner would inevitably uncover heterogeneity. While a systematic review of these studies may have constituted an alternative to our meta-analyses, it seemed important to take on the challenging task of identifying groups who, due to a shared fundamental ideology of vulnerability and marginalization, are more susceptible to contracting HCV than their more privileged counterparts. As expected, heterogeneity was present, however, we were still able to identify homogeneous subsets, as well as prevalence and incidence suggestive of higher rates of HCV in minority groups. Further, it was often the case that analyses in which we only included studies that met our study quality criteria had reduced heterogeneity and revealed excess HCV rates in minority groups.
For prevalence studies, the clearest disparity in HCV status was observed in the Aboriginal versus White comparison, followed by the US non-White versus White comparison. Aboriginal groups in Canada and Australia also showed higher HCV seroconversion rates when compared to others. We excluded groups from the ethnic minorities meta-analysis whose composition we could not, at the very least, estimate. Studies with the most clearly defined racial/ethnic categories yielded the most homogeneous comparisons and higher HCV rates in minority groups. When studies with some degree of ambiguity were included, excess HCV prevalence among minorities was no longer observed and heterogeneity increased.
Overall, Hispanics in the US had elevated rates of HCV prevalence (Table 2), yet the difference in comparison to the White referent group was not significant (Table 3). However, the removal of studies with quality scores below 14 yielded a homogeneous analysis and showed higher HCV rates for Hispanics (Hahn et al., 2001; Thorpe et al., 2002; Zeldis et al., 1992). The fact that Hispanics in the US are a diverse group, depending on their country of origin, may explain the variations we observed. These results suggest that unless data become available to allow analyses for individual Hispanic subgroups, an overall Hispanic comparison may not generate reliable conclusions.
The US Black/African-American versus White/Others meta-analyses showed somewhat increased prevalence but decreased incidence in African-Americans, suggesting that longitudinal research is needed to elucidate the context and changing trends of HCV transmission in this US group. Cross-sectional prevalence studies do not control for differences in time at risk across racial/ethnic groups, which could generate confounding results. This may have occurred to some degree in our data. Kottiri et al. (2002) assessed HIV transmission in Black, Puerto Rican and White IDUs networks in New York City and found that HIV risk behavior was similar in Black and White IDUs. However, risk networks of Black, Puerto Rican and White IDUs were segregated, therefore implying different group risk behaviors and protective mechanisms, even when individual risk practices may be the same. Further, the background HIV prevalence was much higher for Black and Latino IDUs compared to Whites, therefore the same injection behaviors exposed the first two groups to more risk compared to White IDUs. The research targeting social networks has also explained similar differences in these groups’ sexually transmitted infections rates (Laumann & Youm, 1999).
There were limitations to our meta-analyses. Given our conceptual interest in race/ethnicity, we examined smaller subgroups of each study’s entire sample. Not all subgroup comparisons were sufficiently powered to enable the detection of possible racial/ethnic differences. The fact that HCV distribution in relation to race/ethnicity is studied on small scales and infrequently is in itself a finding, and we recommend that future studies undertake race/ethnicity as a principal focus. Further, 66% of the prevalence and incidence studies we examined comprised mostly of IDUs who belonged to majority groups. Significant differences between racial/ethnic groups may have been attenuated by disproportionate sample demographics. Our analyses were also limited by the lack of clear definitions of some racial/ethnic groups. We suspect that the inclusion of groups that may present different characteristics and risk behaviors could have either inflated or underestimated HCV rates. Lastly, given that the studies did not have elaborate conceptual models of race/ethnicity, our own conceptualization of this otherwise complex variable was to some extent restricted.
Aside from documenting unequal racial/ethnic distributions in HCV, it is also important that future research attempts to explain this variability to understand the multiple underlying determinants of HCV transmission, including social and structural differences among groups of injectors (Miller & Neaigus, 2001; Rhodes et al., 2005). For example, unequal health-related services are structural factors that need to be accounted for in epidemiology and are most likely strong predictors of higher disease rates (Diez-Roux, 1998) and unmet health care needs for minority groups (Wells, Klap, Koike, & Sherbourne, 2001). In the US, although a study looking at 94 metropolitan statistical areas (MSAs) found that the majority of the injecting population comprised of Whites, it was estimated that Blacks had an increased likelihood of injecting, while the Latino/White injection rates were similar, with certain disparities throughout the MSAs (Cooper, Friedman, Tempalski, Friedman, & Keem, 2005). The authors suggest further investigation of correlations between increased risk for injection (and therefore blood-borne infectious diseases transmission) and residential segregation (which is in turn associated with increased poverty, unemployment and decreased education quality and access to health services). Future research should however be cautious when making inferences about observed risk behaviors and varying HCV rates studied cross-sectionally, given that HCV differences could have occurred earlier and may not have a direct link to current risk behaviors. Knowledge generated by these research agendas could nonetheless inform policy and design of prevention and intervention for minority IDUs in different countries. Thus, prevention becomes a political task, as it necessitates profound structural and large scale changes intended to address inequalities, human rights and welfare (Rhodes et al., 2005).
Acknowledgments
This research was funded by NIDA Grant Number R01 DA018609. The authors would like to thank colleagues at the Center for Drug Use and HIV Research (funded by Grant Number P30 DA011041) for their support and assistance.
References
- Alter MJ, Moyer LA. The importance of preventing hepatitis C virus infection among injection drug users in the United States. Journal of Acquired Immune Deficiency Syndromes and Human Retrovirology. 1998;18(Suppl. 1):S6–S10. doi: 10.1097/00042560-199802001-00003. [DOI] [PubMed] [Google Scholar]
- Barry SM, Lloyd-Owen SJ, Madge SJ, Cozzi-Lepri A, Evans AJ, Phillips AN, et al. The changing demographics of new HIV diagnoses at a London centre from 1994 to 2000. HIV Medicine. 2002;3(2):129–134. doi: 10.1046/j.1468-1293.2002.00103.x. [DOI] [PubMed] [Google Scholar]
- Borenstein M, Hedges L, Higgins J, Rothstein H. Comprehensive metaanalysis. Biostat; Englewood, NJ: 2005. (Version 2) [Computer Program] [Google Scholar]
- Bradshaw CS, Pierce LI, Tabrizi SN, Fairley CK, Garland SM. Screening injecting drug users for sexually transmitted infections and blood borne viruses using street outreach and self collected sampling. Sexually Transmitted Infections. 2005;81(1):53–58. doi: 10.1136/sti.2004.009423. [DOI] [PMC free article] [PubMed] [Google Scholar]
- Butler T, Kariminia A, Levy M, Kaldor J. Prisoners are at risk for hepatitis C transmission. European Journal of Epidemiology. 2004;19(12):1119–1122. doi: 10.1007/s10654-004-1705-9. [DOI] [PubMed] [Google Scholar]
- Butler T, Spencer J, Cui J, Vickery K, Zou J, Kaldor J. Seroprevalence of markers for hepatitis B, C and G in male and female prisoners—NSW, 1996. Australian and New Zealand Journal of Public Health. 1999;23(4):377–384. doi: 10.1111/j.1467-842x.1999.tb01278.x. [DOI] [PubMed] [Google Scholar]
- Carter-Pokras O, Baquet C. What is a “health disparity”? Public Health Reports. 2002;117(5):426–434. doi: 10.1093/phr/117.5.426. [DOI] [PMC free article] [PubMed] [Google Scholar]
- Cooper H, Friedman SR, Tempalski B, Friedman R, Keem M. Racial/ethnic disparities in injection drug use in large US metropolitan areas. Annals of Epidemiology. 2005;15(5):326–334. doi: 10.1016/j.annepidem.2004.10.008. [DOI] [PubMed] [Google Scholar]
- Cooper H, Hedges LV, editors. The handbook of research synthesis. Russell Sage Foundation; New York, NY: 1994. [Google Scholar]
- Cox GM, Lawless MC, Cassin SP, Geoghegan TW. Syringe exchanges: a public health response to problem drug use. Irish Medical Journal. 2000;93(5):143–146. [PubMed] [Google Scholar]
- DerSimonian R, Laird N. Meta-analysis in clinical trials. Controlled Clinical Trials. 1986;7(3):177–188. doi: 10.1016/0197-2456(86)90046-2. [DOI] [PubMed] [Google Scholar]
- Des Jarlais DC, Perlis T, Arasteh K, Torian LV, Hagan H, Beatrice S, et al. Reductions in hepatitis C virus and HIV infections among injecting drug users in New York City, 1990–2001. AIDS. 2005;19(Suppl. 3):S20–S25. doi: 10.1097/01.aids.0000192066.86410.8c. [DOI] [PubMed] [Google Scholar]
- Des Jarlais DC, Diaz T, Perlis T, Vlahov D, Maslow C, Latka M, et al. Variability in the incidence of human immunodeficiency virus, hepatitis B virus, and hepatitis C virus infection among young injecting drug users in New York City. Am J Epidemiol. 2003;157(5):467–471. doi: 10.1093/aje/kwf222. [DOI] [PubMed] [Google Scholar]
- Diez-Roux AV. Bringing context back into epidemiology: variables and fallacies in multilevel analysis. American Journal of Public Health. 1998;88(2):216–222. doi: 10.2105/ajph.88.2.216. [DOI] [PMC free article] [PubMed] [Google Scholar]
- Dolan KA, Shearer J, White B, Zhou J, Kaldor J, Wodak AD. Four-year follow-up of imprisoned male heroin users and methadone treatment: mortality, re-incarceration and hepatitis C infection. Addiction. 2005;100(6):820–828. doi: 10.1111/j.1360-0443.2005.01050.x. [DOI] [PubMed] [Google Scholar]
- Estrada AL. Epidemiology of HIV/AIDS, hepatitis B, hepatitis C, and tuberculosis among minority injection drug users. Public Health Reports. 2002;117(Suppl. 1):S126–S134. [PMC free article] [PubMed] [Google Scholar]
- Ezard N. Public health, human rights and the harm reduction paradigm: from risk reduction to vulnerability reduction. The International Journal on Drug Policy. 2001;12(3):207–219. [Google Scholar]
- Friedman SR, Chapman TF, Perlis TE, Rockwell R, Paone D, Sotheran JL, et al. Similarities and differences by race/ethnicity in changes of HIV seroprevalence and related behaviors among drug injectors in New York City, 1991–1996. Journal of Acquired Immune Deficiency Syndromes. 1999;22(1):83–91. doi: 10.1097/00042560-199909010-00011. [DOI] [PubMed] [Google Scholar]
- Friedman SR, Neaigus A, Jose B, Curtis R, Goldstein M, Ildefonso G, et al. Sociometric risk networks and risk for HIV infection. American Journal of Public Health. 1997;87(8):1289–1296. doi: 10.2105/ajph.87.8.1289. [DOI] [PMC free article] [PubMed] [Google Scholar]
- Garfein RS, Vlahov D, Galai N, Doherty MC, Nelson KE. Viral infections in short-term injection drug users: The prevalence of the hepatitis C, hepatitis B, human immunodeficiency and human T-lymphotropic viruses. American Journal of Public Health. 1996;86(5):655–661. doi: 10.2105/ajph.86.5.655. [DOI] [PMC free article] [PubMed] [Google Scholar]
- Garfein RS, Doherty MC, Monterroso ER, Thomas DL, Nelson KE, Vlahov D. Prevalence and incidence of hepatitis C virus infection among young adult injection drug users. Journal of Acquired Immune Deficiency Syndromes and Human Retrovirology. 1998;18(Suppl. 1):S11–S19. doi: 10.1097/00042560-199802001-00004. [DOI] [PubMed] [Google Scholar]
- Gunn RA, Murray PJ, Brennan CH, Callahan DB, Alter MJ, Margolis HS. Evaluation of screening criteria to identify persons with hepatitis C virus infection among sexually transmitted disease clinic clients: results from the San Diego Viral Hepatitis Integration Project. Sex Transm Dis. 2003;30(4):340–344. doi: 10.1097/00007435-200304000-00013. [DOI] [PubMed] [Google Scholar]
- Gyarmathy VA, Neaigus A, Miller M, Friedman SR, Des Jarlais DC. Risk correlates of prevalent HIV, hepatitis B virus, and hepatitis C virus infections among noninjecting heroin users. JAIDS. 2002;30(4):448–456. doi: 10.1097/00042560-200208010-00011. [DOI] [PubMed] [Google Scholar]
- Hagan H. Hepatitis C virus transmission dynamics in injection drug users. Substance Use & Misuse. 1998;33(5):1197–1212. doi: 10.3109/10826089809062214. [DOI] [PubMed] [Google Scholar]
- Hagan H, McGough JP, Thiede H, Weiss NS, Hopkins S, Alexander ER. Syringe exchange and risk of infection with hepatitis B and C viruses. American Journal of Epidemiology. 1999;149(3):203–213. doi: 10.1093/oxfordjournals.aje.a009792. [DOI] [PubMed] [Google Scholar]
- Hagan H, Des Jarlais DC, Stern R, Lelutiu-Weinberger C, Scheinmann R, Strauss S, et al. HCV synthesis project: preliminary analyses of HCV prevalence in relation to age and duration of injection. The International Journal on Drug Policy. 2007;18(5):341–351. doi: 10.1016/j.drugpo.2007.01.016. [DOI] [PubMed] [Google Scholar]
- Hagan H, Thiede H, Des Jarlais DC. Hepatitis C virus infection among injection drug users: survival analysis of time to seroconversion. Epidemiology. 2004;15(5):543–549. doi: 10.1097/01.ede.0000135170.54913.9d. [DOI] [PubMed] [Google Scholar]
- Hagan H, Thiede H, Des Jarlais DC. HIV/hepatitis C virus co-infection in drug users: risk behavior and prevention. AIDS. 2005;19(Suppl. 3):S199–S207. doi: 10.1097/01.aids.0000192090.61753.d4. [DOI] [PubMed] [Google Scholar]
- Hagan H, Thiede H, Weiss NS, Hopkins SG, Duchin JS, Alexander ER. Sharing of drug preparation equipment as a risk factor for hepatitis C. American Journal of Public Health. 2001;91(1):42–46. doi: 10.2105/ajph.91.1.42. [DOI] [PMC free article] [PubMed] [Google Scholar]
- Hagan H, Vassilev Z, Des Jarlais DC. Needle exchange use, sexual risk behavior, and the prevalence of HIV, HBV, and HCV infections among Bulgarian injection drug users. 2006. Unpublished manuscript. [DOI] [PubMed]
- Hahn JA, Page-Shafer K, Lum PJ, Bourgois P, Stein E, Evans JL, et al. Hepatitis C virus seroconversion among young injection drug users: relationships and risks. Journal of Infectious Diseases. 2002;186(11):1558–1564. doi: 10.1086/345554. [DOI] [PubMed] [Google Scholar]
- Hahn JA, Page-Shafer K, Lum PJ, Ochoa K, Moss AR. Hepatitis C virus infection and needle exchange use among young injection drug users in San Francisco. Hepatology. 2001;34(1):180–187. doi: 10.1053/jhep.2001.25759. [DOI] [PubMed] [Google Scholar]
- Haverkos HW, Turner JF, Jr., Moolchan ET, Cadet JL. Relative rates of AIDS among racial/ethnic groups by exposure categories. Journal of the National Medical Association. 1999;91(1):17–24. [PMC free article] [PubMed] [Google Scholar]
- Haydon GH, Flegg PJ, Blair CS, Brettle RP, Burns SM, Hayes PC. The impact of chronic hepatitis C virus infection on HIV disease and progression in intravenous drug users. European Journal of Gastroenterology & Hepatology. 1998;10(6):485–489. doi: 10.1097/00042737-199806000-00009. [DOI] [PubMed] [Google Scholar]
- Higgins JP, Thompson SG. Quantifying heterogeneity in a meta-analysis. Statistics in Medicine. 2002;21(11):1539–1558. doi: 10.1002/sim.1186. [DOI] [PubMed] [Google Scholar]
- Higgins JP, Thompson SG, Deeks JJ, Altman DG. Measuring inconsistency in meta-analyses. BMJ. 2003;327(7414):557–560. doi: 10.1136/bmj.327.7414.557. [DOI] [PMC free article] [PubMed] [Google Scholar]
- Hintze J. NCSS, PASS, and GESS. NCSS; Kaysville, UT: 2006. (Version 2) [Computer Program] [Google Scholar]
- Hsieh FY, Block DA, Larsen MD. A simple method of sample size calculation for linear and logistic regression. Statistics in Medicine. 1998;17:1623–1634. doi: 10.1002/(sici)1097-0258(19980730)17:14<1623::aid-sim871>3.0.co;2-s. [DOI] [PubMed] [Google Scholar]
- Huckans MS, Blackwell AD, Harms TA, Indest DW, Hauser P. Integrated hepatitis C virus treatment: addressing comorbid substance use disorders and HIV infection. AIDS. 2005;19(Suppl. 3):S106–S115. doi: 10.1097/01.aids.0000192078.49185.b0. [DOI] [PubMed] [Google Scholar]
- Huo D, Bailey SL, Garfein RS, Ouellet LJ. Changes in the sharing of drug injection equipment among street-recruited injection drug users in Chicago, Illinois, 1994–1996. Substance Use & Misuse. 2005;40(1):63–76. doi: 10.1081/ja-200030495. [DOI] [PubMed] [Google Scholar]
- Kottiri BJ, Friedman SR, Neaigus A, Curtis R, Des Jarlais DC. Risk networks and racial/ethnic differences in the prevalence of HIV infection among injection drug users. Journal of Acquired Immune Deficiency Syndromes. 2002;30(1):95–104. doi: 10.1097/00042560-200205010-00013. [DOI] [PubMed] [Google Scholar]
- Kuo G, Choo QL, Alter HJ, Gitnick GL, Redeker AG, Purcell RH, et al. An assay for circulating antibodies to a major etiologic virus of human non-A, non-B hepatitis. Science. 1989;244(4902):362–364. doi: 10.1126/science.2496467. [DOI] [PubMed] [Google Scholar]
- Kwiatkowski CF, Corsi KF, Booth RE. The association between knowledge of hepatitis C virus status and risk behaviors in injection drug users. Addiction. 2002;97(10):1289–1294. doi: 10.1046/j.1360-0443.2002.00208.x. [DOI] [PubMed] [Google Scholar]
- van de Laar TJ, Langendam MW, Bruisten SM, Welp EA, Verhaest I, van Ameijden EJ, et al. Changes in risk behavior and dynamics of hepatitis C virus infections among young drug users in Amsterdam, the Netherlands. Journal of Medical Virology. 2005;77(4):509–518. doi: 10.1002/jmv.20486. [DOI] [PubMed] [Google Scholar]
- Laumann EO, Youm Y. Racial/ethnic group differences in the prevalence of sexually transmitted diseases in the United States: a network explanation. Sexually Transmitted Diseases. 1999;26(5):250–261. doi: 10.1097/00007435-199905000-00003. [DOI] [PubMed] [Google Scholar]
- Machin D, Campbell M, Fayers P, Pinol A. Sample size tables for clinical studies. 2nd ed Blackwell Science; Malden, MA: 1997. [Google Scholar]
- Maher L, Chant K, Jalaludin B, Sargent P. Risk behaviors and antibody hepatitis B and C prevalence among injecting drug users in south-western Sydney, Australia. Journal of Gastroenterology and Hepatology. 2004;19(10):1114–1120. doi: 10.1111/j.1440-1746.2004.03438.x. [DOI] [PubMed] [Google Scholar]
- Maher L, Jalaludin B, Chant KG, Jayasuriya R, Sladden T, Kaldor JM, et al. Incidence and risk factors for hepatitis C seroconversion in injecting drug users in Australia. Addiction. 2006;101(10):1499–1508. doi: 10.1111/j.1360-0443.2006.01543.x. [DOI] [PubMed] [Google Scholar]
- Maher L, Li J, Jalaludin B, Chant KG, Kaldor JM. High hepatitis C incidence in new injecting drug users: a policy failure? Australian and New Zealand Journal of Public Health. 2007;31(1):30–35. doi: 10.1111/j.1753-6405.2007.00007.x. [DOI] [PubMed] [Google Scholar]
- Maher L, Sargent P, Higgs P, Crofts N, Kelsall J, Le TT. Risk behaviours of young Indo-Chinese injecting drug users in Sydney and Melbourne. Australian and New Zealand Journal of Public Health. 2001;25(1):50–54. doi: 10.1111/j.1467-842x.2001.tb00550.x. [DOI] [PubMed] [Google Scholar]
- Mann J, Tarantola DJM, editors. AIDS in the World II. 2nd ed Oxford University Press; New York, NY, USA: 1996. [Google Scholar]
- McCarthy JJ, Flynn N. Hepatitis C in methadone maintenance patients: prevalence and public policy implications. Journal of Addictive Diseases. 2001;20(1):19–31. doi: 10.1300/J069v20n01_03. [DOI] [PubMed] [Google Scholar]
- Miller CL, Johnston C, Spittal PM, Li K, LaLiberte N, Montaner JSG, Schechter MT. Opportunities for prevention: hepatitis C prevalence and incidence in a cohort of young injection drug users. Hepatology. 2002;36(3):737–742. doi: 10.1053/jhep.2002.35065. [DOI] [PubMed] [Google Scholar]
- Miller CL, Strathdee SA, Spittal PM, Kerr T, Li K, Schechter MT, et al. Elevated rates of HIV infection among young Aboriginal injection drug users in a Canadian setting. Harm Reduction Journal. 2006;3:9. doi: 10.1186/1477-7517-3-9. [DOI] [PMC free article] [PubMed] [Google Scholar]
- Miller M, Neaigus A. Networks, resources and risk among women who use drugs. Social Science & Medicine. 2001;52(6):967–978. doi: 10.1016/s0277-9536(00)00199-4. [DOI] [PubMed] [Google Scholar]
- Murrill CS, Weeks H, Castrucci BC, Weinstock HS, Bell BP, Spruill C, et al. Age-specific seroprevalence of HIV, hepatitis B virus, and hepatitis C virus infection among injection drug users admitted to drug treatment in 6 US cities. American Journal of Public Health. 2002;92(3):385–387. doi: 10.2105/ajph.92.3.385. [DOI] [PMC free article] [PubMed] [Google Scholar]
- Navas-Acien A, Sharrett AR, Silbergeld EK, Schwartz BS, Nachman KE, Burke TA, et al. Arsenic exposure and cardiovascular disease: a systematic review of the epidemiologic evidence. American Journal of Epidemiology. 2005;162(11):1037–1049. doi: 10.1093/aje/kwi330. [DOI] [PubMed] [Google Scholar]
- Nyamathi AM, Christiani A, Windokun F, Jones T, Strehlow A, Shoptaw S. Hepatitis C virus infection, substance use and mental illness among homeless youth: a review. AIDS. 2005;19(Suppl. 3):S34–S40. doi: 10.1097/01.aids.0000192068.88195.27. [DOI] [PubMed] [Google Scholar]
- Nyamathi AM, Dixon EL, Robbins W, Smith C, Wiley D, Leake B, et al. Risk factors for hepatitis C virus infection among homeless adults. Journal of General Internal Medicine. 2002;17:134–143. doi: 10.1046/j.1525-1497.2002.10415.x. [DOI] [PMC free article] [PubMed] [Google Scholar]
- Ompad DC, Fuller CM, Vlahov D, Thomas D, Strathdee SA. Lack of behavior change after disclosure of hepatitis C virus infection among young injection drug users in Baltimore, Maryland. Clinical Infectious Diseases. 2002;35:783–788. doi: 10.1086/342063. [DOI] [PubMed] [Google Scholar]
- Patrick DM, Tyndall MW, Cornelisse PGA, Li K, Sherlock CH, Rekart ML, et al. Incidence of hepatitis C virus infection among injection drug users during an outbreak of HIV infection. Canadian Medical Association Journal. 2001;165(7):889–895. [PMC free article] [PubMed] [Google Scholar]
- Rhodes T, Singer M, Bourgois P, Friedman SR, Strathdee SA. The social structural production of HIV risk among injecting drug users. Social Science & Medicine. 2005;61(5):1026–1044. doi: 10.1016/j.socscimed.2004.12.024. [DOI] [PubMed] [Google Scholar]
- Ruan YH, Hong KX, Liu SZ, He YX, Zhou F, Qin GM, et al. Community-based survey of HCV and HIV coinfection in injection drug abusers in Sichuan Province of China. World Journal of Gastroenterology. 2004;10(11):1589–1593. doi: 10.3748/wjg.v10.i11.1589. [DOI] [PMC free article] [PubMed] [Google Scholar]
- Samuel MC, Doherty PM, Bulterys M, Jenison SA. Association between heroin use, needle sharing and tattoos received in prison with hepatitis B and C positivity among street-recruited injecting drug users in New Mexico, USA. Epidemiology and Infection. 2001;127(3):475–484. doi: 10.1017/s0950268801006197. [DOI] [PMC free article] [PubMed] [Google Scholar]
- Scheinmann R, Hagan H, Lelutiu-Weinberger C, Stern R, Des Jarlais DC, Flom PL, et al. Non-injection drug use and hepatitis C virus: a systematic review. Drug and Alcohol Dependence. 2007;89(1):1–12. doi: 10.1016/j.drugalcdep.2006.11.014. [DOI] [PMC free article] [PubMed] [Google Scholar]
- Smyth BP, Barry J, Keenan E. Irish injecting drug users and hepatitis C: the importance of the social context of injecting. International Journal of Epidemiology. 2005;34(1):166–172. doi: 10.1093/ije/dyh347. [DOI] [PubMed] [Google Scholar]
- Stroup DF, Berlin JA, Morton SC, Olkin I, Williamson GD, Rennie D, et al. Meta-analysis Of Observational Studies in Epidemiology (MOOSE) group Meta-analysis of observational studies in epidemiology: a proposal for reporting. JAMA. 2000;283(15):2008–2012. doi: 10.1001/jama.283.15.2008. [DOI] [PubMed] [Google Scholar]
- Sulkowski MS, Thomas DL. Perspectives on HIV/hepatitis C virus co-infection, illicit drug use and mental illness. AIDS. 2005;19(Suppl. 3):S8–S12. doi: 10.1097/01.aids.0000192064.09281.48. [DOI] [PubMed] [Google Scholar]
- Thakkinstian A, McEvoy M, Minelli C, Gibson P, Hancox B, Duffy D, et al. Systematic review and meta-analysis of the association between {beta}2-adrenoceptor polymorphisms and asthma: a HuGE review. American Journal of Epidemiology. 2005;162(3):201–211. doi: 10.1093/aje/kwi184. [DOI] [PubMed] [Google Scholar]
- Thomas A. Multnomah county hepatitis C. 2006 Unpublished manuscript. [Google Scholar]
- Thorpe LE, Bailey SL, Huo D, Monterroso ER, Ouellet LJ. Injection-related risk behaviors in young urban and suburban injection drug users in Chicago (1997–1999) Journal of Acquired Immune Deficiency Syndromes. 2001;27(1):71–78. doi: 10.1097/00126334-200105010-00012. [DOI] [PubMed] [Google Scholar]
- Thorpe LE, Ouellet LJ, Hershow R, Bailey SL, Williams IT, Williamson J, et al. Risk of hepatitis C virus infection among young adult injection drug users who share injection equipment. American Journal of Epidemiology. 2002;155(7):645–653. doi: 10.1093/aje/155.7.645. [DOI] [PubMed] [Google Scholar]
- Thorpe LE, Ouellet LJ, Levy JR, Williams IT, Monterroso ER. Hepatitis C virus infection: prevalence, risk factors, and prevention opportunities among young injection drug users in Chicago, 1997–1999. Journal of Infectious Diseases. 2000;182(6):1588–1594. doi: 10.1086/317607. [DOI] [PubMed] [Google Scholar]
- Wells K, Klap R, Koike A, Sherbourne C. Ethnic disparities in unmet need for alcoholism, drug abuse, and mental health care. American Journal of Psychiatry. 2001;158(12):2027–2032. doi: 10.1176/appi.ajp.158.12.2027. [DOI] [PubMed] [Google Scholar]
- Williams DR, Collins C. Racial residential segregation: a fundamental cause of racial disparities in health. Public Health Reports. 2001;116(5):404–416. doi: 10.1093/phr/116.5.404. [DOI] [PMC free article] [PubMed] [Google Scholar]
- Wood E, Kerr T, Stoltz J, Qui Z, Zhang R, Montaner JS, Tyndall MW. Prevalence and correlates of hepatitis C infection among users of North America’s first medically supervised safer injection facility. Public Health. 2005;119(12):1111–1115. doi: 10.1016/j.puhe.2005.05.006. [DOI] [PubMed] [Google Scholar]
- Wylie JL, Shah L, Jolly AM. Demographic, risk behaviour and personal network variables associated with prevalent hepatitis C, hepatitis B, and HIV infection in injection drug users in Winnipeg, Canada. BMC Public Health. 2006;6:229. doi: 10.1186/1471-2458-6-229. [DOI] [PMC free article] [PubMed] [Google Scholar]
- Zeldis JB, Jain S, Kuramoto IK, Richards C, Sazama K, Samuels S, et al. Seroepidemiology of viral infections among intravenous drug users in northern California. The Western Journal of Medicine. 1992;156:30–35. [PMC free article] [PubMed] [Google Scholar]
- Zocratto KB, Caiaffa WT, Proietti FA, Carneiro-Proietti AB, Mingoti SA, Ribeiro GJ. HCV and HIV infection and co-infection: injecting drug use and sexual behavior, AjUDE-Brasil I Project. Cadernos de Saúde Pública. 2006;22(4):839–848. doi: 10.1590/s0102-311x2006000400022. [DOI] [PubMed] [Google Scholar]