Abstract
The angiotensinogen gene is genetically linked with hypertension, but the mechanistic basis for association of sequence variants in the promoter and coding region of the gene remains unclear. An E-box at position −20 has been hypothesized to control the level of angiotensinogen expression, but its mechanistic importance for angiotensinogen expression in human tissues is uncertain. We developed an allele-specific PCR-based assay to distinguish between angiotensinogen mRNA derived from variants at the −20 position (rs5050) in the angiotensinogen promoter in adipose tissues obtained during surgery. The assay takes advantage of linkage disequilibrium between the rs5050 (located in the promoter) and rs4762 (located in the coding region) single nucleotide polymorphisms. This strategy allowed us to assess the level of allele-specific expression in A-20C heterozygous subjects comparing the relative proportion of each allele to the total, thus eliminating the problem of variability in the level of total angiotensinogen mRNA among subjects. We show that 1) angiotensinogen mRNA derived from the −20C allele is expressed significantly higher than that derived from the −20A allele in subcutaneous adipose tissue, and 2) increased expression correlates with enriched chromatin binding of upstream stimulatory factor 2 to the −20C E-box compared with −20A. This may be depot selective because we were unable to detect these differences in omental adipose. This provides the first data directly comparing expression of angiotensinogen mRNA and differential transcription factor binding derived from two variant alleles in human tissue where the ratio of expression of one allele to another can be accurately determined.
Keywords: Genetics, Hypertension, Adipose Tissue, Angiotensinogen, Transcription Factors, Upstream Stimulatory Factors
Introduction
Angiotensinogen (AGT) encodes the precursor for the peptides in the renin-angiotensin system (RAS), and is therefore one of the most frequently studied genes for its contributions to hypertension. AGT is synthesized in the liver, adipose, heart, blood vessel, brain and kidney, among others. Its importance in many of these tissues has been well established by animal models where AGT mRNA expression has either been ablated or over-expressed. Adipose tissue AGT has recently become recognized as a contributor to both blood pressure and metabolic regulation. Overexpression of AGT in adipose tissue causes systemic hypertension in mice 1 and favors lipogenesis in cultured human adipocytes 2, whereas AGT-deficient mice exhibit reduced fat mass and blood pressure.3 Similarly, adipose-specific AGT-deficiency lowers arterial pressure and blocks the blood pressure elevating effect of a high fat diet.4,5 Therefore, adipose tissue-derived AGT could be a factor contributing to the association between obesity and hypertension.
The primary variant allele of the AGT gene initially investigated in human subjects was M235T.6 Since then, many association and case-control studies have failed to provide compelling evidence supporting an etiological role for this variant.7 There is no difference in the kinetics of the catalytic reaction between renin and either M235 or T235 AGT.8 Humanized mice carrying the M235 and T235 AGT variants did not exhibit any changes in the level of AGT expression 9, and only under specific conditions (high salt and dysregulation of renin) was there a difference in arterial pressure.10 This suggests that M235T may derive its physiological importance from linkage disequilibrium with variants in the AGT promoter. Single nucleotide polymorphisms (SNPs) at nucleotides −6, −20, −217, −517, and −792 in the human AGT promoter have been implicated in the pathogenesis of high blood pressure.7 We and others reported that the A-20C and G-217A polymorphisms in the human AGT 5’ flanking region strongly influence promoter activity in AGT-expressing cells.11–13
The E box sequence (CACGTG) overlying a SNP in human AGT at position −20 (rs5050) is significant because it is the binding site for upstream stimulatory factor (USF)1 and USF2. USF1 is a transcription factor that binds to E-box sequences in DNA, as a homodimer or a heterodimer with its partner USF2 to modulate the expression of genes related to glucose and lipid metabolism, including fatty acid synthase (FAS), peroxisome proliferator activated receptor γ (PPARG or NR1C3) and AGT.14 Both USF1 and USF2 are essential for AGT transcriptional regulation 15, and gender-specific mechanisms are involved in their activity on AGT expression in vivo.16 USF1 polymorphisms were reported to be associated with the level of AGT expression in human fat biopsies.17 AGT expression in the renal medulla was reported to be higher in subjects carrying the −20C allele than the −20A.18 However, no mechanistic studies have been performed to examine this on an allele-specific basis. We hypothesize that AGT expression derived from −20C allele is higher in human subcutaneous (SQ) adipose from individuals heterozygous for −20A and −20C alleles. We further tested if this was due to increased binding of USF1 and USF2 to the −20C vs −20A promoter.
Material and Methods
Adipose tissues were collected from subcutaneous (SQ) and omental depots of patients undergoing surgical procedures at University Hospital, Cincinnati, OH. This study was designed to investigate the mechanism of differential AGT gene expression and transcription factor binding amongst two variant alleles at −20. Thus, we did not collect specific patient-related data for this study. Adipose tissues were collected in cold DMEM/F12 medium, transported to the laboratory and stored at −80°C until used experimentally. All identifying data were removed prior to shipping the samples to the University of Iowa. The collection protocol was approved by the Institutional Review Board at the University of Cincinnati and subjects gave informed consent.
See the online-only Data Supplement for more detailed procedures for genotyping, measuring gene expression, allele-specific assays, chromatin immunoprecipitation, and statistics.
Results
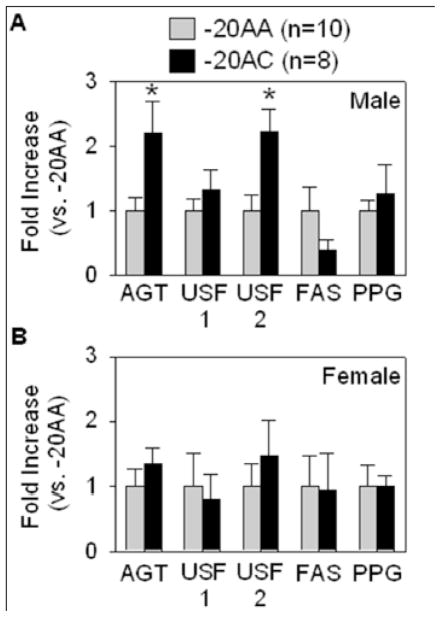
We obtained 89 human SQ adipose samples and successfully genotyped 76 of them for the rs5050 SNP at position −20 in the AGT promoter. Homozygosity (−20AA) and heterozygosity (−20AC) was identified in 56 (74%) and 20 (26%) samples, respectively. None were homozygous −20CC. This is consistent with the genotype frequencies for Caucasian Americans in the HapMap (http://hapmap.ncbi.nlm.nih.gov/). Expression of total AGT mRNA was 2.2-fold elevated in −20AC male (Figure 1A) but not female subjects (Figure 1B). Although there was no difference in the level of USF1 mRNA, a 2.2-fold elevation in USF2 mRNA was observed in SQ adipose tissue from males. There were no significant differences in the level of USF1 or USF2 protein in any SQ adipose samples tested (data not shown). There was also no correlation between elevated USF2 expression and expression of two other USF target genes FAS and PPARG (Figure 1).
Figure 1. Gene expression in SQ adipose tissue.
Expression of AGT, USF1, USF2, FAS and PPARG (PPG) in SQ adipose tissue derived from males (A) and females (B). *P<0.05 vs. −20AA. All data presented as the mean ± SEM.
Analysis of 120 phased chromosomes from the Centre d’Etude du Polymorphisme Humain (CEPH) population showed 97% concordance between SNPs rs5050 and rs4762 (Figure 2). SNP rs4762 is a polymorphism at position +620 which was denoted as T174M. We successfully genotyped 58 SQ adipose samples at rs4762. Similar to rs5050, homozygosity (+620CC) and heterozygosity (+620CT) was identified in 41 (71%) and 17 (31%) samples, respectively. Of the 20 samples identified above as −20AC heterozygotes, 17 were also +620CT heterozygotes. Linkage disequilibrium between rs5050 and rs4762 was determined in 16 samples by sequencing cloned fragments representing the 32 chromosomes encompassing both rs5050 and rs4762. All were confirmed to conform to the predicted −20C/+620T:−20A/+620C haplotypes. The other samples, genotyped as −20C/+620C:−20A/+620C, were deemed uninformative. A summary of the genotype data is shown in Table 1. The linkage disequilibrium identified between −20 and +620 was not observed with two other SNPs- rs5049 (known as −217) and rs5051 (known as −6) reported previously to influence AGT promoter activity (Table 2).13
Figure 2. Schematic of the AGT locus and hypothesis.
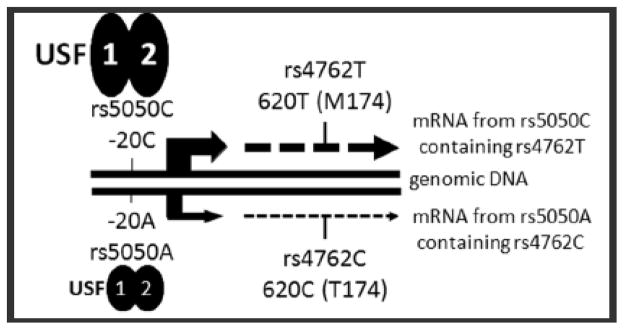
The −20 SNP (rs5050) lies in the promoter of the AGT gene. We hypothesize that the high level allele (−20C) recruits stronger binding of USF1 and USF2 to the E-box in this region. The rs5050 and rs4762 SNPs are in linkage disequilibrium such that −20C/+620T and −20A/+620C form haplotypes. Measuring AGT mRNA carrying +620T provides a surrogate for −20C.
Table 1.
Genotype Summary
| SNP | Number Samples | ||||
|---|---|---|---|---|---|
| rs5050 | rs4762 | Male | Female | Total | % of total |
| AA | CC | 11 | 14 | 25 | 56 |
| CT | 0 | 0 | 0 | 0 | |
| TT | 0 | 0 | 0 | 0 | |
|
| |||||
| AC | CC | 2 | 1 | 3 | 6 |
| CT | 8 | 9 | 17 | 38 | |
| TT | 0 | 0 | 0 | 0 | |
|
| |||||
| CC | CC | 0 | 0 | 0 | 0 |
| CT | 0 | 0 | 0 | 0 | |
| TT | 0 | 0 | 0 | 0 | |
|
| |||||
| Total | 21 | 24 | 45 | 100 | |
AGT genotype frequencies in SQ adipose samples are shown. Only shown here are samples that were successfully genotyped at both rs5050 and rs4762.
Table 2.
Haplotype Summary
| rs5049 (−217) | rs5050 (−20) | rs5051 (−6) | rs4762 (+620) | Number |
|---|---|---|---|---|
| G | C | A | T | 1 |
| A | A | A | C | |
|
| ||||
| G | C | A | T | 8 |
| G | A | G | C | |
|
| ||||
| A | C | A | T | 2 |
| G | A | G | C | |
|
| ||||
| G | C | A | T | 4 |
| G | A | A | C | |
|
| ||||
| G | C | A | T | 1 |
| A | A | G | C | |
Haplotypes for the 16 heterozygous samples confirmed to have linkage disequilibrium between rs5050 and rs4762.
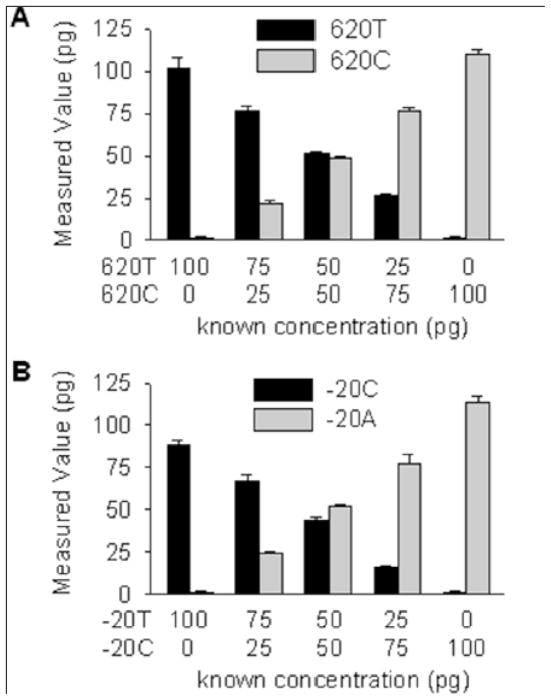
We developed allele-specific assays to determine if AGT mRNA derived from the −20C promoter was expressed higher than AGT mRNA derived from the −20A promoter. We took advantage of the 16 SQ adipose samples that have confirmed linkage disequilibrium between −20C/+620T and −20A/+620C. In other words, expression of AGT mRNA containing +620T could be attributed to the −20C allele whereas AGT mRNA containing +620C could be attributed to the −20A allele (Figure 2). Identical primers were used to amplify DNA surrounding rs4762 but different fluorescent probes were used distinguish +620T from +620C mRNA (Table S1). Varying the amount of cloned +620T or +620C cDNA resulted in a straight line standard curve, and mixing experiments validated the specificity of the assay (Figure S1A, Figure 3A). A similar allele-specific assay centering on rs5050 was developed and validated for the ChIP studies (Figure S1B, Figure 3B). In both assays, there was a slight bias toward the detection of the more frequent +620C and −20A alleles. These represent the hypothesized low expressing alleles.
Figure 3. Development and validation of allele-specific assays.
A mixing experiment using the indicated ratios of rs4762 (620T vs 620C, panel A) or –rs5050 (20C vs −20A, panel B) plasmid DNA was used to validate the specificity and selectivity of the assay. Standard curves are shown in Figure S1.
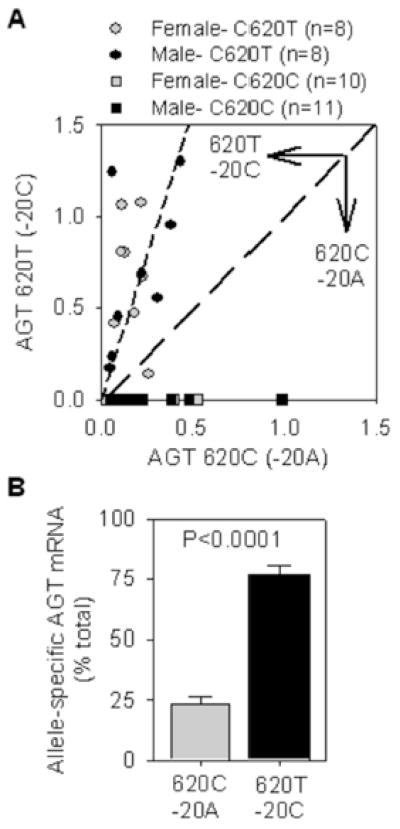
We measured the relative amount of +620T and +620C mRNA in SQ adipose tissue from 16 subjects heterozygous at the haplotype level using genomic DNA from one of them to develop standard curves (Figure S2). First, we noted a large variability in the total level of AGT mRNA in SQ adipose tissue (Figure 4A). Second, in 15 of 16 samples, the level of AGT mRNA carrying +620T (−20C) was higher than AGT carrying +620C (−20A). That the assay is indeed selective is evidenced by the absence of +620T mRNA in 21 samples derived from +620CC homozygotes. On average, 75% of the AGT mRNA in SQ adipose was derived from +620T (−20C) and 25% was derived from +620C (−20A) (Figure 4B).
Figure 4. Quantification of +620T and +620C containing mRNA in SQ adipose.
Quantitative allele-specific PCR for rs4762 SNP was performed in 16 heterozygous and 21 homozygous samples and the data was plotted the standard curves shown in Figure S2. A. The amount of mRNA carrying +620T and +620C is plotted. The line of identity (representing equal amounts of both alleles) is shown by the long dashed line. The regression line (calculated to the origin) derived from the combined male and female +620CT data is shown in the short dashed line. B. The individual samples were transformed to a percentage of total AGT mRNA. P<0.0001 analyzed by one-sample t-test using 50% as the hypothetical mean.
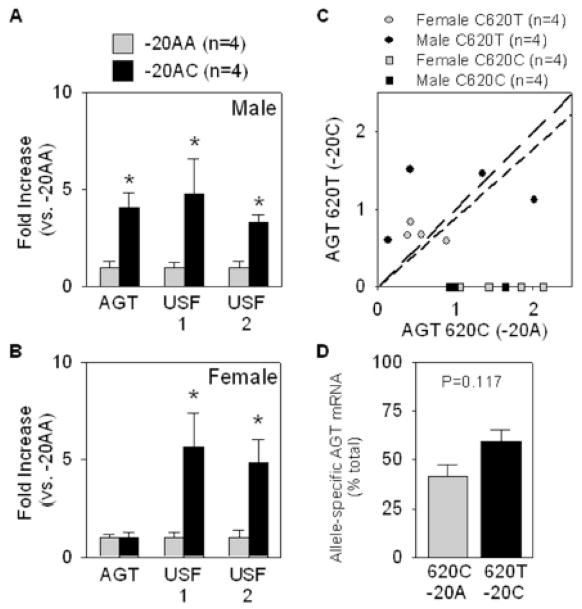
In addition to SQ adipose, we obtained omental adipose tissue from 8 of the heterozygous +620TC subjects. As for SQ adipose tissue, the total level of AGT expression was higher in omental adipose tissue from −20AC males but not females, whereas increased expression of both USF1 and USF2 mRNA was identified in samples from −20AC male and female subjects (Figure 5A–B). Although some individual samples showed enrichment for AGT mRNA carrying +620T (Figure 5C), on the whole this trend was not significant (Figure 5D).
Figure 5. Quantification of +620T and +620C containing mRNA in omental adipose.
A–B. Expression of AGT, USF1, and USF2, in omental adipose tissues from males (A) and females (B). *<0.05 vs. −20AA. All data presented as mean ± SEM. C. The amount of mRNA carrying +620T and +620C is plotted. The line of identity (representing equal amounts of both alleles) is shown by the long dashed line. The regression line (calculated to the origin) derived from the combined male and female +620CT data is shown in the short dashed line. D. Individual samples in panel C were transformed to a percentage of total AGT mRNA and plotted. There is no significant difference in the relative amount of +620C vs +620T as calculated by a one-sample t-test using 50% as the hypothetical mean.
Finally, we tested if the binding of USF1 and USF2 to the E-box overlying the −20 position in the AGT promoter could explain the increase in AGT mRNA derived from the −20C allele in SQ adipose. ChIP studies revealed that the binding of USF1 was generally quite low (less than 2-fold enriched over the IgG control, Figure 6A); and there was no difference in the relative binding of USF1 to the −20C vs −20A allele (Figure 6C). Binding of USF2 was more robust (Figure 6B) and showed a significant enrichment in binding to −20C (Figure 6C).
Figure 6. Binding of USF1 and USF2 to −20 chromatin.
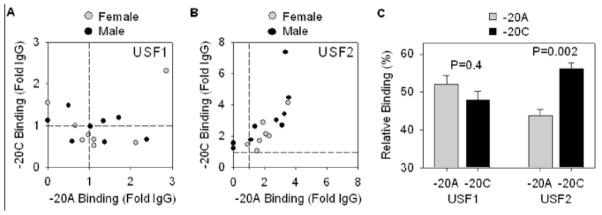
A–B. ChIP analysis was used to measure the enrichment of USF1 and USF2 vs IgG in the chromatin precipitate with antisera targeting each transcription factor. The relative binding was determined by quantitative PCR using allele-specific probes and standard curves similar to those shown in Figure 3B. The background of the assay, that is where the ChIP signal equals the IgG control, is indicated by the dashed line. C. Quantification of the relative percentage of USF1 and USF2 binding to −20A vs −20C chromatin. Significance was determined by paired t-test comparing −20A vs −20C. All data presented as mean ± SEM.
Discussion
Genetic evidence implicating AGT in hypertension was first reported in 1992.6 The AGT M235T variant was the first extensively examined in association and case-control studies. An extensive literature details studies both supporting or refuting the association with hypertension.7 Our studies using “humanized” mouse models generally refute the physiological importance of the M235T variant in AGT.9,10 The finding that the 235 and −6 variants were in strong linkage disequilibrium began efforts to identify and examine SNPs in the AGT promoter.19 Nine SNPs in the AGT promoter, some of which overlay transcription factor binding sites, defined five common haplotypes.20 We studied the transcriptional activity of naturally-occurring AGT promoter haplotypes containing SNPs at −6, −0, −217 and at 11 other positions in the proximal promoter that in total account for 90% of known diversity. We reported that the −20 and −217 SNPs had the largest influence on AGT transcription and may act cell-specifically.13
We focused on the A-20C SNP for a number of reasons. First, it was reported to be associated with hypertension, cardiac hypertrophy, microangiopathy-related cerebral damage, progression of IgA nephropathy, non-modulating hypertension, and most importantly for the current study, may act as a modifier of the relationship between body mass index and blood pressure.21–26 Second, the −20 position lies within an E-box sequence which binds USF1 and USF2.15 Notably, a naturally occurring splice variant of USF1 which lacks the N-terminal transactivation domain and acts dominant negatively was reported to repress AGT transcription.27 Based on this rationale, we showed that USF1/2 binds more strongly to the −20C than −20A allele in chromatin in AGT-expressing cells, and that ablation of USF1 and USF2 resulted in markedly blunted AGT expression in vivo.15 Similarly, we showed that AGT expression in many tissues was decreased in USF1-deficient mice.16
The main conclusions of the current study are that: 1) there is great deal of variability in the total level of AGT expression in human adipose tissue, 2) there is an enrichment in the expression of AGT mRNA derived from the −20C allele compared with −20A in SQ adipose tissue from heterozygous subjects, 3) this enrichment appears adipose depot selective as we were not able to detect differences in omental adipose tissue, and 4) there is an enrichment in the binding of USF2 to the −20C allele in chromatin derived from SQ adipose tissue.
Although the total level of AGT mRNA in SQ adipose tissue from −20AA and −20AC females was not different, AGT mRNA derived from the −20C allele was higher than that derived from the −20A allele in heterozygous subjects. It is difficult to explain this apparent discrepancy, but it suggests that other factors may play an important role in AGT regulation, and that the total level of AGT is a result of the sum of all these factors. Consistent with this, the sequence surrounding −20A has been reported to form an estrogen response element that causes increased transcriptional activity in cells cotransfected with estrogen receptor α (ERα).11 It is unclear if there are mechanisms that would induce a greater ERα-dependent effect in −20AA vs −20AC women. Along these lines, plasma levels of AGT are higher in pregnant women homozygous for the −20A allele, intermediate for heterozygous women, and the lowest in women homozygous for the −20C allele.28 That the effect of ERα on AGT expression of alleles carrying −20A may be antagonized by the binding of the orphan transcription factor ARP-1 further complicates the mechanisms of AGT regulation by variants at this site.29 Of course, since the samples were de-identified, we are unable to determine if they came from pre- or post-menopausal women.
It is also interesting that the allele-specific increase in expression of −20C AGT mRNA observed in SQ adipose tissue was not replicated in omental adipose despite an increase in total AGT mRNA in omental adipose in −20AC vs −20AA male subjects. The reason for this discrepancy is unclear. The simplest explanation may be that sample size of omental adipose tissue available for our study was too small to detect differences. Whereas the power to detect differences in the SQ dataset was 1.0 (with alpha=0.5), the power to detect differences in the omental data set was only 0.162. This is not surprising given the overall variability in AGT expression observed among subjects. Alternatively, the data could suggest that there is some cell-specificity in mediating the transcriptional responses to variants in the AGT promoter. Indeed, we previously reported differences in the transcriptional activity of common haplotypes of the AGT promoter in a number of cell types of diverse origin.13 It remains unclear if these differences could extend to different types of adipose cells or adipose cells derived from different depots. Along these lines, it is interesting to note that both endogenous mouse AGT mRNA and human AGT mRNA (derived from a transgene) increased in omental, reproductive, and peri-renal adipose, but not SQ or brown adipose in response to high fat diet in mice.30 Thus there appears to be some selectivity in mediating AGT transcriptional responses to physiological cues among adipose depots. It is also possible that this reflects a second tier of regulation. In this regard, Chatterjee et al. identified that histone deacetylase 9 (HDAC9) can bind to the USF1/USF2 complex at the C/EBPα promoter to repress transcription of the C/EBPα gene, a major regulator of adipogenic differentiation.31 HDAC9 expression is higher in omental than SQ adipose tissue and this correlates with decreased capacity to undergo adipogenic differentiation. Upon induction of adipogenic differentiation, the level of HDAC9 decreases, and is replaced on the USF1/2 complex with the transcriptional co-activator p300 histone acetyl transferase (p300 HAT). Thus it will be interesting in future studies to determine if USF1/2 bound to the −20 region of the AGT promoter is differentially complexed with HDAC9 or p300 HAT in omental and SQ adipose tissue.
One of the strengths of the current study was linking the allele-specific AGT expression data with the level USF1 and USF2 binding. Based on our previous results of increased USF1 but not USF2 binding to plasmids carrying −20C transfected in HepG2 cells, we were surprised that it was USF2 that showed modestly enriched binding to the −20C allele in chromatin from SQ adipose tissue. This may be due to the observation that the binding of USF1 was quite low, essentially at the detection threshold of the assay defined by the IgG control. Indeed, the ChIP assays on human adipose tissue were much more difficult and less sensitive than our previous experience with cultured cells. Ultimately, given these results, it may be interesting to optimize the assay or develop immortalized cells so that a greater number of mechanistic studies can be performed. It would also be interesting to compare the binding of ERα and ARP-1 to USF1/2.
Perspectives and Significance
Whether the AGT gene plays an important role in the genetics of hypertension has and will be debated for years. What is beyond dispute is the importance of the RAS in the regulation of blood pressure, and the use of RAS blockers as first-line antihypertensive treatments. Numerous mechanistic studies have revealed that RAS activity in tissues can play an important role in the blood pressure regulation.32 A functional role for the RAS in adipose tissue is gaining acceptance, and strong evidence implicates a role for adipose AGT and Ang-II in both metabolism and blood pressure regulation (reviewed in 33). Circulating AGT derived from adipose tissue is increased in obesity, and Ang-II can increase AGT expression in adipose tissue.34,35 Just as RAS blockade can lower blood pressure, it can improve glycemic control and can lessen the risk of type-2 diabetes.36,37 Our study is significant in that we demonstrate that the level of AGT expression in human SQ adipose tissue may be, at least in part, genetically determined. The genetically determined level of AGT in adipose tissue and its transcriptional response to the physiological environment may play an important role in blood pressure regulation. However, other factors may also regulate AGT expression. For example, AGT expression can be altered by oxidative stress.38 Perhaps this genetic/environmental complexity contributes to the discrepancy observed between association studies that may not be able to effectively control for all of these unknown variables. Future experiments will need to assess if the genetic determinants observed herein are also present when adipose samples are taken from hypertensive and/or obese subjects.
Supplementary Material
Novelty and Significance.
What Is New?
We took advantage of linkage disequilibrium to develop allele-specific assays designed to measure the amount of AGT mRNA derived from SNPs in the AGT promoter.
Measurement of AGT mRNA derived from AGT promoter SNPs in adipose tissue of subjects heterozygous for the SNP.
In subcutaneous but not omental adipose tissue, expression of AGT mRNA derived from the −20C allele of the AGT promoter is higher than −20A allele in heterozygous subjects carrying both alleles.
Increased expression correlated with increased binding of USF2 to the −20C E-box.
What Is Relevant?
The AGT gene has been genetically linked with hypertension.
Genetic variants in both the promoter and coding region of the AGT gene are hypothesized to be significant but the mechanistic basis for this remains unclear.
An E-box at position −20 binds USF1 and USF2 and has been hypothesized to control the level of AGT expression, but mechanistic studies of AGT expression in human tissues are lacking.
Summary.
This provides the first data directly comparing expression of AGT mRNA and differential transcription factor binding derived from two variant alleles in tissues from human subjects. Our study is significant in that we demonstrate that the level of AGT expression in human SQ adipose tissue may be, at least in part, genetically determined
Acknowledgments
We acknowledge the DNA Core Facility at the University of Iowa for assistance with DNA sequencing and genotyping.
Funding: NIH grants HL048058, HL061446, HL062984, HL084207 to CDS; HL076684 and HL112640 to NLW; and HL089895 and DK089417 to AEK. The authors gratefully acknowledge the generous research support of the Roy J. Carver Trust (to CDS) and the Fraternal Order of Eagles Diabetes Research Center (to AEK).
Footnotes
Disclosures: None
References
- 1.Massiera F, Bloch-Faure M, Ceiler D, Murakami K, Fukamizu A, Gasc JM, Quignard-Boulange A, Negrel R, Ailhaud G, Seydoux J, Meneton P, Teboul M. Adipose angiotensinogen is involved in adipose tissue growth and blood pressure regulation. FASEB J. 2001;15:2727–2729. doi: 10.1096/fj.01-0457fje. [DOI] [PubMed] [Google Scholar]
- 2.Jones BH, Standridge MK, Moustaid N. Angiotensin II increases lipogenesis in 3T3–L1 and human adipose cells. Endocrinology. 1997;138:1512–1519. doi: 10.1210/endo.138.4.5038. [DOI] [PubMed] [Google Scholar]
- 3.Massiera F, Seydoux J, Geloen A, Quignard-Boulange A, Turban S, Saint-Marc P, Fukamizu A, Negrel R, Ailhaud G, Teboul M. Angiotensinogen-deficient mice exhibit impairment of diet-induced weight gain with alteration in adipose tissue development and increased locomotor activity. Endocrinology. 2001;142:5220–5225. doi: 10.1210/endo.142.12.8556. [DOI] [PubMed] [Google Scholar]
- 4.Yiannikouris F, Karounos M, Charnigo R, English VL, Rateri DL, Daugherty A, Cassis LA. Adipocyte-specific deficiency of angiotensinogen decreases plasma angiotensinogen concentration and systolic blood pressure in mice. Am J Physiol Regul Integr Comp Physiol. 2012;302:R244–R251. doi: 10.1152/ajpregu.00323.2011. [DOI] [PMC free article] [PubMed] [Google Scholar]
- 5.Yiannikouris F, Gupte M, Putnam K, Thatcher S, Charnigo R, Rateri DL, Daugherty A, Cassis LA. Adipocyte deficiency of angiotensinogen prevents obesity-induced hypertension in male mice. Hypertension. 2012;60:1524–1530. doi: 10.1161/HYPERTENSIONAHA.112.192690. [DOI] [PMC free article] [PubMed] [Google Scholar]
- 6.Jeunemaitre X, Soubrier F, Kotelevtsev YV, Lifton RP, Williams CS, Charru A, Hunt SC, Hopkins PN, Williams RR, Lalouel J-M, Corvol P. Molecular Basis of Human Hypertension: Role of Angiotensinogen. Cell. 1992;71:169–180. doi: 10.1016/0092-8674(92)90275-h. [DOI] [PubMed] [Google Scholar]
- 7.Dickson ME, Sigmund CD. Genetic basis of hypertension: revisiting angiotensinogen. Hypertension. 2006;48:14–20. doi: 10.1161/01.HYP.0000227932.13687.60. [DOI] [PubMed] [Google Scholar]
- 8.Inoue I, Rohrwasser A, Helin C, Jeunemaitre X, Crain P, Bohlender J, Lifton RP, Corvol P, Ward K, Lalouel J-M. A mutation of angiotensinogen in a patient with preeclampsia leads to altered kinetics of the renin-angiotensin system. J Biol Chem. 1995;270:11430–11436. doi: 10.1074/jbc.270.19.11430. [DOI] [PubMed] [Google Scholar]
- 9.Cvetkovic B, Keen HL, Davis DR, Zhang X, Yang B, Sigmund CD. Physiological Significance of Two Common Haplotypes of Human Angiotensinogen Using Gene Targeting in the Mouse. Physiol Genomics. 2002;11:253–262. doi: 10.1152/physiolgenomics.00076.2002. [DOI] [PubMed] [Google Scholar]
- 10.Grobe JL, Dickson ME, Park S, Davis DR, Born EJ, Sigmund CD. Cardiovascular Consequences of Genetic Variation at −6/235 in Human Angiotensinogen Using “Humanized” Gene-Targeted Mice. Hypertension. 2010;56:981–987. doi: 10.1161/HYPERTENSIONAHA.110.157354. [DOI] [PMC free article] [PubMed] [Google Scholar]
- 11.Zhao YY, Zhou J, Narayanan CS, Cui Y, Kumar A. Role of C/A polymorphism at −20 on the expression of human angiotensinogen gene. Hypertension. 1999;33:108–115. doi: 10.1161/01.hyp.33.1.108. [DOI] [PubMed] [Google Scholar]
- 12.Jain S, Tang X, Narayanan CS, Agarwal Y, Peterson SM, Brown CD, Ott J, Kumar A. Angiotensinogen gene polymorphism at −217 affects basal promoter activity and is associated with hypertension in African-Americans. J Biol Chem. 2002;277:36889–36896. doi: 10.1074/jbc.M204732200. [DOI] [PubMed] [Google Scholar]
- 13.Dickson ME, Zimmerman MBRK, Sigmund CD. The −20 and −217 promoter variants dominate differential angiotensinogen haplotype regulation in angiotensinogen-expressing cells. Hypertension. 2007;49:631–639. doi: 10.1161/01.HYP.0000254350.62876.b1. [DOI] [PubMed] [Google Scholar]
- 14.Casado M, Vallet VS, Kahn A, Vaulont S. Essential role in vivo of upstream stimulatory factors for a normal dietary response of the fatty acid synthase gene in the liver. J Biol Chem. 1999;274:2009–2013. doi: 10.1074/jbc.274.4.2009. [DOI] [PubMed] [Google Scholar]
- 15.Dickson ME, Tian X, Liu X, Davis DR, Sigmund CD. Upstream Stimulatory Factor is Required for Human Angiotensinogen Expression and Differential Regulation by the A-20C Polymorphism. Circulation Research. 2008;103:940–947. doi: 10.1161/CIRCRESAHA.108.180653. [DOI] [PMC free article] [PubMed] [Google Scholar]
- 16.Park S, Liu X, Davis DR, Sigmund CD. Gene trapping uncovers sex-specific mechanisms for upstream stimulatory factors 1 and 2 in angiotensinogen expression. Hypertension. 2012;59:1212–1219. doi: 10.1161/HYPERTENSIONAHA.112.192971. [DOI] [PMC free article] [PubMed] [Google Scholar]
- 17.Naukkarinen J, Gentile M, Soro-Paavonen A, Saarela J, Koistinen HA, Pajukanta P, Taskinen MR, Peltonen L. USF1 and dyslipidemias: converging evidence for a functional intronic variant. Hum Mol Genet. 2005;14:2595–2605. doi: 10.1093/hmg/ddi294. [DOI] [PubMed] [Google Scholar]
- 18.Sarzani R, Bordicchia M, Marcucci P, Minardi D, Muzzonigro G, Dessi-Fulgheri P, Rappelli A. Angiotensinogen promoter variants influence gene expression in human kidney and visceral adipose tissue. J Hum Hypertens. 2010;24:213–219. doi: 10.1038/jhh.2009.48. [DOI] [PubMed] [Google Scholar]
- 19.Inoue I, Nakajima T, Williams CS, Quackenbush J, Puryear R, Powers M, Cheng T, Ludwig EH, Sharma AM, Hata A, Jeunemaitre X, Lalouel JM. A nucleotide substitution in the promoter of human angiotensinogen is associated with essential hypertension and affects basal transcription in vitro. J Clin Invest. 1997;99:1786–1797. doi: 10.1172/JCI119343. [DOI] [PMC free article] [PubMed] [Google Scholar]
- 20.Nakajima T, Jorde LB, Ishigami T, Umemura S, Emi M, Lalouel JM, Inoue I. Nucleotide diversity and haplotype structure of the human angiotensinogen gene in two populations. Am J Hum Genet. 2002;70:108–123. doi: 10.1086/338454. [DOI] [PMC free article] [PubMed] [Google Scholar]
- 21.Pereira TV, Nunes AC, Rudnicki M, Yamada Y, Pereira AC, Krieger JE. Meta-analysis of the association of 4 angiotensinogen polymorphisms with essential hypertension: a role beyond M235T? Hypertension. 2008;51:778–783. doi: 10.1161/HYPERTENSIONAHA.107.100370. [DOI] [PubMed] [Google Scholar]
- 22.Ott C, Schwarz T, Hilgers KF, Kreutz R, Schlaich MP, Schmieder RE. Left-ventricular structure and function are influenced by angiotensinogen gene polymorphism (−20 A/C) in young male patients. Am J Hypertens. 2007;20:974–980. doi: 10.1016/j.amjhyper.2007.03.008. [DOI] [PubMed] [Google Scholar]
- 23.Schmidt H, Fazekas F, Kostner GM, van Duijn CM, Schmidt R. Angiotensinogen gene promoter haplotype and microangiopathy-related cerebral damage: results of the Austrian Stroke Prevention Study. Stroke. 2001;32:405–412. doi: 10.1161/01.str.32.2.405. [DOI] [PubMed] [Google Scholar]
- 24.Goto S, Narita I, Saito N, Watanabe Y, Yamazaki H, Sakatsume M, Shimada H, Nishi S, Ueno M, Akazawa K, Arakawa M, Gejyo F. A(−20)C polymorphism of the angiotensinogen gene and progression of IgA nephropathy. Kidney Int. 2002;62:980–985. doi: 10.1046/j.1523-1755.2002.00517.x. [DOI] [PubMed] [Google Scholar]
- 25.Hilgers KF, Delles C, Veelken R, Schmieder RE. Angiotensinogen gene core promoter variants and non-modulating hypertension. Hypertension. 2001;38:1250–1254. doi: 10.1161/hy1201.096545. [DOI] [PubMed] [Google Scholar]
- 26.Tiago AD, Samani NJ, Candy GP, Brooksbank R, Libhaber EN, Sareli P, Woodiwiss AJ, Norton GR. Angiotensinogen gene promoter region variant modifies body size-ambulatory blood pressure relations in hypertension. Circulation. 2002;106:1483–1487. doi: 10.1161/01.cir.0000029093.93362.fc. [DOI] [PubMed] [Google Scholar]
- 27.Saito T, Oishi T, Yanai K, Shimamoto Y, Fukamizu A. Cloning and characterization of a novel splicing isoform of USF1. Int J Mol Med. 2003;12:161–167. [PubMed] [Google Scholar]
- 28.Morgan L, Crawshaw S, Baker PN, Pipkin FB, Kalsheker N. Polymorphism in oestrogen response element associated with variation in plasma angiotensinogen concentrations in healthy pregnant women. J Hypertens. 2000;18:553–557. doi: 10.1097/00004872-200018050-00007. [DOI] [PubMed] [Google Scholar]
- 29.Narayanan CS, Cui Y, Zhao YY, Zhou J, Kumar A. Orphan receptor Arp-1 binds to the nucleotide sequence located between TATA box and transcriptional initiation site of the human angiotensinogen gene and reduces estrogen induced promoter activity. Mol Cell Endocrinol. 1999;148:79–86. doi: 10.1016/s0303-7207(98)00236-6. [DOI] [PubMed] [Google Scholar]
- 30.Rahmouni K, Mark AL, Haynes WG, Sigmund CD. Adipose depot-specific modulation of angiotensinogen gene expression in diet-induced obesity. Am J Physiol Endocrinol Metab. 2004;286:E891–E895. doi: 10.1152/ajpendo.00551.2003. [DOI] [PubMed] [Google Scholar]
- 31.Chatterjee TK, Idelman G, Blanco V, Blomkalns AL, Piegore MG, Jr, Weintraub DS, Kumar S, Rajsheker S, Manka D, Rudich SM, Tang Y, Hui DY, Bassel-Duby R, Olson EN, Lingrel JB, Ho SM, Weintraub NL. Histone deacetylase 9 is a negative regulator of adipogenic differentiation. J Biol Chem. 2011;286:27836–27847. doi: 10.1074/jbc.M111.262964. [DOI] [PMC free article] [PubMed] [Google Scholar]
- 32.Lavoie JL, Sigmund CD. Minireview: overview of the renin-angiotensin system-- an endocrine and paracrine system. Endocrinology. 2003;144:2179–2183. doi: 10.1210/en.2003-0150. [DOI] [PubMed] [Google Scholar]
- 33.Kalupahana NS, Moustaid-Moussa N. The renin-angiotensin system: a link between obesity, inflammation and insulin resistance. Obes Rev. 2012;13:136–149. doi: 10.1111/j.1467-789X.2011.00942.x. [DOI] [PubMed] [Google Scholar]
- 34.Yasue S, Masuzaki H, Okada S, Ishii T, Kozuka C, Tanaka T, Fujikura J, Ebihara K, Hosoda K, Katsurada A, Ohashi N, Urushihara M, Kobori H, Morimoto N, Kawazoe T, Naitoh M, Okada M, Sakaue H, Suzuki S, Nakao K. Adipose tissue-specific regulation of angiotensinogen in obese humans and mice: impact of nutritional status and adipocyte hypertrophy. Am J Hypertens. 2010;23:425–431. doi: 10.1038/ajh.2009.263. [DOI] [PMC free article] [PubMed] [Google Scholar]
- 35.Lu H, Boustany-Kari CM, Daugherty A, Cassis LA. Angiotensin II increases adipose angiotensinogen expression. Am J Physiol Endocrinol Metab. 2007;292:E1280–E1287. doi: 10.1152/ajpendo.00277.2006. [DOI] [PubMed] [Google Scholar]
- 36.Bosch J, Yusuf S, Gerstein HC, Pogue J, Sheridan P, Dagenais G, Diaz R, Avezum A, Lanas F, Probstfield J, Fodor G, Holman RR. Effect of ramipril on the incidence of diabetes. N Engl J Med. 2006;355:1551–1562. doi: 10.1056/NEJMoa065061. [DOI] [PubMed] [Google Scholar]
- 37.Hansson L, Lindholm LH, Niskanen L, Lanke J, Hedner T, Niklason A, Luomanmaki K, Dahlof B, de FU, Morlin C, Karlberg BE, Wester PO, Bjorck JE. Effect of angiotensin-converting-enzyme inhibition compared with conventional therapy on cardiovascular morbidity and mortality in hypertension: the Captopril Prevention Project (CAPPP) randomised trial. Lancet. 1999;353:611–616. doi: 10.1016/s0140-6736(98)05012-0. [DOI] [PubMed] [Google Scholar]
- 38.Okada S, Kozuka C, Masuzaki H, Yasue S, Ishii-Yonemoto T, Tanaka T, Yamamoto Y, Noguchi M, Kusakabe T, Tomita T, Fujikura J, Ebihara K, Hosoda K, Sakaue H, Kobori H, Ham M, Lee YS, Kim JB, Saito Y, Nakao K. Adipose tissue-specific dysregulation of angiotensinogen by oxidative stress in obesity. Metabolism. 2010;59:1241–1251. doi: 10.1016/j.metabol.2009.11.016. [DOI] [PMC free article] [PubMed] [Google Scholar]
Associated Data
This section collects any data citations, data availability statements, or supplementary materials included in this article.


