Abstract
Centrosome reorientation to the immunological synapse maintains the specificity of T-cell effector function by facilitating the directional release of cytokines and cytolytic factors toward the antigen-presenting cell. This polarization response is driven by the localized accumulation of diacylglycerol, which recruits multiple protein kinase (PK)C isozymes to the synaptic membrane. Here, we used T-cell receptor (TCR) photoactivation and imaging methodology to demonstrate that PKCs control centrosome dynamics through the reciprocal localization of two motor complexes, dynein and nonmuscle myosin (NM)II. Dynein accumulated in the region of TCR stimulation, whereas NMII clustered in the back of the cell, behind the polarizing centrosome. PKC activity, which shaped both dynein and NMII accumulation within this framework, controlled NMII localization directly by phosphorylating inhibitory sites within the myosin regulatory light chain, thereby suppressing NMII clustering in the region of TCR stimulation. Concurrently, phosphorylation of distinct sites within myosin regulatory light chain by Rho kinase drove NMII clustering in areas behind the centrosome. These results reveal a role for NMII in T-cell polarity and demonstrate how it is regulated by upstream signals.
Keywords: cytoskeleton, polarity, signal transduction, microtubule-organizing center
In many cell types, cellular asymmetry is dictated by the polarization of the centrosome (also called the microtubule-organizing center). This event orients the microtubule cytoskeleton, positions key organelles such as the Golgi apparatus, and is required for the elaboration of specialized signaling structures (1). In lymphocytes such as T cells, B cells, and natural killer cells, the centrosome polarizes toward the immunological synapse (IS) formed between the lymphocyte and its stimulatory target cell (2). This remodeling event, which occurs within minutes of IS formation, controls the scope of lymphocyte secretory responses by enabling the directional release of cytokines and cytolytic factors toward the target cell.
In T cells, centrosome reorientation is triggered by the T-cell receptor (TCR), which binds to cognate peptide–major histocompatibility complex (pMHC) molecules on the surface of an antigen-presenting cell (APC). TCR stimulation unleashes a tyrosine kinase-based signaling cascade (3) that induces, among other things, the production of the lipid second messenger diacylglycerol (DAG) at the IS. Localized DAG accumulation is necessary and sufficient to induce centrosome reorientation (4) and functions by recruiting and activating three members of the novel protein kinase C (nPKC) subfamily: PKCε, PKCη, and PKCθ (5). Precisely how these events are coupled to movement of the centrosome, however, is poorly understood.
Centrosome polarization in T cells is thought to be mediated by cytoplasmic dynein (called dynein hereafter), a multisubunit motor protein responsible for minus end-directed motion along microtubules (2, 6). Dynein is known to accumulate at the IS before centrosome reorientation, and its recruitment has been linked to the presence of DAG (4, 7, 8). Furthermore, suppression of dynein by siRNA was observed to inhibit polarization responses in Jurkat T cells (8). There are indications, however, that dynein may not account for all centrosome dynamics. Treatment of T cells with the small-molecule dynein inhibitor erythro-9-(2-hydroxy-3-nonyl)adenine had little to no effect on centrosome reorientation toward stimulatory lipid bilayers, despite altering other dynein-dependent processes (9). Dynein-independent polarization was also observed, albeit to a lesser extent, in perturbation studies of Jurkat cells (8). These results suggest there might be other force-generating mechanisms that contribute to centrosome movement.
In that regard, it is interesting to note that centrosome positioning in fibroblasts involves not only dynein but also the actin-based motor nonmuscle myosin (NM)II (10). Both motors also contribute to nuclear movement in migrating neurons (11). NMII is a heterohexameric assembly containing two actin-binding heavy chains that are each associated with one essential light chain and one regulatory light chain [myosin regulatory light chain (MyoRLC)] (12). MyoRLC contains a number of phosphorylation sites that both positively and negatively regulate NMII function. During migration, NMII localizes to the sides and back of the T cell, where it promotes contractility in the trailing uropod (13). NMII has also been implicated in TCR trafficking and signaling dynamics, although these results are controversial (14–16).
In the present study, we examined the relative importance of dynein and NMII for centrosome reorientation in T cells. We found that the two motors work in a collaborative manner, with dynein accumulating at the site of TCR stimulation and NMII clustering in membrane regions on the opposite side of the cell. This reciprocal localization was established by the nPKCs, which directly modulate NMII localization by phosphorylating an N-terminal motif in MyoRLC. These results demonstrate how TCR signaling is coupled to the force-generating machinery that mediates centrosome movement.
Results
Dynein Collaborates with NMII to Move the Centrosome.
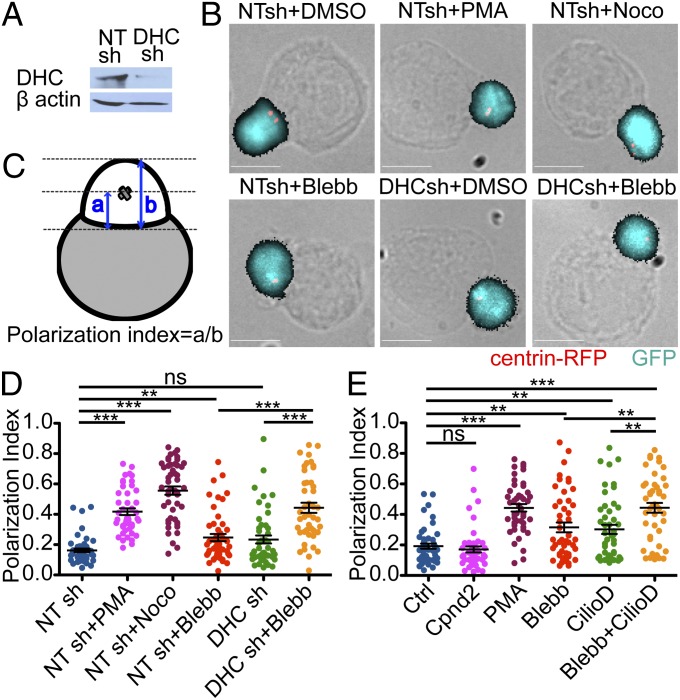
To investigate the role of dynein, we transduced primary CD4+ T-cell blasts with shRNA against the dynein heavy chain (DynHC) together with a construct encoding RFP-labeled centrin, a centrosomal marker (Fig. 1 A and B). The T cells expressed the 5C.C7 TCR, which recognizes the moth cytochrome c88–103 (MCC) peptide bound to the class II MHC molecule I-Ek. Suppression of DynHC markedly dispersed the Golgi apparatus, indicative of impaired dynein function (Fig. S1). We then assessed centrosome polarization by imaging fixed conjugates formed by T cells and antigen-loaded CH12 B cells (Fig. 1 B–D). As expected, control T cells expressing nontargeting shRNA displayed robust centrosome polarization, characterized by a “polarization index” parameter close to zero. This response was abrogated by nocodazole, which depolymerizes the microtubule cytoskeleton, and by phorbol myristate acetate (PMA), which blocks centrosome reorientation by eliciting unpolarized DAG signaling (4). Surprisingly, T cells lacking dynein displayed only a minor polarization defect that in some experiments failed to reach statistical significance. Similar results were obtained using a recently described small-molecule dynein inhibitor, ciliobrevin D (Fig. 1E), which targets the dynein motor domain (17). Hence, loss of dynein protein or dynein function only partially blocked centrosome reorientation, implying the existence of compensatory mechanisms.
Fig. 1.
Dynein and NMII collaborate during centrosome polarization in T cell–APC conjugates. (A–C) T-cell blasts (5C.C7) expressing the indicated GFP-marked shRNAs together with centrin-RFP were mixed with antigen-loaded CH12 cells and imaged after fixation. Cells were treated with 5 ng/mL PMA, 33 μM nocodazole, 50 μM blebbistatin, or vehicle control (DMSO) as indicated. (A) Validation of DHC shRNA knockdown by immunoblot, with β actin serving as a loading control. NT, nontargeting shRNA control. (B) Representative fluorescence images are shown overlaid onto their corresponding bright-field images. (Scale bars: 10 μm.) (C) Schematic showing the calculation of polarization index. (D) Quantification of polarization index in fixed conjugates (n ≥ 44 conjugates per condition). (E) Centrosome polarization in fixed conjugates treated with DMSO vehicle, 5 ng/mL PMA, 50 μM ciliobrevin D, 50 μM negative control compound for ciliobrevin D (compound 2), 50 μM blebbistatin, or 50 μM ciliobrevin D in combination with 50 μM blebbistatin (n ≥ 45 conjugates per condition). Error bars in D and E denote SEM. P values were calculated using the Mann–Whitney test. ***P < 0.001; **P < 0.01; *P ≤ 0.05; ns, P > 0.05.
Because NMII has been implicated in polarity induction in adherent cell types (10, 11), we investigated whether it might contribute to centrosome reorientation in T cells. Blebbistatin, a specific inhibitor of the myosin II motor, induced a small polarization defect, similar in magnitude to that induced by dynein deficiency alone (Fig. 1 B–E). However, combining blebbistatin with either DynHC shRNA or ciliobrevin D profoundly inhibited centrosome polarization, with average polarization indices comparable to nocodazole- and PMA-treated cells. TCR-induced Erk phosphorylation was unaffected by inhibition of dynein or NMII, implying that the polarization phenotypes we observed did not result from impaired TCR signaling (Fig. S2A). These results indicated that NMII and dynein operate in a partially redundant manner to move the centrosome toward the IS.
To closely examine the interplay between dynein and NMII and to correlate polarization responses with other signaling events, we used a previously described TCR-photoactivation and imaging assay (18). T cells are attached to coverslips coated with a photocaged version of their cognate pMHC. Subsequent irradiation of a micron-sized area beneath the T cell with UV light induces localized TCR activation, establishing an IS-like region within the T cell–glass interface. DAG and nPKCs typically accumulate in this region after ∼90 s, with centrosome reorientation following 10–15 s later (4). This system enables us to trigger TCR-dependent centrosome reorientation and monitor associated responses with high spatiotemporal resolution.
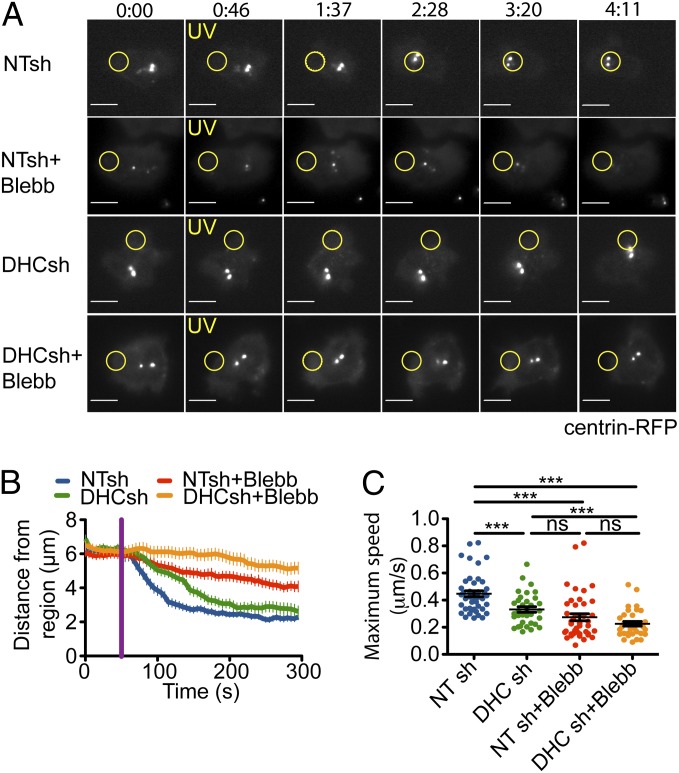
Suppression of DynHC resulted in a small, but detectable, defect in centrosome reorientation to the UV-irradiated region (Fig. 2 A and B). T cells lacking DynHC also displayed a significant reduction in maximum centrosome speed, suggesting that the capacity to move the centrosome was impaired (Fig. 2C). Similar defects were observed after blebbistatin treatment (Fig. 2 A–C), consistent with a role for NMII in the process. shRNA-mediated suppression of MyH9, the only NMII heavy chain expressed in T cells, also inhibited centrosome reorientation, although to a lesser extent than blebbistatin (Fig. S3A). This likely reflected suboptimal knockdown by the MyH9 shRNA (Fig. S3B). Importantly, simultaneous application of DynHC shRNA and blebbistatin inhibited polarization responses to a much greater extent than either treatment alone. Movement of the centrosome toward the irradiated region was essentially abrogated (Fig. 2 A and B), and maximum centrosome speed was reduced more than twofold relative to control T cells (Fig. 2C). Knockdown of DynHC did not affect TCR-induced DAG production, nor did blebbistatin alter recruitment of PKCθ, indicating that early TCR signaling was intact (Fig. S2 B and C). These data indicate that dynein and NMII collaborate to move the centrosome downstream of polarized nPKC activation.
Fig. 2.
Dynein and NMII collaborate to polarize the centrosome in response to TCR photoactivation. Centrosome polarization in T cells treated with nontargeting (NT) shRNA or shRNA against DynHC (DHC), with or without 50 μM blebbistatin. (A) Representative time-lapse montages, with the time of UV irradiation indicated by yellow text. Yellow circles denote the irradiated region in each experiment. Time is indicated as minutes:seconds above the montages. (Scale bars: 5 μm.) (B) Average distance between the photoactivated region and the centrosome over time, with UV irradiation indicated by a purple line. (C) Maximum speed of centrosome movement (n ≥ 34 cells per sample). Error bars denote SEM. P values were calculated using Student t test. ***P < 0.001; **P < 0.01; *P ≤ 0.05; ns, P > 0.05.
Reciprocal Localization of NMII and Dynein During Centrosome Reorientation.
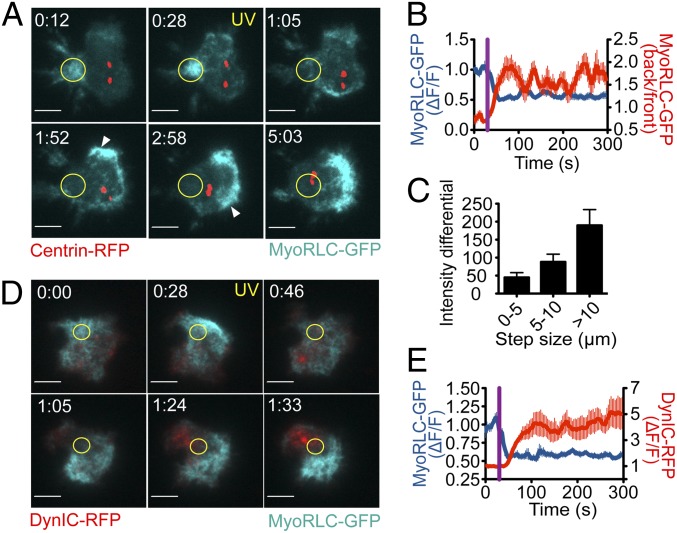
To explore how NMII influences centrosome polarization, we monitored its localization in photoactivation experiments using T cells expressing GFP-labeled MyoRLC. NMII formed transient, filamentous clusters beneath the plasma membrane (Fig. 3A) that could be visualized by total internal reflection fluorescence (TIRF) microscopy. Localized TCR photoactivation altered this pattern by suppressing the formation of new NMII clusters in the irradiated region (Fig. 3 A and B and Movie S1). This generated asymmetry in the NMII distribution, because clusters continued to form in the membrane behind the centrosome as it reoriented (Fig. 3B). Close analysis of individual steps in centrosome movement revealed a marked correlation between the instantaneous speed of the centrosome and the MyoRLC intensity differential measured along the direction of movement (Fig. 3C). Thus, larger speeds were associated with higher accumulation of MyoRLC behind the centrosome and greater depletion in front of it. In addition, cross-correlation analysis indicated that loss NMII from the irradiated region preceded centrosome reorientation by 27.0 ± 5.9 s. Hence, NMII remodeling occurred at the right time to influence the polarization response.
Fig. 3.
Reciprocal localization of NMII and dynein after TCR activation. Photoactivation experiments were performed using 5C.C7 T cells expressing MyoRLC-GFP together with either centrin-RFP (A–C) or DynIC-RFP (D and E). MyoRLC-GFP and DynIC-RFP were imaged using TIRF microscopy, and centrin-RFP was imaged with epifluorescence. (A and D) Representative time-lapse montages, with the time of UV irradiation indicated by yellow text. Yellow circles denote the irradiated region in each experiment. Arrowheads in A show MyoRLC-GFP clusters. Time is indicated as minutes:seconds at the top of each image. (Scale bars: 5 μm.) (B and E) Quantification of MyoRLC and DynIC dynamics (n ≥ 10 cells for each curve). Exclusion of MyoRLC from the irradiated region (B and E) and recruitment of DynIC to the irradiated region (E) are shown as ΔF/F, which is normalized background corrected mean fluorescence intensity (MFI). MyoRLC rearrangement was also assessed by calculating the MFI ratio between the back and the front of the T cell (B) (see also SI Materials and Methods). (C) Correlation between centrosome step size and differential accumulation of MyoRLC around the centrosome, calculated at each time point by subtracting the MyoRLC MFI in front of the centrosome from the MFI behind centrosome. Data are sorted based on the step size of the centrosome at the same time point (n = 10 cells; see also SI Materials and Methods). Error bars indicate SEM.
Dynein is recruited to the region of TCR stimulation before the centrosome (4). This recruitment response can be monitored by TIRF imaging in live cells using fluorescently labeled dynein subunits including the intermediate chain (DynIC), the light intermediate chain (DynLIC), and the TcTex light chain (DynLC). Using T cells expressing GFP-labeled MyoRLC together with RFP-labeled DynIC, we found that dynein and NMII adopted reciprocal configurations during polarization responses (Fig. 3 D and E and Movie S2). Whereas dynein was recruited to the irradiated zone, myosin clustered in regions lacking dynein. This marked anticorrelation was detectable both before and after TCR stimulation, suggesting that the reciprocal localization of NMII and dynein is not established by TCR signaling but is merely harnessed by it (Fig. S4A). NMII depletion preceded dynein accumulation in the irradiated region by 24.8 ± 11.5 s, indicating that NMII is reorganized before dynein in this pathway. Taken together with the functional experiments described above, these results support a model whereby dynein “pulls” on the microtubule network from the front while NMII “pushes” it from behind.
It has been reported that NMII accumulates at the IS in T cell–APC conjugates (13), which is seemingly incompatible with the idea that it could influence centrosome polarization from the rear. To investigate this issue, we imaged T cells expressing both MyoRLC-GFP and centrin-RFP together with APCs (Fig. S4B). Although we did occasionally observe synaptic accumulation of NMII, it occurred in less than half of the conjugates we examined (5/14) and, in all cases, lasted less than 3 min. Interestingly, we also observed transient NMII puncta forming on the sides and backs of activated T cells during centrosome reorientation (white arrowheads in Fig. S4B). Although we cannot say with certainty that these puncta are identical to the NMII clusters observed in photoactivation experiments, they formed at the right place and at the right time to be involved in the polarization response. Hence, the localization of NMII in T cell–APC conjugates is not inconsistent with our proposed model.
nPKCs Regulate the Localization of NMII and Dynein.
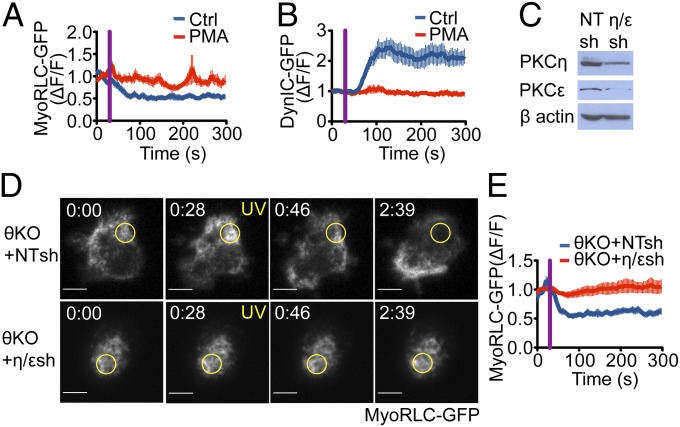
Next, we investigated whether TCR-induced NMII and dynein remodeling require localized DAG accumulation. PMA, which masks the effects of DAG gradients by inducing unpolarized DAG signaling, abrogated both NMII and dynein remodeling in photoactivation experiments (Fig. 4 A and B). This implied a crucial role for localized DAG in the regulation of both motors.
Fig. 4.
NMII and dynein asymmetry is regulated by nPKC activity downstream of DAG. (A and B) T cells (5C.C7) expressing either MyoRLC-GFP (A) or DynIC-GFP (B) were photoactivated and imaged in the presence of 5 ng/mL PMA or vehicle control. Quantification of NMII clearance and dynein recruitment are shown (n ≥ 8 cells per sample). (C–E) T cells (5C.C7) derived from PKCθ−/− (θKO) mice were transduced with MyoRLC-GFP together with the indicated shRNAs and used for photoactivation experiments. (C) Validation of shRNA knockdown by immunoblot, with β actin serving as a loading control. NT, nontargeting shRNA control. (D) Representative time-lapse montages comparing MyoRLC distribution in θKO cells with or without PKCη and PKCε. The time of UV irradiation is indicated by yellow text, and the irradiated region is denoted by yellow circles. (Scale bars: 5 μm.) (E) Quantification of NMII clearance from the irradiated region in θKO cells with or without PKCη and PKCε (n ≥ 10 cells for each sample). MyoRLC and DynIC dynamics were quantified as in Fig. 3, with purple lines indicating UV irradiation. Error bars denote SEM.
DAG promotes centrosome reorientation by recruiting PKCε, PKCη, and PKCθ to the IS (5). To determine whether these kinases are required for the reciprocal distribution of dynein and NMII, we monitored the dynamics of MyoRLC-GFP and DynLC-GFP in T cells lacking various combinations of nPKCs. Simultaneous suppression of PKCη and PKCε, which function redundantly in this pathway (5), did not affect clearance of NMII from the irradiated region (Fig. 4C and Fig. S5A). Likewise, cells derived from PKCθ−/− mice did not exhibit a significant defect in NMII remodeling (Fig. 4 D and E). Suppression of PKCη and PKCε in a PKCθ knockout background, however, completely abrogated NMII dynamics (Fig. 4 D and E and Fig. S5B). Dynein accumulation at the irradiated region was also blocked in cells lacking PKCη, PKCε, and PKCθ (Fig. S5 C and D). These results indicated that nPKC activity is essential for the relocalization of both NMII and dynein. Consistent with this interpretation, relatively low concentrations (500 nM) of the broad specificity PKC inhibitor Gö6983 suppressed TCR-induced NMII depletion and dynein accumulation (Fig. S5 E and F). Taken together, these results demonstrate that PKCη, PKCε, and PKCθ function redundantly to regulate NMII and dynein during centrosome polarization.
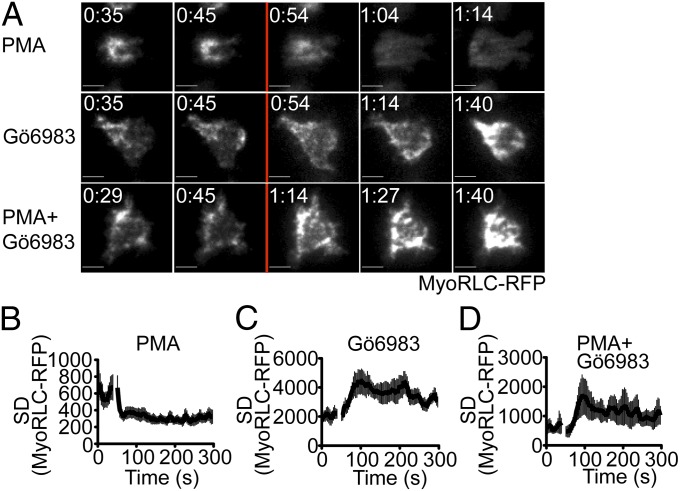
To assess whether PKC activity is sufficient to induce NMII remodeling, we used TIRF microscopy to monitor the effects of acute PKC stimulation on the localization of MyoRLC. PMA, which globally activates PKCs, induced the dramatic dispersion of cortical NMII fibers within seconds (Fig. 5A and Movie S3). We quantified this reorganization by calculating the SD of MyoRLC fluorescence in each cell, which reflects the degree of its clustering (Fig. 5B). Acute inhibition of PKC activity with Gö6983 had the opposite effect, enhancing NMII cluster formation beneath the membrane (Fig. 5 A and C and Movie S4). Simultaneous addition of both PMA and Gö6983 also promoted clustering, indicating that cluster suppression by PMA requires PKC activity (Fig. 5 A and D and Movie S5). These results strongly suggest that PKC-mediated phosphorylation of NMII promotes its dissociation from membrane complexes. Interestingly, acute addition of PMA or Gö6983 had no effect on the cortical distribution of dynein (Fig. S6), implying that global stimulation of PKCs is insufficient to induce dynein recruitment. Hence, whereas PKC activation is sufficient to suppress NMII clustering, the regulation of dynein is likely to be more complex.
Fig. 5.
Acute activation or inhibition of PKC activity induces NMII remodeling. T cells (5C.C7) expressing MyoRLC-RFP were imaged in TIRF and treated with 5 ng/mL PMA or 500 nM Gö6983 as indicated during time-lapse acquisition. (A) Representative time-lapse montages, with addition of reagents indicated by the red line. (Scale bars: 5 μm.) (B–D) Clustering of MyoRLC at the membrane was quantified by calculation of the SD of the fluorescence signals for each cell (n = 10 cells for each curve; see also Materials and Methods). The time of reagent addition is indicated by the gap in each curve. Error bars denote SEM.
PKC Phosphorylation Sites Within MyoRLC Are Required for NMII Suppression.
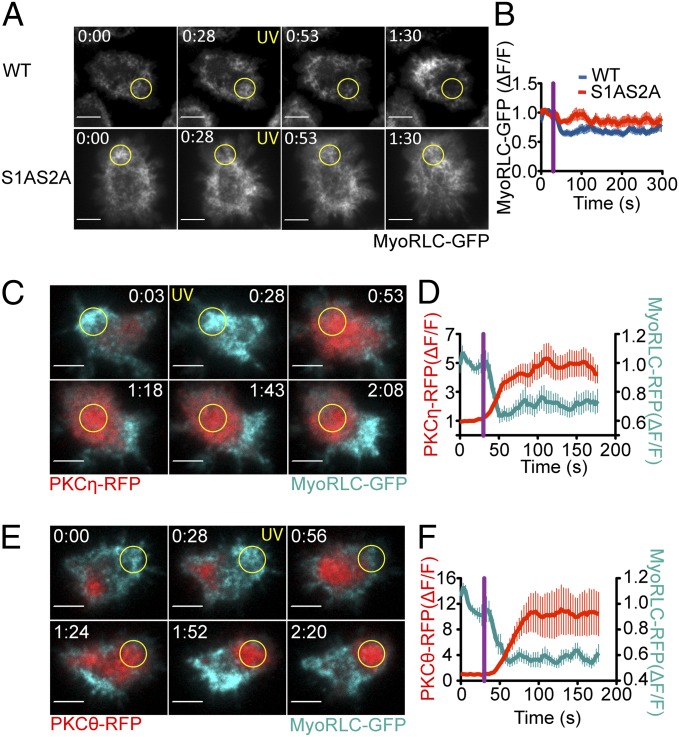
PKC-mediated phosphorylation of MyoRLC at Ser1 and Ser2 has been reported to inhibit NMII function (19–22). To investigate the importance of these phosphorylation events for centrosome polarization, we analyzed the localization of a MyoRLC construct [MyoRLC(S1AS2A)], the N-terminal phosphorylation sites of which were mutated to Ala. MyoRLC(S1AS2A) accumulated in clusters beneath the plasma membrane that were morphologically similar to structures containing wild-type MyoRLC (Fig. 6A). However, whereas photoactivation consistently suppressed clustering of wild-type MyoRLC in the irradiated region, depletion of MyoRLC(S1AS2A) was markedly impaired (Fig. 6 A and B).
Fig. 6.
nPKC recruitment and MyoRLC phosphorylation is associated with NMII remodeling. (A and B) TCR-photoactivation experiments were performed using 5C.C7 T cells expressing either wild-type MyoRLC-GFP or MyoRLC(S1AS2A)-GFP. (A) Representative time-lapse montages, with the time of UV irradiation indicated by yellow text. Yellow circles denote the irradiated region. (B) Quantification of MyoRLC clearance from the irradiated region (n ≥ 10 cells for each sample). (C–F) TCR-photoactivation experiments were performed using 5C.C7 T cells expressing MyoRLC-GFP together with either PKCη-RFP (C and D) or PKCθ-RFP (E and F). (C and E) Representative time-lapse montages, with the time of UV irradiation indicated by yellow text. Yellow circles denote the irradiated region. All probes were imaged in TIRF. (D and F) Quantification of MyoRLC clearance and nPKC recruitment at the irradiated region (n = 10 cells for each sample). Analysis was performed as in Fig. 3, with purple lines indicating UV irradiation. Error bars denote SEM. (All scale bars: 5 μm.)
To determine whether nPKC localization was consistent with a role in NMII remodeling, we performed photoactivation experiments using T cells expressing GFP-labeled MyoRLC together with either RFP-labeled PKCθ or RFP-labeled PKCη. Consistent with prior work (5), TCR photoactivation induced the robust accumulation of both PKCη and PKCθ in the irradiated region (Fig. 6 C–F and Movies S6 and S7). PKCη and PKCθ recruitment was markedly anticorrelated with NMII at all time points (Fig. S4A), consistent with the idea that the nPKCs suppress NMII clustering. We also examined the relationship between PKC activity and NMII using a fluorescently labeled form of Marcksl1, a membrane-associated protein that dissociates when phosphorylated by PKCs (5, 23). As expected, photoactivation of T cells expressing GFP-labeled Marcksl1 together with RFP-labeled MyoRLC induced the clearance of both constructs from the irradiated region (Fig. S7 A and B). Depletion of Marcksl1 preceded loss of NMII by ∼8 s (Fig. S7C). Thus, TCR-induced PKC activation occurred at the right time and place to mediate NMII remodeling.
PKCs are also known to regulate the actin cytoskeleton (24). Thus, it remained possible that the NMII dynamics that we observed were secondary to cortical actin remodeling. To investigate this hypothesis, we imaged T cells expressing GFP-labeled MyoRLC together with RFP-labeled Lifeact, which binds specifically to filamentous (F)-actin (25). TIRF microscopy revealed a splotchy distribution of F-actin beneath the plasma membrane that shifted during cycles of cellular expansion and contraction (Fig. S8A). Although this F-actin partially colocalized with MyoRLC, the formation of NMII clusters was not associated with F-actin enrichment in the same zones. Interestingly, photoactivation of the TCR induced the depletion of F-actin from the irradiated region. This depletion response, however, occurred 24.9 ± 10.0 s after loss of NMII (Fig. S8 B and C), indicating that NMII remodeling is unlikely to be driven by actin in this context.
We also examined the relationship between NMII and peripheral microtubules by imaging T cells expressing MyoRLC-RFP and GFP-tubulin. TIRF microscopy revealed that microtubules close to the plasma membrane were highly dynamic, changing both their length and orientation during polarization responses. There was no clear correlation, however, between these dynamics and NMII remodeling (Fig. S8D). Furthermore, NMII clustering at the rear of the cell was unaffected by depolymerization of microtubules with nocodazole or stabilization with taxol (Fig. S8 E and F). Hence, NMII reorganization occurs independently of microtubules.
Rho-kinase Is Required for NMII Clustering.
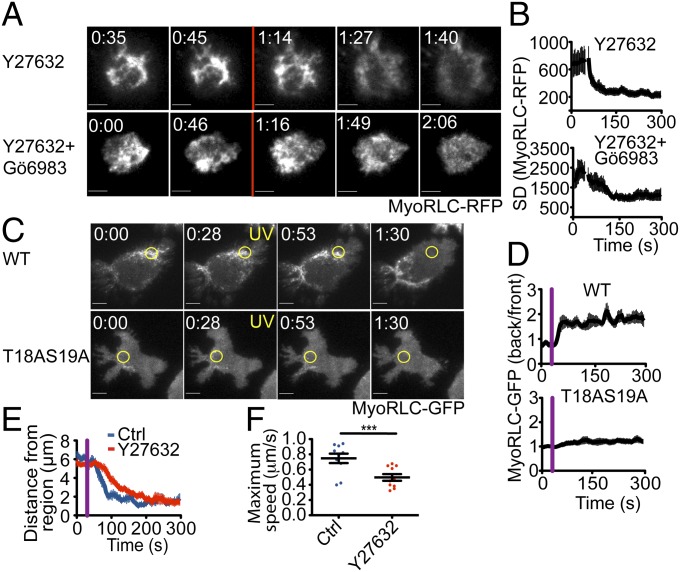
Rho kinase (also called ROCK) activates NMII by phosphorylating MyoRLC at Thr18 and Ser19 (12, 26). To test whether ROCK regulates NMII localization in our system, we treated T cells expressing GFP-labeled MyoRLC with Y27632, a ROCK inhibitor. Y27632 induced the dispersion of cortical NMII clusters in less than a minute, similar to the effects of PMA (Fig. 7 A and B and Movie S8). This dispersion was not reversed by Gö6983, indicating that ROCK is required to stabilize NMII at the plasma membrane, even in the absence of PKC activity (Fig. 7 A and B). We also examined whether the ROCK phosphorylation sites within MyoRLC, Thr18 and Ser19, were required for NMII remodeling in photoactivation experiments. Mutation of both residues to Ala markedly reduced MyoRLC clustering at the membrane (Fig. 7C), and photoactivation of the TCR did not enhance this clustering or induce asymmetry in the NMII distribution (Fig. 7 C and D). Together, these data indicated that ROCK-mediated phosphorylation drives NMII clustering during polarization responses. Consistent with this interpretation, we found that Y27632 delayed centrosome reorientation and also reduced maximum centrosome speed (Fig. 7 E and F). We conclude that ROCK and the nPKCs establish polarizing NMII asymmetry in T cells through opposing phosphoregulation of MyoRLC.
Fig. 7.
ROCK is required for NMII clustering behind the centrosome. (A and B) T cells (5C.C7) expressing MyoRLC-RFP were imaged in TIRF and treated with 50 μM Y27632 and 500 nM Gö6983 as indicated during time-lapse acquisition. (A) Representative time-lapse montages, with addition of reagents indicated by the red line. (B) Quantification of MyoRLC clustering as described in Fig. 5 (n = 8 cells per curve). (C and D) Photoactivation experiments were performed using 5C.C7 T cells expressing either wild-type MyoRLC-GFP or MyoRLC(T18AS19A)-GFP. (C) Representative time-lapse montages, with the time of UV irradiation indicated by yellow text. Yellow circles denote the irradiated region. (D) MyoRLC asymmetry was quantified as described in Fig. 3 (n ≥ 10 cells per sample). (E and F) Centrosome polarization in the presence of 50 μM Y27632 or vehicle control was assessed as described in Fig. 2. (All scale bars: 5 μm.) Purple lines in graphs denote UV irradiation, and error bars indicate SEM. P values were calculated using Student t test. ***P < 0.001.
Discussion
In the present study, we demonstrate that centrosome reorientation in T cells is a collaborative process in which dynein “pulls” on the microtubule network from the front while NMII “pushes” it from behind (Fig. S9). Although we did not initially expect these two motor complexes to function redundantly, it is perhaps not surprising that they do, given the speed of cytoskeletal polarization in T cells and the complexity of the intracellular environment through which the centrosome must move.
The asymmetric distribution adopted by NMII after TCR stimulation suggests two potential mechanisms for how it might influence centrosome polarization. First, NMII clusters may actively move the centrosome by generating force from behind, or second, these clusters may inhibit centrosome polarization until they are suppressed by TCR signaling. Although these possibilities are not mutually exclusive, our data support the former and not the latter. If cortical NMII were inhibiting the approach of the centrosome, one would expect perturbations that globally deplete NMII from the membrane, such as Y27632 or shRNA against MyH9, would promote centrosome reorientation. In fact, they inhibit the response, implying a positive role for NMII. We conclude from these data that TCR-induced suppression of NMII clusters promotes polarization not by derepressing inhibitory effects but, rather, by generating NMII asymmetry, so that forces produced by NMII behind the centrosome are not opposed by forces in front of it.
Precisely how NMII, an actin-based motor, moves the centrosome to the IS from behind is not entirely clear. The strong polarization phenotype that we observed in nocodazole-treated cells suggests that microtubules are necessary for both dynein- and NMII-mediated centrosome translocation. Hence, we favor the hypothesis that force exerted by NMII within the actin cytoskeleton is propagated to the centrosome through microtubules that interface with actin at the cortex (Fig. S9). Myosin-dependent microtubule movement of this kind is known to influence centrosome positioning in cultured epithelial cells (27, 28). This mechanism presumably requires strong and perhaps dynamic coupling between the microtubule and actin cytoskeletons. Interestingly, several proteins that bridge microtubule- and actin-based structures, including the diaphanous formins and the scaffolding protein ADAP, also appear to contribute to centrosome polarization in T cells (7, 29). It will be interesting to determine whether TCR signaling alters the distribution and function of these molecules.
Initial observations indicated that PKC phosphorylation of MyoRLC impairs myosin function by inhibiting the ATPase activity of the motor domain (20, 21). It has been suggested more recently, however, that these phosphorylation events alter the intracellular distribution of NMII (22). Consistent with this recent work, our data indicate that Ser1 and Ser2 phosphorylation by nPKCs suppresses the clustering of NMII in the region of TCR stimulation. nPKC phosphorylation appears to function in this context by antagonizing the effects of ROCK, whose phosphorylation of MyoRLC Thr18 and Ser19 drives the formation of contractile clusters at the membrane (12, 26). Phosphorylation of Ser1 and Ser2 may directly inhibit ROCK-mediated phosphorylation of Thr18 and Ser19. It is also possible, however, that Ser1 and Ser2 phosphorylation overrides the effects of Thr18 and Ser19 phosphorylation within the same MyoRLC subunit.
Although PKC activity appears to be both necessary and sufficient for NMII depletion, our results suggest that it is insufficient, although necessary, for dynein recruitment. It may be that other, PKC-independent pathways are involved in TCR-induced dynein localization. It is also possible, however, that dynein does not respond to PKC activity per se but, rather, to the asymmetric distribution of PKC activity established by DAG accumulation at the IS. A more detailed investigation of these potential mechanisms is warranted, and would be an interesting topic for future studies.
Materials and Methods
Details regarding cell culture and transduction, signaling probes, immunocytochemistry, live imaging of T cell–APC conjugates, and image analysis are available in SI Materials and Methods.
Fixed-Conjugate Analysis.
T cells doubly transduced with shRNA (GFP-marked) and centrin-RFP were pretreated with pharmacological agents including PMA (5 ng/mL; Sigma), nocodazole (30 μM; Sigma), Gö6983 (500 nM; Calbiochem), blebbistatin (50 μM; Sigma), and ciliobrevin D (50 μM) for 10 min and then mixed 1:1 with CH12 cells previously pulsed with 1 μM MCC peptide. When no shRNA was used, T cells were transduced with GFP to distinguish them from the CH12 cells. After incubation at 37 °C for 10 min, cells were resuspended and attached to poly-l-lysine–coated coverslips. Conjugates were fixed with 4% paraformaldehyde in phosphate-buffered saline and imaged using an inverted fluorescence microscope (Olympus) fitted with a 60× objective (1.45 NA). Maximum projection images were generated from 20 × 1 μm sections using SlideBook software (Intelligent Imaging Innovations).
Photoactivation Experiments.
T cells were transferred into minimal imaging medium lacking phenol red and then attached to glass coverslips coated with photocaged MCC–I-Ek (nitrophenylethylurethane as caging group; 125 ng/mL), nonstimulatory I-Ek containing a peptide derived from hemoglobin (amino acids 64–76; 3 μg/mL), and an antibody against H-2Kk (to encourage T-cell attachment to the surface; 0.5 μg/mL; BD Biosciences) (4). Time-lapse images were recorded every 3 or 5 s, for a total of 5 min, using an inverted fluorescence video microscope (Olympus) fitted with a 150× objective (1.45 NA). Labeled centrin was visualized by epifluorescence illumination and all of the other probes by TIRF. GFP and RFP were excited using 488- and 561-nm lasers (Melles-Griot), respectively, and CFP was excited using a DG-4 Xe lamp (Sutter). T cells were photoactivated with a 1.5-s UV pulse after the 10th time point. UV irradiation of defined regions was performed using Mosaic digital diaphragm system (Photonic Instruments) attached to a mercury lamp (Olympus). When necessary, cells were incubated with PMA (5 ng/mL; Sigma), Gö6983 (500 nM; Calbiochem), blebbistatin (50 μM; Sigma), and Y-27632 (50 μM; Sigma) for 10 min before imaging. In experiments involving acute inhibition of or activation of PKC and ROCK, cells were imaged in TIRF using a 60× objective (1.45 NA). Pharmacological agents were added to the medium between the 15th and 16th time points of image acquisition.
Supplementary Material
Acknowledgments
We thank N. Bantilan and S. Huey for technical assistance; the Microchemistry and Molecular Cytology Core Facilities at Memorial Sloan-Kettering Cancer Center for peptide synthesis and confocal microscopy, respectively; D. Littman for PKCθ-deficient mice; A. Hall and J. Hammer for critical reading of the manuscript; and members of the laboratories of M.H. and M. O. Li for helpful discussions. This work was supported by US National Institutes of Health Grants R01-AI087644 (to M.H.), R01-GM65933 (to T.M.K.), and R01-CA136574 (to J.K.C.).
Footnotes
The authors declare no conflict of interest.
This article is a PNAS Direct Submission.
This article contains supporting information online at www.pnas.org/lookup/suppl/doi:10.1073/pnas.1306180110/-/DCSupplemental.
References
- 1.Bornens M. The centrosome in cells and organisms. Science. 2012;335(6067):422–426. doi: 10.1126/science.1209037. [DOI] [PubMed] [Google Scholar]
- 2.Huse M. (2012) Microtubule-organizing center polarity and the immunological synapse: Protein kinase C and beyond. Front Immunol 3:235. [DOI] [PMC free article] [PubMed]
- 3.Guy CS, Vignali DA. Organization of proximal signal initiation at the TCR:CD3 complex. Immunol Rev. 2009;232(1):7–21. doi: 10.1111/j.1600-065X.2009.00843.x. [DOI] [PMC free article] [PubMed] [Google Scholar]
- 4.Quann EJ, Merino E, Furuta T, Huse M. Localized diacylglycerol drives the polarization of the microtubule-organizing center in T cells. Nat Immunol. 2009;10(6):627–635. doi: 10.1038/ni.1734. [DOI] [PubMed] [Google Scholar]
- 5.Quann EJ, Liu X, Altan-Bonnet G, Huse M. A cascade of protein kinase C isozymes promotes cytoskeletal polarization in T cells. Nat Immunol. 2011;12(7):647–654. doi: 10.1038/ni.2033. [DOI] [PMC free article] [PubMed] [Google Scholar]
- 6.Kardon JR, Vale RD. Regulators of the cytoplasmic dynein motor. Nat Rev Mol Cell Biol. 2009;10(12):854–865. doi: 10.1038/nrm2804. [DOI] [PMC free article] [PubMed] [Google Scholar]
- 7.Combs J, et al. Recruitment of dynein to the Jurkat immunological synapse. Proc Natl Acad Sci USA. 2006;103(40):14883–14888. doi: 10.1073/pnas.0600914103. [DOI] [PMC free article] [PubMed] [Google Scholar]
- 8.Martín-Cófreces NB, et al. MTOC translocation modulates IS formation and controls sustained T cell signaling. J Cell Biol. 2008;182(5):951–962. doi: 10.1083/jcb.200801014. [DOI] [PMC free article] [PubMed] [Google Scholar]
- 9.Hashimoto-Tane A, et al. Dynein-driven transport of T cell receptor microclusters regulates immune synapse formation and T cell activation. Immunity. 2011;34(6):919–931. doi: 10.1016/j.immuni.2011.05.012. [DOI] [PubMed] [Google Scholar]
- 10.Gomes ER, Jani S, Gundersen GG. Nuclear movement regulated by Cdc42, MRCK, myosin, and actin flow establishes MTOC polarization in migrating cells. Cell. 2005;121(3):451–463. doi: 10.1016/j.cell.2005.02.022. [DOI] [PubMed] [Google Scholar]
- 11.Tsai JW, Bremner KH, Vallee RB. Dual subcellular roles for LIS1 and dynein in radial neuronal migration in live brain tissue. Nat Neurosci. 2007;10(8):970–979. doi: 10.1038/nn1934. [DOI] [PubMed] [Google Scholar]
- 12.Vicente-Manzanares M, Ma X, Adelstein RS, Horwitz AR. Non-muscle myosin II takes centre stage in cell adhesion and migration. Nat Rev Mol Cell Biol. 2009;10(11):778–790. doi: 10.1038/nrm2786. [DOI] [PMC free article] [PubMed] [Google Scholar]
- 13.Jacobelli J, Chmura SA, Buxton DB, Davis MM, Krummel MF. A single class II myosin modulates T cell motility and stopping, but not synapse formation. Nat Immunol. 2004;5(5):531–538. doi: 10.1038/ni1065. [DOI] [PubMed] [Google Scholar]
- 14.Babich A, et al. F-actin polymerization and retrograde flow drive sustained PLCγ1 signaling during T cell activation. J Cell Biol. 2012;197(6):775–787. doi: 10.1083/jcb.201201018. [DOI] [PMC free article] [PubMed] [Google Scholar]
- 15.Ilani T, Vasiliver-Shamis G, Vardhana S, Bretscher A, Dustin ML. T cell antigen receptor signaling and immunological synapse stability require myosin IIA. Nat Immunol. 2009;10(5):531–539. doi: 10.1038/ni.1723. [DOI] [PMC free article] [PubMed] [Google Scholar]
- 16.Yi J, Wu XS, Crites T, Hammer JA., 3rd Actin retrograde flow and actomyosin II arc contraction drive receptor cluster dynamics at the immunological synapse in Jurkat T cells. Mol Biol Cell. 2012;23(5):834–852. doi: 10.1091/mbc.E11-08-0731. [DOI] [PMC free article] [PubMed] [Google Scholar]
- 17.Firestone AJ, et al. Small-molecule inhibitors of the AAA+ ATPase motor cytoplasmic dynein. Nature. 2012;484(7392):125–129. doi: 10.1038/nature10936. [DOI] [PMC free article] [PubMed] [Google Scholar]
- 18.Huse M, et al. Spatial and temporal dynamics of T cell receptor signaling with a photoactivatable agonist. Immunity. 2007;27(1):76–88. doi: 10.1016/j.immuni.2007.05.017. [DOI] [PubMed] [Google Scholar]
- 19.Bengur AR, Robinson EA, Appella E, Sellers JR. Sequence of the sites phosphorylated by protein kinase C in the smooth muscle myosin light chain. J Biol Chem. 1987;262(16):7613–7617. [PubMed] [Google Scholar]
- 20.Ikebe M, Hartshorne DJ, Elzinga M. Phosphorylation of the 20,000-dalton light chain of smooth muscle myosin by the calcium-activated, phospholipid-dependent protein kinase. Phosphorylation sites and effects of phosphorylation. J Biol Chem. 1987;262(20):9569–9573. [PubMed] [Google Scholar]
- 21.Ikebe M, Reardon S. Phosphorylation of bovine platelet myosin by protein kinase C. Biochemistry. 1990;29(11):2713–2720. doi: 10.1021/bi00463a014. [DOI] [PubMed] [Google Scholar]
- 22.Komatsu S, Ikebe M. The phosphorylation of myosin II at the Ser1 and Ser2 is critical for normal platelet-derived growth factor induced reorganization of myosin filaments. Mol Biol Cell. 2007;18(12):5081–5090. doi: 10.1091/mbc.E06-12-1076. [DOI] [PMC free article] [PubMed] [Google Scholar]
- 23.Arbuzova A, Schmitz AA, Vergères G. Cross-talk unfolded: MARCKS proteins. Biochem J. 2002;362(Pt 1):1–12. doi: 10.1042/0264-6021:3620001. [DOI] [PMC free article] [PubMed] [Google Scholar]
- 24.Larsson C. Protein kinase C and the regulation of the actin cytoskeleton. Cell Signal. 2006;18(3):276–284. doi: 10.1016/j.cellsig.2005.07.010. [DOI] [PubMed] [Google Scholar]
- 25.Riedl J, et al. Lifeact: A versatile marker to visualize F-actin. Nat Methods. 2008;5(7):605–607. doi: 10.1038/nmeth.1220. [DOI] [PMC free article] [PubMed] [Google Scholar]
- 26.Riento K, Ridley AJ. Rocks: Multifunctional kinases in cell behaviour. Nat Rev Mol Cell Biol. 2003;4(6):446–456. doi: 10.1038/nrm1128. [DOI] [PubMed] [Google Scholar]
- 27.Burakov A, Nadezhdina E, Slepchenko B, Rodionov V. Centrosome positioning in interphase cells. J Cell Biol. 2003;162(6):963–969. doi: 10.1083/jcb.200305082. [DOI] [PMC free article] [PubMed] [Google Scholar]
- 28.Zhu J, Burakov A, Rodionov V, Mogilner A. Finding the cell center by a balance of dynein and myosin pulling and microtubule pushing: A computational study. Mol Biol Cell. 2010;21(24):4418–4427. doi: 10.1091/mbc.E10-07-0627. [DOI] [PMC free article] [PubMed] [Google Scholar]
- 29.Gomez TS, et al. Formins regulate the actin-related protein 2/3 complex-independent polarization of the centrosome to the immunological synapse. Immunity. 2007;26(2):177–190. doi: 10.1016/j.immuni.2007.01.008. [DOI] [PMC free article] [PubMed] [Google Scholar]
Associated Data
This section collects any data citations, data availability statements, or supplementary materials included in this article.


