

Abstract
Background and Aims
Recent research on the history of Platanus reveals that hybridization phenomena occurred in the central American species. This study has two goals: to help resolve the evolutive puzzle of central American Platanus, and to test the potential of real-time polymerase chain reaction (PCR) for detecting ancient hybridization.
Methods
Sequencing of a uniparental plastid DNA marker [psbA-trnH(GUG) intergenic spacer] and qualitative and quantitative single nucleotide polymorphism (SNP) genotyping of biparental nuclear ribosomal DNA (nrDNA) markers [LEAFY intron 2 (LFY-i2) and internal transcribed spacer 2 (ITS2)] were used.
Key Results
Based on the SNP genotyping results, several Platanus accessions show the presence of hybridization/introgression, including some accessions of P. rzedowskii and of P. mexicana var. interior and one of P. mexicana var. mexicana from Oaxaca (= P. oaxacana). Based on haplotype analyses of the psbA-trnH spacer, five haplotypes were detected. The most common of these is present in taxa belonging to P. orientalis, P. racemosa sensu lato, some accessions of P. occidentalis sensu stricto (s.s.) from Texas, P. occidentalis var. palmeri, P. mexicana s.s. and P. rzedowskii. This is highly relevant to genetic relationships with the haplotypes present in P. occidentalis s.s. and P. mexicana var. interior.
Conclusions
Hybridization and introgression events between lineages ancestral to modern central and eastern North American Platanus species occurred. Plastid haplotypes and qualitative and quantitative SNP genotyping provide information critical for understanding the complex history of Mexican Platanus. Compared with the usual molecular techniques of sub-cloning, sequencing and genotyping, real-time PCR assay is a quick and sensitive technique for analysing complex evolutionary patterns.
Keywords: Central America, genotyping, hybridization, introgression, internal transcribed spacer 2, LEAFY intron 2, Platanus, psbA-trnH(GUG) intergenic spacer, real-time PCR, sequencing, SNP
INTRODUCTION
Recent studies examining the history of Platanus L. have revealed that complex hybridization phenomena have occurred in central American Platanus (Nixon and Poole, 2003; Feng et al., 2005; Grimm and Denk, 2008, 2010; Denk et al., 2012). The genus Platanus (Platanaceae) includes two major lineages, each corresponding to a subgenus: the monotypic Castaneophyllum J.F.Leroy (with P. kerrii Gagnep., endemic to Indochina) and subgenus Platanus J.F.Leroy, with all other species (Nixon and Poole, 2003). The most recent taxonomic treatments of the latter subgenus recognize six species distributed throughout the Northern Hemisphere, with a variable number of varieties (Nixon and Poole, 2003; Grimm and Denk, 2008, 2010; Denk et al., 2012).
The fossil record of Platanaceae is excellent and well dated (leaves and reproductive structures date back to the Albian, late early Cretaceous) (Crane et al., 1993; Friis and Crane, 1998; Kvaček et al., 2001; Maslova, 2003). A historical biogeographic investigation recently carried out on Platanus by Feng et al. (2005) indicated that vicariance events have played a fundamental role in the present-day distribution of the genus. However, the recent history of Platanus is not entirely clear because the extant species (especially the Mexican taxa) show a considerable number of overlapping morphological characteristics, especially in regard to leaf shape, the number of capitula per inflorescence and various achene characters (Nixon and Poole, 2003). Cytological data for the genus are incomplete, and are almost entirely missing for the central American species. In the Old World species, n = 21 has always been observed (Ernst, 1963; Morawetz and Samuel, 1989; Oginuma and Tobe, 1991; Zemskova, 1993; Hanson et al., 2001; Chen et al., 2003; Ivanova, 2005).
In a comprehensive morphological and taxonomical revision of the central American Platanus spp. (Nixon and Poole, 2003), the authors suggested that interspecific hybridization and reticulation could have been important factors in the evolution of the genus, because of the intermediate morphologies and the high levels of interfertility detected. According to Nixon and Poole (2003), four species and six varieties are present in eastern Mexico and adjacent regions of the USA: P. occidentalis L. var. occidentalis, P. occidentalis var. palmeri (Kuntze) Nixon & Poole ex Geerinck, P. mexicana Moric. var. mexicana, P. mexicana var. interior Nixon & Poole, P. racemosa Nutt. var. racemosa, P. racemosa var. wrightii Benson and P. rzedowskii Nixon & Poole.
Sympatry is documented only for the varieties of P. occidentalis from Texas (USA) (Fig. 1); however, Nixon and Poole (2003) suggested that contact zones probably occurred in the past for P. rzedowskii and P. mexicana sensu stricto (s.s.), P. occidentalis var. palmeri and P. racemosa var. wrightii, and P. mexicana var. interior and P. occidentalis var. palmeri.
Fig. 1.

Geographical range and localities of Platanus taxa analysed belonging to the ANA clade (Grimm and Denk, 2008) in eastern Mexico and the adjacent USA (US), Belize (B), Guatemala (G) and Honduras (H). Lines correspond to the geographical boundary of each Platanus taxon, except for the north-eastern distribution of P. occidentalis var. occidentalis which is partially shown [(O1 → O6)†]; symbols correspond to the Platanus taxa analysed. Information is also shown for plastid DNA haplotypes (coloured symbols) and nrDNA SNP data (alphabetical codes). Codes in underlined bold type and asterisks indicate specimens with heterozygosity patterns for ITS2 and LFY-i2 genotypes, respectively. For further details, see Fig. 5.
Some synonyms of P. mexicana var. mexicana are still of questionable nomenclatural status, i.e. P. chiapensis Standl. (from Chiapas, Mexico) and P. oaxacana Standl. (from Oaxaca, Mexico). Their origin and distinctness have caused debate among taxonomists without arriving at a solution (Nixon and Poole, 2003; Feng et al., 2005).
Recently, molecular analyses paying special attention to subgenus Platanus have provided a greater understanding of the evolutionary history of the genus (Feng et al., 2005; Grimm and Denk, 2008, 2010). These authors agree that hybridization, rather than incomplete lineage sorting, has played a role in the evolution of the central American Platanus spp., and several speculations have been made about their evolutionary history.
In light of their molecular results [based on internal transcribed spacer (ITS) sequences], Grimm and Denk (2008) sub-divided subgenus Platanus into a Pacific North American–European (PNA-E) clade (P. orientalis L. and P. racemosa species aggregate) and an Atlantic North American (ANA) clade [P. mexicana sensu lato (s.l.), P. occidentalis s.l. and P. rzedowskii]. Successively, Grimm and Denk (2010) established a framework for the evolutionary unfolding of Platanus, using evidence from three nuclear DNA regions [ITS, 5S-intergenic spacer (IGS) and LEAFY intron 2 (LFY-i2)]. Based on their results, they suggested an ancient hybridization between lineages ancestral to the modern P. occidentalis and P. mexicana complex. Specifically, P. occidentalis var. palmeri, P. mexicana var. interior and P. rzedowskii may be the result of hybridization. In addition, the last two taxa appear to have a complex history, including possible reticulation and gene flow among several other taxa. Accordingly, major contributors to P. mexicana var. interior could have been P. rzedowskii and P. occidentalis var. palmeri. Major contributors to P. rzedowskii could have been P. mexicana s.s. and P. occidentalis var. palmeri. However, P. occidentalis var. occidentalis may also have played a role in the formation of P. rzedowskii, as also reported by Nixon and Poole (2003) and Feng et al. (2005). Finally, Grimm and Denk (2010) underline the possibility that the PNA-E clade may have played a fundamental role in the evolution of the central American Platanus (ANA clade) and especially of P. occidentalis s.l. and P. rzedowskii.
The purpose of this study is to add new information to resolve speculations about the complex history of subgenus Platanus in eastern Mexico and adjacent areas in the USA. Here we address the following questions. (1) Were the PNA-E taxa (P. orientalis and P. racemosa s.l.) involved in the origin of P. occidentalis s.l. and P. rzedowskii, as hypothesized by Grimm and Denk (2010)? (2) Are the hybridization events recorded in the literature specific to P. rzedowskii, or do they represent a more widespread phenomenon in these taxa? (3) Do the problematic taxa P. oaxacana and P. chiapensis actually correspond to P. mexicana s.s., as proposed by Nixon and Poole (2003)?
To address (1) we employed sequencing of a uniparental plastid DNA marker and, to address (2) and (3), qualitative and quantitative genotyping of single nucleotide polymorphisms (SNPs) of biparental nuclear ribosomal DNA (nrDNA) markers already tested by Grimm and Denk (2008, 2010; LFY-i2 and ITS).
A further goal of this study was to assess the potential of real-time polymerase chain reaction (PCR) for detection of ancient hybridization phenomena in plants. This technique has been employed for the last 20 years in a range of molecular biological applications (Van Guilder et al., 2008) but is now being used increasingly for identification and hybrid recognition purposes (e.g. Werth et al., 2010; Baerwald et al., 2011; Culumber et al., 2011; Harwood and Phillips, 2011; Matejusová et al., 2012).
MATERIALS AND METHODS
Plant material and DNA extraction
Eighty-eight specimens of Platanus were collected in the field or obtained through the generosity of Guido Grimm, Thomas Denk and the herbaria US and TEX (Supplementary Data File S1). Some of the samples obtained from G. Grimm and T. Denk are the same as those described previously in their works (Grimm and Denk, 2008, 2010). Voucher specimens were deposited at NAP, S, US or TEX herbaria. The sampling for each taxon from the ANA clade was employed to reflect the real distribution as accurately as possible (Fig. 1). As maternal tissue, five achenes (pericarps) were analysed in the holotype P. oaxacana sheet (US 00888488, Fig. 2), with the exceptional permission of the Smithsonian Institution (US National Herbarium), gratefully acknowledged here.
Fig. 2.
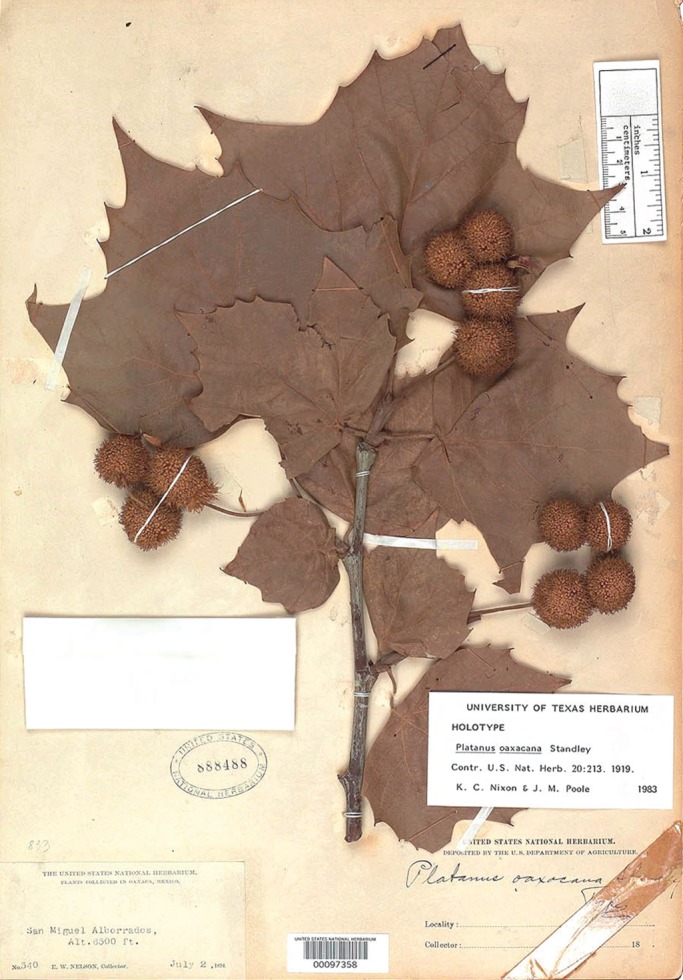
Holotype of Platanus oaxacana Standl.; San Miguel Alborrados (Oaxaca, Mexico), 2 July 1894, E. W. Nelson 540 (US 00888488).
Total DNA was isolated according to the method of Doyle and Doyle (1987), using approx. 50 mg of dehydrated leaf tissue and a chloroform–isoamyl alcohol (24:1) purification step. The DNA was resuspended in 50 µL of sterile water. The concentration was estimated by a comparison of 1 µL of DNA with a DNA standard (Marker II, AppliChem GmbH) on a 0·8 % agarose gel containing 0·5 µg mL−1 ethidium bromide.
PCR amplification, sequencing and analysis of plastid DNA markers
Except in a few cases of documented biparental inheritance (Corriveau and Coleman, 1988; Hansen et al., 2007), in most angiosperms the genome of plastids is inherited maternally through the seeds (Corriveau and Coleman, 1988); as a consequence, plastid DNA may provide insight into the fraction of maternal contribution (i.e. seed dispersal) to the genetic composition of the taxa investigated.
To discriminate among the 88 Platanus specimens investigated (Supplementary Data File S1), two types of non-coding plastid DNA markers were tested. The markers included introns [rps16 and trnL(UAA)] and intergenic spacers [trnT(UGU)-trnL(UAA), atpB-rbcL and psbA-trnH(GUG)]. Molecular markers were amplified using both primers reported in the literature and also new primers designed in this study (Table 1). The volume of each amplification reaction was 25 µL, using 5 ng of template, 12·5 µL of DreamTaq™ PCR Master Mix (Fermentas, Thermo Fisher Scientific) and 0·125 µL of 50 µM primer. The cycling parameters were: initial denaturation at 95 °C for 3 min, followed by 30–35 cycles of denaturation at 95 °C for 30 s, annealing for 1 min as a function of the Tm of the primers used, and extension at 72 °C for 1 min. A final extension at 72 °C for 5 min was included.
Table 1.
Primers used for PCR amplification and/or cycle sequencing of plastid and nuclear DNA regions of the Platanus taxa sequenced in the study
| Primer | Sequence (5′–3′) | Reference |
|---|---|---|
| Rps16 intron | ||
| Forward: rpsF | GTG GTA GAA AGC AAC GTG CGA CTT | Oxelman et al. (1997) |
| Reverse: rpsR2 | TCG GGA TCG AAC ATC AAT TGC AAC | Oxelman et al. (1997) |
| TrnL(UAA) intron | ||
| Forward: c | CGA AAT CGG TAG ACG CTA CG | Taberlet et al. (1991) |
| Reverse: d | GGG GAT AGA GGG ACT TGA AC | Taberlet et al. (1991) |
| AtpB-rbcL intergenic spacer | ||
| Forward: oligo 2 | GAA GTA GTA GGA TTG ATT CTC | Manen et al. (1994) |
| Reverse: oligo 5 | TAC AGT TGT CCA TGT ACC AG | Manen et al. (1994) |
| TrnT(UGU)-trnL(UAA) intergenic spacer | ||
| Forward: PL_T1 | GTA AAC TAC TGA GAT CTT AGC | This study |
| Reverse: PL_T2 | AGA TAT TGA TGA TTG ATA ATC G | This study |
| PsbA-trnH(GUG) intergenic spacer | ||
| Forward: psbA3′f | GTT ATG CAT GAA CGT AAT GCT C | Sang et al. (1997) |
| Reverse: trnHf | CGC GCA TGG TGG ATT CAC AAT CC | Tate and Simpson (2003) |
| Forward : PL_psbA3′f_int ∼ 100 | GTA AAA ACA TTA CTA CGG G | This study |
| Reverse: PL_trnHf_int ∼ 400 | GGA ATT TCT ACC ATT CAT C | This study |
| LEAFY intron 2 (LFY-i2) | ||
| Forward: PlaLFY5 | GTA ACT GGA CAT CCG ATC TGA TAT CC | Feng et al. (2005) |
| Reverse: PlaLFY4 | AGC ATA GCA GTG CAC ATA GTG TCT C | Feng et al. (2005) |
| Forward: PL_L-ex2_F internal | AGG TTG GTA TGT GCT TGG C | This study |
| Internal transcribed spacer (ITS) | ||
| Forward: 18S (3′) | GGA GAA GTC GTA ACA AGG TTT CCG | Aceto et al. (1999) |
| Forward: 5·8S (3′) | TTG CAG AAT CCC GTG AAC CAT CG | Aceto et al. (1999) |
| Reverse: 26S (5′) | CCA AAC AAC CCG ACT CGT AGA CAG C | Aceto et al. (1999) |
| Reverse: 26S (5′) internal | TTC GCT CGC CGT TAC TAA GGG | This study |
Either a GeneAmp® PCR System 2700 thermal cycler (Applied Biosystems, Life Technologies) or a My Cycler™-Thermal Cycler (Bio-Rad) was used for amplification. The amplified products were purified using a DNA Enzyme-free isolation Spin-Kit (AppliChem GmbH), and 50–100 ng of purified templates were sequenced according to the method of Di Maio and De Castro (2013), using the fluorescent dye (Big Dye™ Terminator Cycle Sequencing Kit ver. 3.1, Applied Biosystems, Life Technologies) and a 3130 Genetic Analyzer (Applied Biosystems, Life Technologies). Complete sequences of both strands of each PCR product were processed, aligned and visually checked using the AB DNA Sequencing Analysis version 5.2 (Applied Biosystems, Life Technologies), Sequence Navigator version 1.0.1 (ABI Prism, Perkin Elmer) and BioEdit version 7.0.9.0 software (Hall, 1999).
Haplotypes were identified based on the variation of the sequences of the markers analysed. A geographical map of the haplotypes was prepared and a network was created based on the median-joining algorithm (Bandelt et al., 1999) to evaluate possible genetic relationships between haplotypes (Network version 4.6.0.0 software, available at http://www.fluxus-engineering.com/index.htm).
SNP qualitative and quantitative genotyping
In total, 75 specimens belonging to the ANA clade were analysed (Supplementary Data File S1): 18 for P. mexicana s.s.; 15 for P. mexicana var. interior; 12 for P. occidentalis s.str.; 15 for P. occidentalis var. palmeri; and 15 for P. rzedowskii.
LEAFY intron 2
LEAFY is a single-copy nuclear plant gene with a structure of three exons and two introns. According to Feng et al. (2005) and Grimm and Denk (2010), the 3′ region of the second intron of LEAFY (LFY-i2) presents considerable molecular variation in Platanus spp. Grimm and Denk (2010) used LFY-i2 and its variants (i.e. ancestral sequences) to detect ancient hybridizations between lineages ancestral to the modern American Platanus taxa.
After preliminary screening of a data set of all LFY-i2 sequences by direct-PCR and clones (including its ancestral variants) present in the EMBL Nucleotide Sequence Database (EMBL-Bank), which is based on the work of Feng et al. (2005) and Grimm and Denk (2010), we observed informative point mutations to discriminate between P. mexicana s.s. (except for two accession from Chiapas; direct-PCR sequences, AY706049–AY706050) and P. occidentalis s.l. (i.e. both varieties), owing to the presence of two SNPs (positions 421 and 550 bp in Supplementary Data File S2). These positions present a guanine nucleotide (421 bp) and thymine nucleotide (550 bp) in LFY-i2 of P. mexicana s.s. and an adenine nucleotide (421 bp) and guanine nucleotide (550 bp) in P. occidentalis s.l.
After an analysis of nucleotide sequence composition near the SNP trough, by the Custom TaqMan® Genomic SNP Genotyping Assay Service (Applied Biosystems, Life Technologies), the two SNPs were suitable for a qualitative genotyping using a SNaPshot™ Multiplex Kit and end-point PCR.
For the SNP assay, LFY-i2 marker was amplified using the primers described in Feng et al. (2005; Table 1). Because the forward primer reported in the literature (Feng et al., 2005) failed to produce efficient amplification for some taxa, we designed an internal primer that amplified the area of interest (Table 1). Amplification reactions were carried out employing the TITANIUM™ Taq PCR Kit (Clontech Laboratories, Inc.).
The probe sequences and their relative SNPs are shown in Table 2. Probe sequences were analysed for secondary structures, complementarity and specificity. The SNaPshot assay is based on a single nucleotide oligo (probe) extension using a fluorescently tagged ddNTP for sites on an amplicon that show species-specific polymorphism. As such, the end of a probe must be immediately adjacent to the SNP, which means that when optimizing primers, only length and directionality can be varied. To multiplex the SNPs, the probes must each be separated by 4–5 bp in length so that the fluorescent peaks can be individually interpreted. To achieve this separation, we added variable length poly(T) tails to the 5′ end of a probes to allow separation of SNaPshot products on the basis of size (Hurst et al., 2009) (Table 2).
Table 2.
nrDNA SNP loci analysed with the qualitative assay and relative probes for LEAFY intron 2 (LFY-i2) and internal transcribed spacer 2 (ITS2)
| Code | SNP | bp | Probe (5′–3′) | Length (bp) | Tm |
|---|---|---|---|---|---|
| LFY-i2* | |||||
| LFY-1 | G/A | 421 | T10-CGT TTG GCA GCC ACC TG | 27 | 56 °C |
| LFY-2 | T/G | 550 | T10-AGY TTT ACT TWA AAG CCT ACT AAA TA | 36 | 56 °C |
| ITS2† | |||||
| ITS-a | T/G | 163 | T5-CCC CCC GTG TGY CGT GT | 22 | 58 °C |
| ITS-b | G/A | 298 | T16-GCC CCG GAG ACC CCG | 31 | 58 °C |
Further details about SNP sequence position are shown in *Supplementary Data File S2 and †Supplementary Data File S3.
To remove unincorporated dNTPs and extra primers from LFY-i2 amplifications, enzymatic reactions were carried out with 5 U of shrimp alkaline phosphatase (SAP) (USB, Affymetrix, Inc.) and 2 U of exonuclease I (Exo I) (USB, Affymetrix, Inc.) at 37 °C for 60 min; the solution was then heated to 80 °C for 15 min to denature the enzymes.
The PCR amplification of SNaPshot probes followed the protocol presented in the Applied Biosystems manual with minor modification. Briefly, for each reaction (final volume 5 µL), we used 2·5 µL of SNaPshot reaction mix, 0·2 µM of each probe and 0·1 pmol of PCR template (LFY-i2 amplification). The reaction was then cycled 25 times for 10 s at 96 °C, 5 s at 56 °C and 30 s at 60 °C. We used a final SAP clean-up step, adding 1 U of SAP and incubating at 37 °C for 60 min and then heating at 75 °C for 15 min. Samples were electrophoresed on a 3130 Genetic Analyzer (Applied Biosystems, Life Technologies) with a fluorescently labelled internal size standard (GeneScan®-120 LIZ, Applied Biosystems, Life Technologies). Raw data were scored with the internal size standard using Peak Scanner version 1.0 software (Applied Biosystems, Life Technologies).
ITS
The internal transcribed spacer is a multicopy marker that can be prone to gene conversion and concerted evolution (Feliner and Rosselló, 2007). Grimm and Denk (2008) have shown that the homogenization in Platanus is incomplete owing to the presence of several highly variable ITS variants (functional, not pseudogenes). The rate of mutation is higher than the level of homogenization in these sequences. According to Grimm and Denk (2008, 2010), this marker has proved useful for inferring hybridization events in the evolutionary history of Platanus.
In this case, the SNP screening was similar to that reported for LFY-i2 (see above). After a preliminary screening of a large data set of ITS nrDNA sequences by direct-PCR and clones (including all ITS variants) present in the EMBL Nucleotide Sequence Database (EMBL-Bank), based on the work of Feng et al. (2005) and Grimm and Denk (2008, 2010), we chose the ITS2 marker (including its variants) because it discriminated well between P. mexicana s.s. and P. occidentalis s.l., owing to the presence of three SNPs between the sequences (base positions 130, 163 and 298 – see Supplementary Data File S3). These positions presented a cytosine nucleotide (130 bp), thymine nucleotide (163 bp) and a guanine nucleotide (298 bp) in all the ITS2 accessions of P. mexicana s.s. and with a thymine nucleotide (130 bp), deletion with the next nucleotide was a guanine (163 bp), adenine nucleotide (298 bp) in P. occidentalis s.l.
After an analysis of nucleotide sequence composition near the SNP troughs, by the Custom TaqMan® Genomic SNP Genotyping Assay Service (Applied Biosystems, Life Technologies), only the first SNP was found to be suitable for quantitative genotyping using the TaqMan® MGB probes assay and real-time PCR, and the last two SNPs for a qualitative genotyping using a SNaPshot™ Multiplex Kit and end-point PCR.
For both SNP assays, ITS2 markers were amplified using the primers described in Aceto et al. (1999; Table 1). Amplification reactions were carried out employing the TITANIUM™ Taq PCR Kit (Clontech Laboratories, Inc.).
For the SNaPshot assay, the probe sequences and their relative SNPs are shown in Table 2. The SNaPshot method was the same as described above for LFY-i2, except for the annealing temperature of 58 °C.
For the quantitative assay, the forward and reverse primers and the fluorescence-labelled probes for each species showing nucleotide polymorphism (P. mexicana s.s. and P. occidentalis s.l.) were designed using the Assay-by-DesignSM Service for the SNP Genotyping Assays (TaqMan® MGB Probes, FAM™ and VIC® dye-labelled) (Applied Biosystems, Life Technologies). These assays were designed for the genotyping of specific SNPs and each assay enables scoring of both alleles in a single well. The forward and reverse primer sequences were 5′-ACC CCA CGG GAT GG C-3′ and 5′-AAC CAC CAC TCG TCG TGA C-3′, respectively. The probes used were 5′-VIC-TCC GCT CCC GAA CCG-3′ for P. mexicana s.s. [MEX (C)] and 5′-FAM-CGC TCC CAA ACC G-3′ for P. occidentalis s.l. [OCC (T)]. The primer and probe positions are shown in Fig. 3. Genotyping was performed in 25 µL reactions including 30 pg of ITS2 template, 12·5 µL of 2× TaqMan® Universal PCR Master Mix, No AmpErase® UNG (Applied Biosystems, Life Technologies), 0·625 µL of 40× SNP Genotyping Assay Mix (Applied Biosystems, Life Technologies) and sterile water. The optimal starting template in each sample (standard included) was calculated by determining the threshold cycle (Ct) for several dilutions. The Ct was the cycle in which the first significant increase in fluorescence was detected. Two standards for both alleles were used, and each was serially diluted at intervals from 10−3 to 10−6. The standards were obtained by sub-cloning the ITS2 fragments of P. mexicana var. mexicana (code M15) and P. occidentalis var. occidentalis (code O3) using the CloneJET™ PCR Cloning Kit (Fermentas Life Sciences). Positive and negative controls for both alleles were included in each genotyping plate.
Fig. 3.

(A) Outline of the nrDNA ITS and locations of oligonucleotides used as primers for PCRs and DNA sequencing in Platanus accessions. See Table 1 for the nucleotide sequence of each primer. (B) Alignment of partial sequences in ITS2 P. mexicana s.s. and P. occidentalis s.l. Boxes show the sequences used for the primers and probes. The nucleotides in the probes distinct for P. mexicana s.s. and P. occidentalis s.l. are indicated with asterisks. The SNP position corresponds to position 130 in the Supplementary Data File S3.
The PCR cycling conditions were chosen according to the standard protocol recommended by the manufacturer (95 °C for 10 min; 40 repeated cycles of 92 °C for 15 s and 60 °C for 1 min). The reaction mixture for each sample was prepared in triplicate. All the PCRs were repeated twice to confirm the reliability of the results. Amplification was carried out using a 7500 Real Time PCR System (Applied Biosystems, Life Technologies) that provided a cycle by cycle measurement of the fluorescence emission from each reaction during the 60 °C annealing/extension step of each cycle. Fluorescence was analysed using 7500 System Sequence Detection (SDS) version 1.2.3 software (Applied Biosystems, Life Technologies) either with automatic calculation or manually set. PCR efficiency was calculated according to Smith et al. (2006) as [(10−1/slope) – 1] × 100.
Finally, to validate the SNP genotyping results, some assays were also sub-cloned using the CloneJET™ PCR Cloning Kit (Fermentas, Thermo Fisher Scientific). The sequencing method was the same as described above for plastid DNA markers. The program Sequence Navigator version 1.0.1 (ABI Prism, Perkin Elmer) was used to compile ‘contiguous sequences of each accession from the electropherograms generated by the automated sequencer. The DNA sequence of each Platanus sample was aligned with ClustalW, as implemented in the BioEdit version 7.0.9.0 software (Hall, 1999). The data matrix was verified against the original chromatogram files to ensure that all base assignments were valid at all possible positions.
RESULTS
Plastid DNA analyses
After a preliminary screening of several plastid DNA markers, we chose the psbA-trnH(GUG) intergenic spacer because it discriminated well among the taxa investigated here. The sequences of the rps16 intron and atpB-rbcL intergenic spacer showed 100 % identity in all samples investigated. In contrast, the trnL(UAA) intron and trnT(UGU)-trnL(UAA) intergenic spacer contained some SNPs but they were not diagnostic for the taxa in this study and were not geographically correlated.
Haplotypes were identified based on the variation of the polymorphic psbA-trnH(GUG) intergenic spacer; the differences were due to SNPs and gaps, as shown in Fig. 4 and Supplementary Data File S4. Because the reverse primer reported in the literature (Tate and Simpson, 2003) failed to produce efficient amplification for some taxa, we designed an internal primer that amplified the area of interest (Table 1).
Fig. 4.

Alignment of partial sequences of the psbA-trnH(GUG) intergenic spacer and haplotypes present in the Platanus taxa.
Five different haplotypes were identified for the psbA-trnH(GUG) intergenic spacer: haplotype A was present in P. mexicana s.s. from Veracruz and Oaxaca (codes M6–M10 and M12–M18), some accessions of P. occidentalis s.s. from Texas (codes O8–O12), P. occidentalis var. palmeri (codes P1–P15) and P. rzedowskii (codes R1–R15); haplotypes B and C were present in P. mexicana s.s. from Hidalgo and Puebla (codes M5 and M11) and Chiapas (codes M1–M4), respectively; haplotype D was present in P. mexicana var. interior (codes I1–I15); and, lastly, haplotype E was present in P. occidentalis s.s. (codes O1–O7). The composition of the haplotypes is reported in Fig. 5 and their geographical distribution is shown in Fig. 1.
Fig. 5.


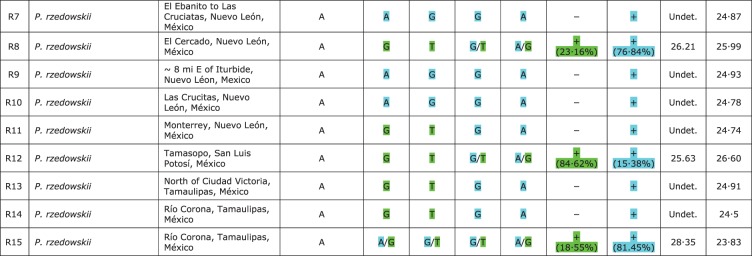
Plastid DNA haplotypes [psbA-trnH(GUG) intergenic spacer] and nrDNA SNP genotypes [LEAFY intron 2 (LFY-i2) and internal transcribed spacer 2 (ITS2)] present in the Platanus taxa using qualitative and quantitative genotyping. The green genotype corresponds to the nucleotides present in specimens of P. mexicana s.s. and the blue genotype corresponds to the nucleotides present in specimens of P. occidentalis s.l. *Maternal tissue of five achenes. **±0·1 s.e.
In the taxa belonging to the PNA-E clade (Pacific North America–Europe area), only haplotype A was identified in five accessions of P. orientalis, three of P. racemosa var. racemosa and four of P. racemosa var. wrightii. In addition, a hybrid accession was also analysed (P. × hispanica Mill. ex Muench, P. orientalis × P. occidentalis s.s.) and haplotype A was detected.
The haplotype network based on the median-joining algorithm showed a clear grouping pattern: haplotype A → haplotype B → haplotype C, with haplotypes D and E independently connected to haplotype A (Fig. 6).
Fig. 6.
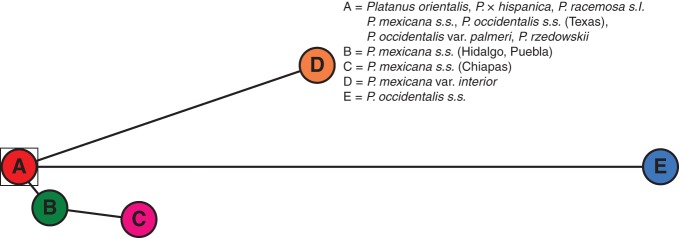
Platanus plastid DNA haplotype network based on the median-joining algorithm.
SNP qualitative and quantitive genotyping
LEAFY intron 2
The two SNPs analysed using qualitative genotyping showed covariance (positions 163 and 298 bp in Supplementary Data File S2). SNaPshot analyses successfully identified the presence of SNPs in 12 of the accessions analysed (Fig. 5): specifically, in three accessions of P. mexicana s.s. (=P. chiapensis, codes M2 and M4; =P. oaxacana, code M8); in eight accessions of P. mexicana var. interior (codes I1–I7, I10 and I15); and in one accession of P. rzedowskii (code R15). The nucleotides from the other accessions presented a taxon-specific genotype (P. mexicana s.s. or P. occidentalis s.l.) (Fig. 5) except for one accession of P. mexicana s.s. from Chiapas (=P. chiapensis, code M1) and for P. rzedowskii where seven accessions showed the P. mexicana s.s. genotype (codes R3, R5, R8 and R11–R14) and the remainder showed the P. occidentalis s.l. genotype (codes R1, R2, R4, R6, R7, R9 and R10.)
ITS
The three SNPs analysed showed covariance. However, a test for DNA secondary structure using the RNAstructure version 5.4 software (Reuter and Mathews, 2010) indicated that these nucleotides are not part of any stem–loop structure.
A qualitative analysis was carried out on two SNPs using SNaPshot probes with ITS2 nrDNA (positions 163 and 298 in Supplementary Data File S3) from each Platanus taxon as a template (Table 2). The specimens analysed were the same as those used for SNP genotyping in LFY-i2 (see above). Except for in some accessions, the results were highly congruent with the LFY-i2 results (see Discussion).
Our SNaPshot analyses successfully identified the presence of an SNP in 12 of the accessions analysed (Fig. 5): in one accession of P. mexicana s.s. (= P. oaxacana, code M8), in three of P. rzedowskii (codes R8, R12 and R15) and in seven of P. mexicana var. interior (codes I2–I6, I10 and I15). The nucleotides from the other taxa had a taxon-specific nucleotide, except for an accession of P. mexicana var. interior (code I7) which had nucleotides corresponding to P. occidentalis s.l.
A quantitative analysis of a single SNP was carried out using TaqMan MGB probes with ITS2 template (position 130 in Supplementary Data File S3 and Fig. 3) from the same data set used in the previous SNaPshot assay (Fig. 5). The real-time PCR efficiencies were similar among specimens, ranging from 94 to 100 %, and the slopes ranged from –3·5 to –3·3 (R2 >0·99). Sample Ct values were between 22·18 and 27·81, and showed good amplification/quantification of the template (Fig. 5).
Our real-time PCR analyses identified the presence of SNPs in the same specimens analysed with the SNaPshot assay for the ITS2, except for an accession of P. mexicana var. interior (code I1) (Fig. 5). The SNP was not detected in this sample by the SNaPshot assay. This is probably due to the higher resolution of real-time PCR which can detect low concentrations of probe (Fig. 5). This also explains the LFY-i2 SNP result in accession I1. The genotype frequency was variable in P. rzedowskii and especially so in P. mexicana var. interior, as shown in Fig. 5. Several individuals of P. mexicana var. interior [notably, samples from the El Llano to San Pedro population (codes I4–I6)] have either comparable amounts of genotypes or show a preponderance of the P. occidentalis s.l. genotype; individuals from Ahuacatlán show a preponderance of the P. mexicana s.s. genotype (codes I1–I3); the population from El Trapiche has two individuals which have the P. mexicana s.s. genotype (codes I8 and I9), one with a comparable amount and one (code I7) which, although identified phenotypically as P. mexicana var. interior, has only the P. occidentalis s.l. genotype. As expected from currently available information, the sequence from the other taxa presented a taxon-specific nucleotide. For example, P. occidentalis s.l. accessions presented a unique fluorescence corresponding to their own nucleotide (i.e. thymine/adenine). As reported above, only one accession of P. mexicana var. interior (code I7) showed a genotype corresponding to that of P. occidentalis s.l.
Finally, some assays used in this study were validated by sub-cloning both ITS2 and LFY-i2. The sub-cloned samples were: one P. mexicana (=P. oaxacana, code M9), one P. mexicana var. interior (code I15), one P. mexicana from Veracruz (code M15), one P. occidentalis var. palmeri (code P1) and two P. rzedowskii PCR products (codes R14–R15). Twelve positive colonies for each amplification were selected for sequencing. Depending on the sample selected, colony sequencing confirmed the presence of a single nucleotide or an SNP.
DISCUSSION
Our results emphasize that hybridization has played a significant role in the evolution of the central American Platanus spp. and demonstrate the advantages of analysing plastid sequences and nuclear DNA SNP genotyping to help resolve several suppositions concerning this taxonomic puzzle. We improved both the usefulness and the accuracy of the real-time PCR allelic assay to better understand the complex systematic position of these taxa. According to our SNP DNA results and published data on ITS and LFY-i2 DNAs (Grimm and Denk 2008, 2010), two types of LFY-i2 and ITS DNA occur in our Platanus taxa. One of these distinguishes all accessions of P. occidentalis s.l. and one distinguishes the taxa belonging to P. mexicana s.s. The 3′ region of LFY-i2 (low-copy nuclear marker) and ITS2 (multicopy nuclear marker) discriminate among taxa because of fixed mutations, permitting adequate differentiation of these Platanus spp. The SNP results were congruent except for a few exceptions (see below for P. rzedowskii and P. chiapensis) as expected from the literature (Feng et al., 2005; Grimm and Denk, 2010).
On the whole, our results confirm the earlier hypotheses of Nixon and Poole (2003), Feng et al. (2005), Grimm and Denk (2008, 2010) and Denk et al. (2012), in which the evidence can be interpreted as being a consequence of hybridization in these central American Platanus spp.
Our plastid analyses ratify the results of Grimm and Denk (2010), who proposed that the lineage relating to the modern PNA-E taxa (P. orientalis and P. racemosa s.l.) forms one source of genetic material in the origins of P. occidentalis s.l. and P. rzedowskii. As shown in the haplotype median-joining network (Fig. 6), great relevance is assigned to haplotype A in the genetic relationships. This haplotype is present in the taxa belonging to the PNA-E clade (P. orientalis and P. racemosa s.l.), in five accessions of P. occidentalis s.s. from Texas, in P. occidentalis var. palmeri, in P. mexicana s.s. and in P. rzedowskii, and appears to be ancestral to haplotype E, present in P. occidentalis s.s. and haplotype D in P. mexicana var. interior. We propose that P. occidentalis var. palmeri and P. mexicana s.s. originate from a common ancestor included in the PNA-E taxa and that, over time, their nuclear markers accumulated several SNPs causing specific genotypes (see the Results and Fig. 5). We have also detected the presence of haplotype A in several accessions of P. occidentalis s.s. in the contact zone with P. occidentalis var. palmeri (Texas). This leads us to suppose that gene flow has occurred, or is occurring, between these taxa. These results confirm those of Nixon and Poole (2003), who showed that a morphological clinal pattern was present, which indicates possible extensive or secondary intergradations between these species. This hypothesis also finds support in Grimm and Denk (2010). Here, the authors used an evolutionary perspective to distinguish between P. occidentalis var. palmeri from northern Mexico and P. occidentalis s.s. from the north-eastern USA. In light of their molecular results, they treated P. occidentalis var. palmeri at species level as P. palmeri and they demonstrated a relatedness of this species to western Eurasian P. orientalis and to the P. racemosa species aggregate, which are considered its ancestral complex.
According to our study, P. occidentalis var. palmeri also appears to be independent of the P. mexicana s.l. lineage, with the P. mexicana complex presenting both distinctive morphological characteristics and also unique ITS and LFY-i2 DNA. Analysing the haplotype pattern, we observe that three different haplotypes have developed from P. mexicana s.s. (haplotype A): one is exclusive for P. mexicana var. interior (haplotype D) and the other two (B and C) are evolutionarily connected. Haplotype B was present in one accession from Puebla and Hidalgo; haplotype C was found in four specimens of P. mexicana s.s. from Chiapas (= P. chiapensis). Nixon and Poole (2003) were cautious in the taxonomic arrangement of this taxon and synonymized P. chiapensis with P. mexicana s.s., although they observed that some morphological trends in Chiapas specimens were apparent from Veracruz and nearby areas: more acute leaf lobes, a whiter leaf vestiture and more leathery leaves than in P. mexicana s.s.
According to SNP data from LFY-i2 and ITS2, our accessions from Chiapas are to some degree anomalous. This is also deduced by Feng et al. (2005) who admitted that P. mexicana s.s. from Chiapas (= P. chiapensis) could be phylogentically distinct from P. mexicana s.s. on the basis only of LFY-i2 results. Our data partly confirm this conclusion, demonstrating overlap with the P. mexicana s.s. genotype (Fig. 5). Feng et al. (2005) analysed only two specimens and with direct sequencing of PCR templates, whereas in our study highly informative molecular approaches have been applied to this taxon. However, we agree with Feng et al. (2005), admitting that P. mexicana from Chiapas presents a particular evolutionary history probably caused by a vicariance event during the late Miocene because of the tectonic deformation of the Isthmus of Tehuantepec. These geological phenomena formed a barrier between the Gulf of Mexico and the Pacific Ocean (Barrier et al., 1998; Suárez, 2000) which probably influenced gene flow among accessions of P. mexicana s.s. (Chiapas and Veracruz-Oaxaca) determining the particular molecular genotypes (plastid and nrDNA) observed in P. mexicana from Chiapas. These distinctions create the opportunity for an exhaustive study both to determine whether P. chiapensis should be reclassified and to better understand its haplotype relationships with accessions from Puebla and Hidalgo. However, this would require extensive sampling because, if P. chiapensis were indeed to be a distinct species, it would be the first taxon to occur sympatrically with another species.
The ranges of P. mexicana s.s. and P. occidentalis s.l. are currently separated by about 700 km and this area is occupied mainly by P. rzedowskii, a species first described by Nixon and Poole (2003), and, according to recent molecular data, characterized by a complex evolutionary history (Grimm and Denk, 2008, 2010). Our plastid results indicate that the P. rzedowskii accessions have the same haplotype (A) found in P. occidentalis var. palmeri, in some accessions of P. occidentalis s.s. from Texas (contact zone with P. occidentalis var. palmeri) and in some P. mexicana s.s. (Figs 1 and 5). According to SNP data, P. rzedowskii may be the product of hybridization between P. occidentalis var. palmeri (or an ancestral taxon) and P. mexicana s.l. The SNP genotyping results of LFY-i2 DNA in P. rzedowskii were mostly congruent with those of ITS2 except for some accessions (see Fig. 5). In the ITS phylogenetic tree (Feng et al., 2005), P. rzedowskii grouped with P. occidentalis s.l., but with LFY-i2 it was placed in both P. mexicana s.l. and P. occidentalis s.l. This conflict between the ITS2 and LFY-i2 SNP results can be explained by the different evolution of these molecular markers and also by the presence of hybridization and introgression among these Platanus taxa. Other authors (Grimm and Denk, 2010) have previously suggested that P. rzedowskii may have been the product of recent hybridization between P. occidentalis var. palmeri (or an ancestral taxon) and P. mexicana s.l. In contrast, on morphological grounds, Nixon and Poole (2003) concluded that it is a distinctive species, with no complete sympatry and no intermediates with P. occidentalis var. palmeri.
Notably, other Platanus taxa have shown the presence of both genotypes (Fig. 5): some accessions of P. mexicana var. interior and one of P. oaxacana (= P. mexicana var. mexicana). In the case of P. mexicana var. interior, it is important to note that the presence of both genotypes is not constant; in fact <50 % of specimens are pure P. mexicana s.s. in terms of their genotypes (Fig. 5). These results can be explained by admitting that P. mexicana var. interior is affected by lateral gene flow (introgression) from P. rzedowskii and/or P. occidentalis var. palmeri. According to Nixon and Poole (2003), the leaves, capitula, habitat and range of P. mexicana var. interior could indicate past contact with and introgression from only P. occidentalis var. palmeri. Finally, in a recent article, Denk et al. (2012) proposed that var. interior should be discarded if new genetic data confirm the hybrid (or introgressive) nature of this taxon.
As far as molecular data in Platanus are concerned, our results indicate that P. rzedowskii has neither a distinctive plastid DNA haplotype nor a specific ITS/LFY-i2 genotype, and that P. mexicana var. interior, albeit having a characteristic haplotype, does not show any specific ITS/LFY-i2 genotype. Both taxa show individuals of mixed ITS/LFY-i2 ancestry, more abundant in P. mexicana var. interior. Indeed, P. rzedowskii and P. mexicana var. interior as a whole seem to represent an almost complete series of introgressants. From the above, it is reasonable to admit that hybridization and successive introgression have been key evolutionary factors in the origins of both P. rzedowskii and P. mexicana var. interior.
In this regard, the qualitative and quantitative heterozygous patterns obtained for the accessions of P. mexicana s.s. from Oaxaca (= P. oaxacana) are also interesting (Fig. 5). Additional information on the P. oaxacana specimen is necessary. This unique specimen of this taxon is the holotype deposited in the Smithsonian Institution, Department of Botany (USA) (Fig. 2). According to Nixon and Poole (2003, p. 126), this sample is unique from a morphological point of view. These authors defined it as an ‘ … aberrant specimen in terms of the degree of toothing of the leaves but otherwise is consistent with P. mexicana var. mexicana in all important diagnostic characters.’ However, because it is a single sample from the type location, the authors considered it as a synonym of P. mexicana s.s. Standley (1919) pointed out the evident relationships of P. oaxacana with P. mexicana from Veracruz (= P. lindeniana Mart. & Gal.), but at the same time admitted that in that species, the leaves were narrower, rounded and decurrent at the base, with a loose whitish tomentum, and the long, narrow lobes were commonly entire (Fig. 2).
For this reason, in September of 2009, we undertook a botanical expedition to sample P. oaxacana specimens, but no samples were found as a result of the strong anthropogenic impact in the area (deforestation), which has compromised the habitat of this taxon. Therefore, the authors obtained permission to analyse some fruits of the holotype to understand its relationship with the other Platanus taxa. According to our molecular data, this specimen can be seen as another example of hybridization, for which the parental contributors could be primarily P. mexicana s.l. (as shown by the frequencies reported in Fig. 5 and by morphology), but also P. rzedowskii or even other northern Mexican Platanus spp. In this case, the possible hybrid nature of P. oaxacana (which may be extinct) might have important biogeographic implications, suggesting that, in the past, the P. oaxacana population(s) was (were) connected to those of northern Platanus. Unfortunately, these speculations cannot form the basis of a hypothesis without additional data and/or specimens of P. oaxacana.
Based on our molecular analyses, the only assumption that we can make with confidence is that hybridization and/or introgression occurred or continues to occur in Mexican Platanus and this is why some specimens present both genotypes. We cannot exclude P. occidentalis s.s. from this gene exchange, because, even though it is distributed over a wide geographical area and has distinctive morphological characteristics (Nixon and Poole, 2003), it has both a shared plastid DNA haplotype (A, some accessions from Texas) and one exclusive haplotype (E) (Figs 1 and 5).
Dating these events is quite difficult. The upper time limit, according to Feng et al. (2005), is mid- to late Miocene (16·4–5·32 Mya), which is the estimated divergence time between P. mexicana s.s. and P. occidentalis s.s., and the lower time limit could be the late Pleistocene (0·025–0·012 Mya), where the possible restriction of forests could have played a fundamental role in Platanus speciation (van der Hammen, 1974; Whitemore and Prance, 1987). The Pleistocene climate fluctuations may have resulted in greater closeness or a partial overlap of the ranges of P. occidentalis s.l., P. rzedowski and P. mexicana s.l., which, due to their moist habitat preferences, may have been confined to lowland refugia during the Pleistocene glacial maximum. Palynological studies have shown that the distribution of tropical forest was affected by climate change in the late Pleistocene and many species were restricted to refugia near the Equator where changes in rainfall and temperature were not as extreme (e.g. in riparian forests) (Haffer, 1969; van der Hammen, 1974; Prance, 1982; Bush et al., 1992; Aide and Rivera, 1998). At present the Platanus spp. tend to be distributed in allopatric populations separated by xeric expanses (Nixon and Poole, 2003) and, therefore, present-day gene flow is unlikely.
Finally, the use of real-time PCR assays allowed the generation of results that contribute usefully to our understanding of the history of Mexican Platanus. The speed with which useful results can be obtained is greater than with other methods. Using the two PCRs (end-point and quantitative), we obtained results comparable with and more accurate than those of Grimm and Denk (2010), who used the time-consuming technique of sub-cloning and sequencing of the PCR products. Our approach may indeed be useful for mapping potential hybridization zones between eastern North American and Mesoamerican Platanus. The technique has some difficulties (e.g. suitable probes and primers must be designed), but real-time PCR is a sophisticated method which has potential in a wide variety of applications in plant research due to its sensitivity, specificity and quantitative output. In our experience, real-time PCR has become an almost routine tool and, due to its proven reliability, applications based on it will probably increase in number.
SUPPLEMENTARY DATA
ACKNOWLEDGEMENTS
We thank Katherine Rankin (former Supervisory Museum Specialist, US National Herbarium) for her help, and Guido Grimm and Thomas Denk (Departement of Palaeobotany, Swedish Museum of Natural History, Sweden) who provided specimens and made very helpful suggestions. The authors are also grateful to Luca Paino (Department of Biology, University of Naples Federico II, Italy) for the sequencing service.
‘Whoever has, at least once, observed the beauty of nature with his own eyes is not destined for death but for nature itself … ’ Konrad Lorenz.
In memory of Dr Gioacchino Vallariello.
LITERATURE CITED
- Aceto S, Caputo P, Cozzolino S, Gaudio L, Moretti A. Phylogeny and evolution of Orchis and allied genera based on ITS DNA variation: morphological gaps and molecular continuity. Molecular Phylogenetics and Evolution. 1999;13:67–76. doi: 10.1006/mpev.1999.0628. [DOI] [PubMed] [Google Scholar]
- Aide TM, Rivera E. Geographic patterns of genetic diversity in Poulsenia armata (Moraceae): implications for the theory of Pleistocene refugia and the importance of riparian forest. Journal of Biogeography. 1998;25:695–705. [Google Scholar]
- Baerwald MR, Schumer G, Schreier BM, May B. TaqMan assays for the genetic identification of delta smelt (Hypomesus transpacificus) and wakasagi smelt (Hypomesus nipponensis) Molecular Ecology Resources. 2011;11:784–785. doi: 10.1111/j.1755-0998.2011.03011.x. [DOI] [PubMed] [Google Scholar]
- Bandelt H-J, Forster P, Röhl A. Median-joining networks for inferring intraspecific phylogenies. Molecular Biology and Evolution. 1999;16:37–48. doi: 10.1093/oxfordjournals.molbev.a026036. [DOI] [PubMed] [Google Scholar]
- Barrier E, Velasquillo L, Chavez M, Gaulon R. Neotectonic evolution of the Isthmus of Tehuantepec (south-eastern Mexico) Tectonophysics. 1998;287:77–96. [Google Scholar]
- Bush MB, Piperno DR, Colinvaux PA, et al. Paleological profile of a lowland tropical lake in Panama. Ecological Monographs. 1992;62:251–275. [Google Scholar]
- Chen RY, Song WQ, Li XL, Li MX, Liang GL, Chen CB. Chromosome atlas of major economic plants genome in China. Vol. 3. Beijing: Science Press; 2003. Chromosome atlas of garden flowering plants in China. [Google Scholar]
- Corriveau JL, Coleman AW. Rapid screening method to detect potential biparental inheritance of plastid DNA and results for over 200 species. American Journal of Botany. 1988;75:1443–1458. [Google Scholar]
- Crane PR, Pedersen KR, Friis EM, Drinnan AN. Early Cretaceous (early to middle Albian) platanoid inflorescences associated with Sapindopsis leaves from the Potomac Group of eastern North America. Systematic Botany. 1993;18:328–342. [Google Scholar]
- Culumber ZW, Fisher HS, Tobler M, et al. Replicated hybrid zones of Xiphophorus swordtails along an elevational gradient. Molecular Ecology. 2011;20:342–356. doi: 10.1111/j.1365-294X.2010.04949.x. [DOI] [PubMed] [Google Scholar]
- Denk T, Grimm G, Roseler A-K. When field botany meets history: taxonomy of Platanus mexicana in Mexico. Willdenowia. 2012;42:99–115. [Google Scholar]
- Di Maio A, De Castro O. SSR-patchwork: an optimized protocol to obtain a rapid and inexpensive SSR library using first-generation sequencing technology. Applications in Plant Sciences. 2013;1:1200158. doi: 10.3732/apps.1200158. [DOI] [PMC free article] [PubMed] [Google Scholar]
- Doyle JJ, Doyle JL. A rapid DNA isolation procedure for small quantities of fresh leaf tissue. Phytochemical Bulletin, Botanical Society of America. 1987;19:11–15. [Google Scholar]
- Ernst WR. The genera of Hamamelidaceae and Platanaceae in the southeastern United States. Journal of the Arnold Arboretum. 1963;44:193–210. [Google Scholar]
- Feliner GN, Rosselló JA. Better the devil you know? Guidelines for insightful utilization of nrDNA ITS in species-level evolutionary studies in plants. Molecular Phylogenetics and Evolution. 2007;44:911–919. doi: 10.1016/j.ympev.2007.01.013. [DOI] [PubMed] [Google Scholar]
- Feng Y, Oh S-H, Manos PS. Phylogeny and historical biogeography of the genus Platanus as inferred from nuclear and chloroplast DNA. Systematic Botany. 2005;30:786–799. [Google Scholar]
- Friis EM, Crane PR. Reproductive structures of Cretaceous Hamamelidae. In: Crane PR, Blackmore S, editors. Evolution, systematics, and fossil history of the Hamamelidae. Introduction and ‘lower’ Hamamelidae. Oxford: Clarendon Press, Oxford University Press; 1989. pp. 155–174. vol. 1. The Systematics Association Special Volume No. 40A. [Google Scholar]
- Grimm GW, Denk T. ITS evolution in Platanus: homoeologues, pseudogenes, and ancient hybridization. Annals of Botany. 2008;101:403–419. doi: 10.1093/aob/mcm305. [DOI] [PMC free article] [PubMed] [Google Scholar]
- Grimm GW, Denk T. The reticulate origin of modern plane trees (Platanus, Platanaceae): a nuclear marker puzzle. Taxon. 2010;59:134–147. [Google Scholar]
- Haffer J. Speciation in Amazonia forest birds. Science. 1969;165:131–137. doi: 10.1126/science.165.3889.131. [DOI] [PubMed] [Google Scholar]
- Hall TA. BioEdit: a user-friendly biological sequence alignment editor and analysis program for Windows 95/98/NT. Nucleic Acids Symposium Series. 1999;41:95–98. [Google Scholar]
- Hansen H, Escobar LK, Gilbert LE, Jansen RK. Paternal, maternal, and biparental inheritance of the chloroplast genome in Passiflora (Passifloraceae): implications for phylogenetic studies. American Journal of Botany. 2007;94:42–46. doi: 10.3732/ajb.94.1.42. [DOI] [PubMed] [Google Scholar]
- Hanson L, McMahon KA, Johnson MAT, Bennett MD. First nuclear DNA C-values for another 25 angiosperm families. Annals of Botany. 2001;88:851–858. doi: 10.1006/anbo.2000.1325. [DOI] [PubMed] [Google Scholar]
- Harwood AS, Phillips RB. A suite of twelve single nucleotide polymorphism markers for detecting introgression between cutthroat and rainbow trout. Molecular Ecology Resources. 2011;11:382–385. doi: 10.1111/j.1755-0998.2010.02930.x. [DOI] [PubMed] [Google Scholar]
- Ivanova D. Mediterranean chromosome number reports 15 (1445–1456) Flora Mediterranea. 2005;15:719–728. [Google Scholar]
- Kvaček Z, Manchester SR, Guo Z-H. Trifoliolate leaves of Platanus bella (Heer) comb. n. from the Palaeocene of North America, Greenland, and Asia and their relationships among extinct and extant Platanaceae. International Journal of Plant Sciences. 2001;162:441–458. [Google Scholar]
- Manen JF, Natali A, Ehrendorfer F. Phylogeny of the Rubiaceae-Rubieae inferred from the sequence of a cpDNA intergene region. Plant Systematics and Evolution. 1994;190:195–211. [Google Scholar]
- Maslova NP. Extinct and extant Platanaceae and Hamamelidaceae: morphology, systematics, and phylogeny. Paleontological Journal. 2003;37:S467–S590. [Google Scholar]
- Matejusová I, Bland F, Hall AJ, et al. Real-time PCR assays for the identification of harbor and gray seal species and sex: a molecular tool for ecology and management. Marine Mammal Science. 2012;29:186–194. [Google Scholar]
- Morawetz W, Samuel MRA. Karyological patterns in the Hamamelidae. In: Crane PR, Blackmore S, editors. Evolution, systematics, and fossil history of the Hamamelidae. Introduction and ‘lower’ Hamamelidae. Vol. 1. Oxford: Clarendon Press, Oxford University Press; 1989. pp. 129–154. [Google Scholar]
- Nixon KC, Poole JM. Revision of the Mexican and Guatemalan species of Platanus (Platanaceae) Lundellia. 2003;6:103–137. [Google Scholar]
- Oginuma K, Tobe H. Karyomorphology and evolution in some Hamamelidaceae and Platanaceae (Hamamelididae; Hamamelidales) Botanical Magazine. 1991;104:115–135. [Google Scholar]
- Oxelman B, Lidén M, Berglund D. Chloroplast rps16 intron phylogeny of the tribe Sileneae (Caryophyllaceae) Plant Systematics and Evolution. 1997;206:393–410. [Google Scholar]
- Prance G. Biological diversification in the tropics. New York: Plenum Press; 1982. [Google Scholar]
- Reuter JS, Mathews DH. RNAstructure: software for RNA secondary structure prediction and analysis. BMC Bioinformatics. 2010;11:129. doi: 10.1186/1471-2105-11-129. [DOI] [PMC free article] [PubMed] [Google Scholar]
- Sang T, Crawford DJ, Stuessy TF. Chloroplast DNA phylogeny, reticulate evolution, and biogeography of Paeonia (Paeoniaceae) American Journal of Botany. 1997;84:1120–1136. [PubMed] [Google Scholar]
- Smith CJ, Nedwell DB, Dong LF, Osborn AM. Evaluation of quantitative polymerase chain reaction-based approaches for determining gene copy and gene transcript numbers in environmental samples. Environmental Microbiology. 2006;8:804–815. doi: 10.1111/j.1462-2920.2005.00963.x. [DOI] [PubMed] [Google Scholar]
- Standley PC. Tropical American phanerogams, no. 3. Contributions from the United States National Herbarium. 1919;20:173–220. [Google Scholar]
- Suárez G. Reverse faulting in the Isthmus of Tehuantepec: backarc deformation induced by the subduction of the Tehuantepec ridge. In: Delgado-Granados H, Aguirre-Díaz G, Stock JM, editors. Cenozoic tectonics and volcanism of Mexico. Vol. 334. Boulder, CO: Geological Society of America Special Paper; 2000. pp. 263–268. [Google Scholar]
- Taberlet P, Gielly L, Pautou G, Bouvet J. Universal primers for amplification of three non-coding regions of chloroplast DNA. Plant Molecular Biology. 1991;17:1105–1109. doi: 10.1007/BF00037152. [DOI] [PubMed] [Google Scholar]
- Tate JA, Simpson BB. Paraphyly of Tarasa (Malvaceae) and diverse origins of the polyploid species. Systematic Botany. 2003;28:723–737. [Google Scholar]
- Van der Hammen T. The Pleistocene change of vegetation and climate in tropical south America. Journal of Biogeography. 1974;1:3–26. [Google Scholar]
- Van Guilder HD, Vrana KE, Freeman WM. Twenty-five years of quantitative PCR for gene expression analysis. BioTechniques. 2008;44:619–626. doi: 10.2144/000112776. [DOI] [PubMed] [Google Scholar]
- Werth S, Cornejo C, Scheidegger C. A species-specific real-time PCR assay for identification of three lichen-forming fungi, Lobaria pulmonaria, Lobaria immixta and Lobaria macaronesica. Molecular Ecology Resources. 2010;10:401–403. doi: 10.1111/j.1755-0998.2009.02760.x. [DOI] [PubMed] [Google Scholar]
- Whitemore TC, Prance GT. Biogeography and Quaternary history in tropical America. Oxford: Clarendon Press; 1987. [Google Scholar]
- Zemskova EA. O kariotipe Platanus kerrii (Platanaceae) [On the karyotype of Platanus kerrii (Platanaceae) Botanicheskii Zhurnal. 1993;78:15–17. [Google Scholar]
Associated Data
This section collects any data citations, data availability statements, or supplementary materials included in this article.