

Abstract
L-type calcium channels (CaV1) are involved in diverse processes, such as neurotransmission, hormone secretion, muscle contraction, and gene expression. In this study, we uncover a role for CaV1.3a in regulating the architecture of a cellular structure, the ribbon synapse, in developing zebrafish sensory hair cells. By combining in vivo calcium imaging with confocal and super-resolution structured illumination microscopy, we found that genetic disruption or acute block of CaV1.3a channels led to enlargement of synaptic ribbons in hair cells. Conversely, activating channels reduced both synaptic-ribbon size and the number of intact synapses. Along with enlarged presynaptic ribbons in caV1.3a mutants, we observed a profound loss of juxtaposition between presynaptic and postsynaptic components. These synaptic defects are not attributable to loss of neurotransmission, because vglut3 mutants lacking neurotransmitter release develop relatively normal hair-cell synapses. Moreover, regulation of synaptic-ribbon size by Ca2+ influx may be used by other cell types, because we observed similar pharmacological effects on pinealocyte synaptic ribbons. Our results indicate that Ca2+ influx through CaV1.3 fine tunes synaptic ribbon size during hair-cell maturation and that CaV1.3 is required for synaptic maintenance.
Introduction
To effectively convey auditory or vestibular information, sensory hair cells must reliably transmit stimulus timing and intensity to the CNS. This task is accomplished by electron-dense presynaptic specializations called synaptic ribbons. Synaptic ribbons tether glutamate-filled vesicles and are thought to coordinate the release of these vesicles, as well as facilitate vesicle priming and replenishment (Glowatzki and Fuchs, 2002; Lenzi et al., 2002; Li et al., 2009; Schmitz, 2009; Frank et al., 2010; Snellman et al., 2011). In addition, the synaptic ribbon stabilizes a large readily-releasable pool—vesicles docked at the plasma membrane—at the synaptic active zone (Khimich et al., 2005; Buran et al., 2010). Recent studies support the hypothesis that variations in the size of synaptic ribbons contribute to differences in the postsynaptic responses of cochlear-nerve fibers that innervate hair cells (Frank et al., 2009; Meyer et al., 2009; Grant et al., 2010; Liberman et al., 2011), yet a cellular mechanism for regulating the size of hair-cell ribbons has not been defined.
A major structural component of synaptic ribbons is the protein Ribeye (Schmitz et al., 2000). Several studies have revealed that Ribeye is, in all likelihood, the main component driving the assembly of ribbon synapses. Ribeye has been shown to self-associate via multiple interaction sites and is capable of forming synaptic-ribbon-type aggregates when heterologously expressed in retinal precursor cells (Magupalli et al., 2008). Additionally, studies in zebrafish showed that knockdown of ribeye expression results in smaller or absent synaptic ribbons (Wan et al., 2005; Sheets et al., 2011), whereas exogenous overexpression of Ribeye creates larger synaptic ribbons (Sheets et al., 2011). These data support a modular assembly model by which self-association of Ribeye generates the presynaptic ribbon.
In addition to Ribeye, another key component of ribbon synapses is the L-type calcium channel CaV1.3 (Brandt et al., 2003; Dou et al., 2004; Sidi et al., 2004). Ca2+ influx through CaV1.3 is responsible for triggering exocytosis in hair-cell ribbon synapses (Platzer et al., 2000; Sidi et al., 2004; Brandt et al., 2005). CaV1.3 also contributes to hair-cell maturation (Brandt et al., 2003); inner hair cells from CaV1.3−/− mice lack the large-conductance Ca2+-activated K+ channels normally found in mature hair cells and show persistent cholinergic innervation that is normally lost at the onset of hearing (Nemzou N et al., 2006). Although hair-cell maturation is affected in CaV1.3−/− mutants, a role for CaV1.3 in ribbon-synapse development has not been described.
Here we characterized the morphology of ribbon synapses in zebrafish hair cells wherein CaV1.3 function has been genetically disrupted. We then examined the effects of acutely blocking or activating L-type calcium channels on synaptic ribbon structure. Our results indicate that Ca2+ influx through CaV1.3 regulates the size of synaptic ribbons during development and that CaV1.3 is necessary for refinement and maintenance of hair-cell synapses.
Materials and Methods
Zebrafish husbandry and fish strains.
Adult zebrafish strains were maintained as described previously (Westerfield, 1993). Mutant alleles used in this study include cav1.3aR1250X (tc323d allele), cav1.3aR284C (tn004 allele), and vglut3484 + 2T>2 and have been described previously (Sidi et al., 2004; Obholzer et al., 2008; Trapani and Nicolson, 2011). cav1.3a and vglut3 mutant alleles were maintained in Tübingen wild-type (WT) background. Pharmacological experiments were performed using Tübingen and WIK/Top Long Fin WT zebrafish larvae. Both sexes were examined in our experiments.
Hair-bundle stimulation and Ca2+ imaging.
Ca2+ imaging was performed as described previously (Kindt et al., 2012). Briefly, larvae were anesthetized with 0.03% 3-amino benzoic acid ethylester (Western Chemical) and pinned to a Sylgard-filled chamber. Larvae were injected with 125 μm α-bungarotoxin into the heart to suppress movement. Before imaging, larvae were rinsed with extracellular solution (140 mm NaCl, 2 mm KCl, 2 mm CaCl2, 1 mm MgCl2, and 10 mm HEPES, pH 7.3, 310 Osm). For pharmacological experiments, larvae were exposed to drug for 15 min before imaging and remained in drug for the duration of the experiment. After washout of isradipine, we find there is partial recovery after 30 min.
A fluid-jet composed of a pressure-clamp HSPC-1 (ALA Scientific) attached to a glass micropipette with a tip diameter of 40–50 μm, positioned 100 μm from a neuromast (NM) was used to deflect hair bundles. A 10 Hz square wave directed and alternated along the anterior–posterior axis with a 2 s duration was used to stimulate hair cells. This stimulates all hair cells in the NM whether their hair bundles are orientated to respond to an anterior or posterior stimulus. Deflections were confirmed visually. A 25 mmHg fluid-jet stimulus was used to deflect hair bundles by ∼5–10° along the excitatory axis.
Optical measurements were made using a Carl Zeiss Axioexaminer with a 63×, 1.0 numerical aperture Plan-Apochromat Carl Zeiss water-immersion objective. The microscope was equipped with a Dual View beam splitter (Optical Insights) using the following filter/dichroic pairs: excitation, 420/40; excitation dichroic, 455; CFP emission, 480/30; emission dichroic, 505; YFP emission, 535/30 (Chroma Technology). A shutter (Sutter Instruments) and an Orca ER CCD camera (Hamamatsu) were used to acquire fluorescence images with MetaMorph software (Molecular Devices).
CFP and YFP cannot be completely separated by filters. For cameleon, the YFP channel also picks up fluorescence from CFP. Using a CFP-expressing sample, we computed the bleed-through ratio (RCFP) by imaging CFP alone. Here RCFP = YCFP/CCFP (Y and C refer to the intensities measured in the YFP and CFP channels). Because the apparent ratio of a cameleon-expressing cell Rapp = (YYFP + YCFP)/CCFP, the actual corrected YFP/CFP ratio = Rapp − RCFP. Accordingly, spectral bleed-through was corrected with the use of an RCFP value of 0.76. By using appropriate neutral density filters, photobleaching was relatively nonexistent; for our experiments, the photobleaching that occurred was <10%. Scatter plots of Ca2+ responses represent the average response per NM. To determine the average NM response, the response of each hair cell in an NM was measured, and these individual responses were averaged. Traces of Ca2+ responses represent the average response of all hair cells in four NMs.
Pharmacological manipulation of larvae.
Zebrafish larvae were exposed to isradipine or S-(−)Bay K8644 (Sigma-Aldrich) diluted in Embryo Medium (E3) with 0.1% dimethylsulfoxide (DMSO) for 15 min, 30 min, 1 h, or 12 h. E3 alone or E3 with 0.1% DMSO were used as controls. Both drugs had a profound effect on swimming behavior; drug-treated larvae exhibited circling behavior indicative of a balance defect within minutes of drug application. After drug exposure, larvae were quickly sedated on ice and then transferred to fixative.
Antibodies.
We used previously described custom-generated antibodies against Ribeye a, Ribeye b, and CaV1.3a Danio rerio peptide sequences (Sheets et al., 2011), as well as K28/86 purified antibody (NeuroMab) to label membrane-associated guanylate kinase (MAGUK).
Immunohistochemistry.
Zebrafish larvae were fixed with 4% paraformaldehyde/4% sucrose in phosphate buffer with 0.2 mm CaCl2 for 3.5 h [3 d postfertilization (dpf)] or 4.5 h (5 dpf) at 4°C. After rinse, larvae were permeabilized with ice-cold acetone and blocked with PBS buffer containing 2% goat serum, 1% bovine serum albumin (BSA), and 1% DMSO. Larvae were then incubated with primary antibodies diluted in PBS buffer containing 1% BSA and 1% DMSO overnight, followed by diluted secondary antibodies coupled to Alexa Fluor 488, Alexa Fluor 647 (Invitrogen), or DyLight 549 (Jackson ImmunoResearch) and labeled with DAPI (Invitrogen). Larvae used for super-resolution structured illumination microscopy (SR-SIM) were postfixed after exposure to secondary antibodies and mounted with ProLong Gold Antifade Reagent (Invitrogen).
Confocal imaging.
Confocal images were obtained as described previously (Sheets et al., 2011). For each experiment, the microscope parameters were adjusted using the brightest control specimen so that, in a 12-bit image, the darkest pixels had a brightness value of ∼0 and the brightest pixels had a brightness value of 4095. Care was taken to set the acquisition parameters with just a few pixels in the control specimens reaching saturation to achieve the greatest dynamic range in our experiments.
SR-SIM imaging.
Z-stack images of whole NMs (spaced by 0.3 μm over 5–10 μm) were obtained with a 60×/1.4 numerical aperture PlanApo objective using an Elyra PS.1 Microscope (Carl Zeiss) with an Andor iXON EMCCD camera. The microscope parameters were adjusted for each individual specimen, and care was taken to minimize pixel saturation. SR-SIM images were produced using ZEN 2010D software. The following full-width at half-maximum (FWHM) values were obtained from maximal projection SIM images of 0.1 μm TetraSpeck Microspheres in approximately the same position of our samples: 488 (green channel) FWHM = 0.14 μm, 647 (far red channel) FWHM = 0.18 μm.
Image processing.
Digital images were processed using MetaMorph (Molecular Devices) and NIH ImageJ software. Quantitative-image analysis was performed on raw images using MetaMorph. Subsequent image processing for display within figures was performed using Photoshop and Illustrator software (Adobe Systems).
Image analyses.
Maximal projections of Z-stack confocal images were created and analyzed using MetaMorph software. Images containing MAGUK or Cav1.3a immunolabel were corrected for background; in each image, a 7 μm2 region containing the highest level of background was selected, and the average-fluorescence intensity of that region was subtracted from the image.
To quantitatively measure immunolabel, individual NMs were delineated using the region tool, and an inclusive threshold (a binary mask applied to the grayscale values being measured) was applied to isolate pixels occupied by immunolabeled puncta within the NM. The Integrated Morphometry Analysis function was then used to measure the number of puncta, the area occupied by fluorescent pixels, and the total intensity of fluorescent pixels (sum of the grayscale values) within each individual punctum. A punctum was defined as a region containing pixels at least threefold (Ribeye) or fivefold (MAGUK and CaV1.3a; after background subtraction) above the average intensity measured in the whole NM. Presynaptic Ribeye puncta were identified as such by juxtaposing MAGUK immunolabel. In the case of 5 dpf cav1.3a mutants, in which basally localized Ribeye puncta were frequently not tightly juxtaposed to MAGUK, a size criteria defined in WT larvae (≥0.2 μm2) was applied.
To quantify changes in fluorescence of Ribeye immunolabel in pinealocytes, the pineal organ was delineated using the region tool, and an inclusive threshold was applied to isolate synaptic-ribbon-type structures. The average intensity of Ribeye a immunolabel within those structures was measured for each pineal organ.
To measure apparent overlap of Ribeye and MAGUK in confocal images of individual NMs, a region containing the NM was delineated within two separate images of Ribeye and MAGUK. Puncta-containing pixels were isolated in each image with an inclusive threshold mask using the criteria described above. The percentage of pixels containing MAGUK-labeled fluorescent puncta that overlapped with pixels containing Ribeye-labeled fluorescent puncta was then measured using the Measure Colocalization module in MetaMorph.
In SR-SIM images, the number of synaptic ribbons per MAGUK-labeled postsynaptic densities (PSDs) was counted manually. A single PSD was defined as MAGUK immunolabel containing pixels isolated with an inclusive threshold that appeared as a continuous object. Many of the PSDs in cav1.3a mutant NMs appeared as compound objects; that is, single objects containing holes. The area of each synaptic ribbon was measured as described above, and the degree of roundness of each synaptic ribbon was determined using a shape factor routine [(shape factor = 4A/p2), which is calculated from the area (A) and the perimeter (p) of the object (ribbon)].
Statistical analyses.
Statistical analysis was performed using Prism 5 (GraphPad Software). Immunolabeled puncta intensities, synaptic ribbon area, and the shape factor of synaptic ribbons did not follow Gaussian distributions. Therefore, a Mann–Whitney rank test or Kruskal-Wallis ANOVA with the appropriate post hoc test was used to compare differences between populations. The Wilcoxon's signed-rank test was used to compare differences in relative expression levels of ribeye b. An unpaired Student's t test or one-way ANOVA with the appropriate post hoc test was used an all other analysis.
Reverse transcription-PCR and quantitative PCR.
Groups of 30 larvae at 3 dpf were exposed to 0.1% DMSO alone or with pharmacological agent for 1 h and then anesthetized on ice. Larval tissue was immediately placed into RNAlater (Applied Biosystems/Ambion), and total RNA was extracted using the RNAqueous 4-PCR kit (Applied Biosystems/Ambion). Reverse transcription (RT)-PCR was performed the using 5 μg of total RNA and the Sprint RT Complete Oligo(dT) kit (Clontech). For quantitative PCR (qPCR), 0.2 μl of cDNA in SsoFast Supermix (Bio-Rad) with appropriate primers was used for each qPCR reaction, and the reactions were run in 96-well plates using a Bio-Rad CFX96 Real-Time System. The RNA level for ribeye b was first calculated from a cDNA standard curve and then normalized to β-actin RNA. Primers used for ribeye b transcript are as follows: forward, 5′-AGTTGATGCGCAAAGGAG-3′; and reverse, 5′-ATGGTGGACACGATGACTG-3′.
Results
Characterization of CaV1.3a localization and Ca2+ influx in cav1.3a mutant hair cells
In a previous study, we reported a critical role for Ribeye in localizing CaV1.3a to ribbon synapses in zebrafish hair cells (Sheets et al., 2011). We subsequently sought to address how loss of CaV1.3a channel function might affect ribbon synapse development. For this study, we examined larvae homozygous for either of two allelic mutations in the pore-forming α subunit of cav1.3a (Sidi et al., 2004; Fig. 1A): cav1.3aR1250X, which introduces a stop codon eliminating part of the last transmembrane domain, as well as the C-terminal tail, and cav1.3a R284C, which substitutes an Arg for a Cys residue in the IS5–IS6 linker region, a region critical for channel conductance (Dirksen et al., 1997). To determine whether these mutations similarly impair channel function, we examined Ca2+ transients in larvae carrying either alleles of cav1.3a. For our analysis, we used a transgenic line that expresses cameleon, a genetically encoded fluorescence resonance energy transfer-based Ca2+ indicator expressed specifically in hair cells (Kindt et al., 2012). In response to mechanical deflection of hair bundles, we observed robust increases in the YFP/CFP ratio in the cytoplasm of WT NM hair cells, indicative of a rise in intracellular Ca2+ (Fig. 1B,C; 86.5%. n = 15 NMs). In this preparation, Ca2+ responses represent the sum of all Ca2+ contributions, including mechanotransduction currents, intracellular Ca2+ stores, as well as CaV1.3a-dependent currents (our unpublished observations). When we examined both cav1.3a mutants, we observed that mechanically evoked Ca2+ responses were reduced greater than twofold (Fig. 1B,C; R1250X, 37.1%; R284C, 32.5%; n = 10 NMs). This dramatic reduction in Ca2+ response indicates that CaV1.3a-mediated Ca2+ current is the major contributor to our Ca2+ signal. In addition, both mutants showed a comparable reduction in response size, suggesting that both alleles of cav1.3a are nonfunctional.
Figure 1.
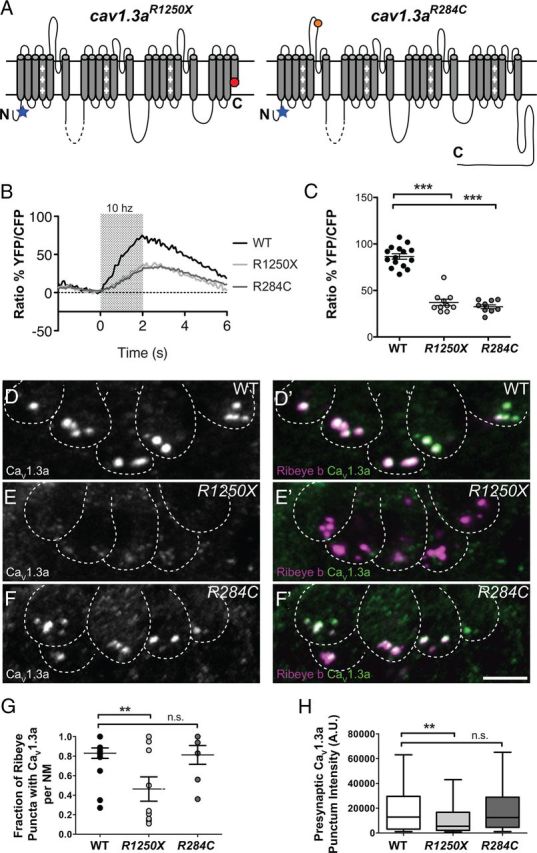
Characterization of CaV1.3a channel localization and activity in cav1.3a mutants. A, Diagrams representing the secondary structure of the α-pore-forming subunit CaV1.3a. Each diagram represents the expected protein resulting from the genetic lesions in each cav1.3a mutant. The position of the antibody epitope is denoted by a blue star. B, Mechanically evoked Ca2+ responses in WT and cav1.3a mutants at 5 dpf in response to a 2 s, 10 Hz alternating square waveform. Each trace represents the average response of hair cells from four NMs. C, Scatter plot depicts the average Ca2+ response per NM in WT and cav1.3a mutants. n ≥ 4 fish and n ≥ 10 NMs per genotype. Error bars are SEM. ***p < 0.001, defined by the Dunnett's multiple comparison test. D–F, Representative labeling of CaV1.3a clusters in cross-sections of NMs in 5 dpf WT (B), R1250X (C), and R284C (D) larvae. Dashed lines outline hair cells. Ribeye b label in merged images indicates CaV1.3a clusters localized to synaptic ribbons. Scale bar, 3 μm. G, Fraction of Ribeye with localized CaV1.3a clusters within NMs (5 dpf). Each data point represents the NM at position 2 along the trunk (NM2) in individual larvae. Error bars are SEM. **p < 0.01, defined by the Dunnett's multiple comparison test. H, Box plots of the fluorescent intensities of presynaptic CaV1.3a. These plots show the median value (horizontal bar), the upper and lower quartiles (box), and the range (whiskers). Whiskers indicate the 10th and 90th percentiles. **p < 0.01, defined by the Dunn's multiple comparison test.
To subsequently characterize how these mutations affect CaV1.3a stability and localization in hair cells, we used an antibody against a peptide sequence at the N-terminal tail (Sidi et al., 2004; Sheets et al., 2011) and examined CaV1.3a immunoreactivity in cav1.3a mutants. In 5-d-old larvae, we observed CaV1.3a clusters at ribbon synapses in WT and both cav1.3a mutants. R1250X NM hair cells had significantly fewer CaV1.3a immunolabeled puncta localized to synapses (Fig. 1D,E,G), and the fluorescence intensities of these puncta were dramatically reduced compared with WT (Fig. 1D,E,H). In contrast, R284C NM hair cells had no significant difference in presynaptic CaV1.3a puncta number or intensity compared with WT NMs (Fig. 1F–H). Together, these results suggest that the R1250X mutation may affect protein stability and/or localization to the synaptic ribbon, whereas the R284C mutation appears to not affect the stability or localization of the channel.
Presynaptic ribbons and PSDs are enlarged in cav1.3a mutant hair cells
To assess how the loss of CaV1.3a conductance might affect the morphology of ribbon synapses in hair cells, we examined immunolabel of Ribeye and the afferent PSD in NM hair cells from two developmental stages: relatively immature NMs at 3 dpf and comparatively mature NMs at 5 dpf (Murakami et al., 2003; Santos et al., 2006).
In immature NMs at 3 dpf, we observed that presynaptic Ribeye puncta were significantly more intense in both cav1.3a mutants (∼1.8-fold greater mean intensity) compared with WT puncta (Fig. 2A–D), indicating that mutant synaptic ribbons were larger. We observed a similar change in mutant hair cells of the inner ear (data not shown). In contrast to ribbon size, the number of presynaptic ribbons per NM hair cell was comparable between cav1.3a mutants and WT siblings (Fig. 2F,G). However, the number of cytoplasmic Ribeye puncta was significantly greater in cav1.3a mutants (Fig. 2F,H). The increased presence of discernible cytoplasmic Ribeye indicates either an increase in the number of cytoplasmic Ribeye aggregates or a relative increase in the size of the aggregates, allowing us to resolve them with immunolabel. Next we focused our analysis at the afferent PSD, using an antibody against the PSD-95 family of MAGUKs. We observed significantly more intense MAGUK puncta (approximately twofold greater mean intensity) in cav1.3a mutants compared with WT siblings (Fig. 2E).
Figure 2.

Characterization of ribbon-synapse morphology in cav1.3a mutants at 3 and 5 dpf. A–C, Representative images of Ribeye b (Rib b) and MAGUK immunolabel in NM (position 1) hair cells of a 3 dpf WT (A), R1250X (B), and R284C larva (C). Scale bars: main panels, 3 μm; right panels, 1 μm. D, E, Box plots of puncta intensities in 3 dpf cav1.3a mutant and WT NM1 hair cells. Whiskers indicate the 10th and 90th percentiles. Each plot represents a population of intensity measurements of individual labeled punctum collected from NM1 hair cells of 14–15 individual larvae. D, Intensities of presynaptic Ribeye b. Mann–Whitney U test, ***p < 0.0001 for both mutant alleles. E, Intensities of postsynaptic MAGUK. Mann–Whitney U test, ***p < 0.0001 and **p = 0.0025, respectively. F, Side views of Ribeye b in 3 dpf WT and cav1.3a mutant hair cells. Hair cells are delineated with a dashed outline. White arrows indicate Ribeye aggregates in the cell body; magenta asterisks indicate presynaptic ribbons. Scale bar, 1 μm. G, H, The number of presynaptic and extrasynaptic Ribeye b aggregates per hair cell in 3 dpf WT and cav1.3a mutants. Each circle represents NM1 within a larva. The number of puncta per hair cell was approximated by dividing the number of Ribeye puncta within an NM by the number of hair cells in the NM. Error bars are SEM. G, Number of presynaptic Ribeye b puncta. Unpaired t test, p = 0.6876 and 0.9290, respectively. H, Number of cytoplasmic Ribeye b aggregates. Unpaired t test, ***p < 0.0001 for both mutant alleles. I–K, Representative images of Ribeye b and MAGUK label in NM2 hair cells of a 5 dpf WT (I), R1250X (J), and R284C larva (K). Scale bars: main panels, 3 μm; right panels, 1 μm. L–M, Box plots of puncta intensities in 5 dpf cav1.3a mutant and WT sibling NM2 hair cells. Whiskers indicate the 10th and 90th percentiles. Each plot represents a population of intensity measurements collected from NM2 hair cells of 10–11 individual larvae. L, Intensities of presynaptic Ribeye b. Mann–Whitney U test, p = 0.6138 and ***p < 0.0001, respectively. M, Intensities of postsynaptic MAGUK. Mann–Whitney U test, ***p < 0.0001 for both mutant alleles. N–O, The number of presynaptic and extrasynaptic Ribeye b aggregates per hair cell in 5 dpf WT and cav1.3a mutants. Each circle represents NM2 within an individual larva. Error bars are SEM. N, Number of presynaptic Ribeye b puncta. Unpaired t test, p = 0.0611 and 0. 6214, respectively. O, Number of cytoplasmic Ribeye b aggregates. Unpaired t test, *p = 0.03 and ***p = 0.0001, respectively.
To determine whether these synaptic changes persist in mature hair cells, we extended our analysis to the later stage of 5 dpf. In R284C larvae, we observed a similar phenotype as in 3-d-old mutants, significantly more intense presynaptic and postsynaptic immunolabeled puncta (Fig. 2K–M), as well as a significantly greater number of cytoplasmic Ribeye aggregates (Fig. 2O). However, when we examined hair cells in R1250X NMs at 5 dpf, we found that the phenotype was not as striking as in 3 dpf mutants (Fig. 2J,L,O). On a gross scale, we also noticed that there were significantly fewer hair cells per NM in cav1.3aR1250X larvae compared with WT siblings at 5 dpf (mean hair cell number per NM: WT sibling, 15; mutant, 12; unpaired t test, p = 0.0119), indicating that mutant hair cells with reduced levels of truncated CaV1.3a are more perturbed than hair cells with nonconducting channels. Overall, these findings suggest that CaV1.3a is involved in regulating the assembly or accumulation of Ribeye in hair cells.
cav1.3a mutant hair cells progressively lose presynaptic and postsynaptic juxtaposition
In addition to the enlargement of presynaptic and postsynaptic specializations in cav1.3a mutants, we observed a progressive deterioration in the juxtaposition of these specializations. In WT hair cells, each presynaptic ribbon is intimately apposed to a patch of postsynaptic MAGUK, similar to observations of Ribeye and GLUR2/3 immunolabel in the mouse organ of Corti (Khimich et al., 2005; Nemzou N et al., 2006; Meyer et al., 2009; Liberman et al., 2011). Using confocal microscopy, Ribeye and MAGUK immunolabel appear to partially overlap at any orientation of the sample relative to the lens (Fig. 3A,B). This is because the distances between these synaptic components are smaller than the diffraction limit (∼250 nm), therefore too small to resolve. We used this inherent property of confocal microscopy to quantify the juxtapostion of a large cohort of synapses (∼250–300 synapses per condition) by comparing the percentage of MAGUK immunolabel-containing pixels that overlap with Ribeye in individual NMs. At 3 dpf, we saw comparable overlap of MAGUK immunolabel with Ribeye in WT and cav1.3a mutant NMs (Fig. 3C), indicating that CaV1.3a is not required to set up the initial association of presynapse and postsynapse. In contrast, at 5 dpf, we observed a significant difference in the percentage of MAGUK-labeled fluorescent pixels overlapping with Ribeye in mutant NMs of either cav1.3a allele compared with WT (Fig. 3D). This result was surprising because hair cells in R284C larvae have intact but nonconducting CaV1.3a channels that localize to the ribbon synapse (Fig. 1D′,H). Overall, these data suggest that conductance through CaV1.3a may be required to maintain synaptic juxtaposition.
Figure 3.
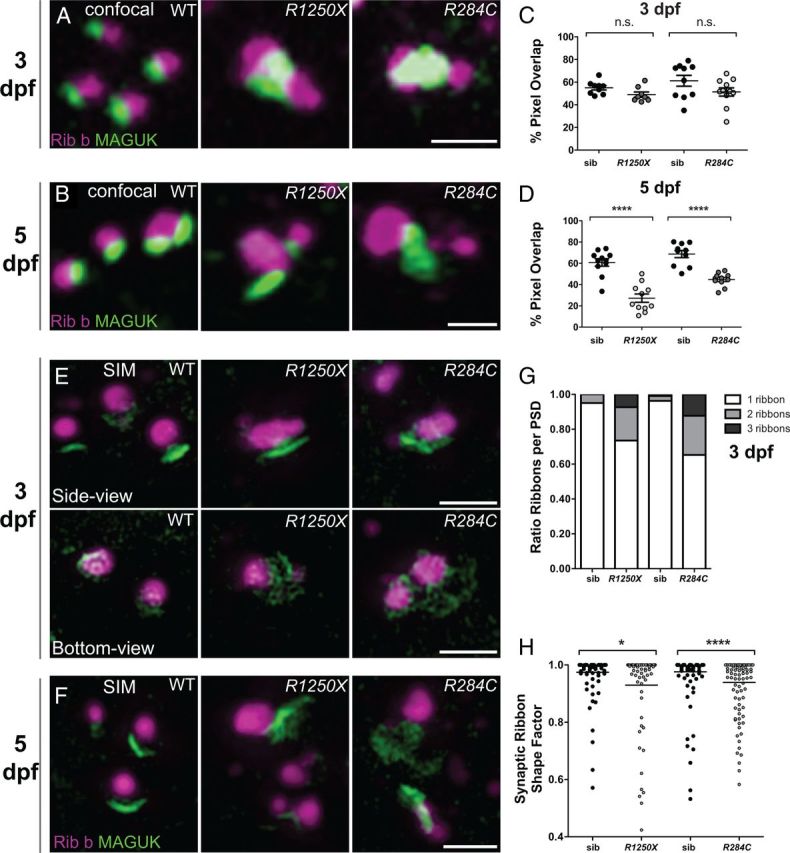
cav1.3a mutant hair-cell synapses progressively lose juxtaposition of presynaptic and postsynaptic components. A, B, Representative confocal images of Ribeye b (Rib b) and MAGUK in 3 dpf (A) and 5 dpf (B) WT and cav1.3a mutant hair cells. For display purposes, images were resampled (bicubic) in Photoshop to minimize pixilation. Scale bars, 1 μm. C, D, Percentage of MAGUK-label containing pixels overlapping with Ribeye b in 3 dpf (C) and 5 dpf (D) WT and cav1.3a mutant NM hair cells. Each circle represents an NM in an individual larva. Error bars are SEM. C, MAGUK immunolabel overlapped with Ribeye b comparably in 3 dpf mutants and WT. Unpaired t test, p = 0.1811 and 0.1162, respectively. D, MAGUK immunolabel overlapped significantly less with Ribeye b in 5 dpf mutants. Unpaired t test, ***p < 0.0001 for both mutant alleles. E, F, SR-SIM images of ribbon synapses in 3 dpf (E) and 5 dpf (F) cav1.3a mutants and WT. Scale bars, 1 μm. E, Images of 3 dpf ribbon synapses. The synaptic ribbons in cav1.3a mutants appear enlarged and often misshapen. The bottom-view images show MAGUK label beneath the ribbon synapse. F, Images of 5 dpf ribbon synapses. MAGUK appears even less spatially restricted to the synaptic ribbon than in 3 dpf hair cells. G, Fraction of 3 dpf ribbon synapses within individual NMs with PSDs juxtaposing one, two, or three synaptic ribbons. cav1.3a mutant NMs synapses contain two to three synaptic ribbons with much greater frequency than WT (n = 4 NMs per condition, each containing ∼15–25 synapses). H, The shape factor of synaptic ribbons in 3 dpf hair cells. Each spot represents an individual ribbon. The horizontal bars represent the mean values. Synaptic ribbons are significantly less round in cav1.3a mutants than WT siblings (sib). Mann–Whitney U test, *p = 0.0266 and ****p < 0.0001, respectively.
Although correlation of fluorescent intensities is a useful measure, we sought to resolve subtle structural differences between WT and cav1.3a mutant ribbon synapses. We therefore examined hair-cell synapses with SR-SIM. SR-SIM overcomes the diffraction limit by acquiring multiple images through a rotating grid and then extracting image information from the resulting moiré pattern, improving resolution by a factor of two (Gustafsson, 2000). In WT hair-cell synapses at either 3 or 5 dpf, MAGUK appeared as elongated patches spatially restricted to synaptic ribbons, generally at a 1:1 ratio (Fig. 3E–G). In 3 dpf cav1.3a mutant synapses, MAGUK often appeared less spatially constricted to the ribbon (Fig. 3E), and we observed a larger proportion of synapses with two or three synaptic ribbons associated with a single patch of MAGUK (Fig. 3G). By 5 dpf, MAGUK was even less spatially constricted to the synapse in cav1.3a mutant hair cells compared with 3 dpf larvae (Fig. 3F), supporting the notion that presynaptic and postsynaptic juxtaposition progressively degrades in cav1.3a mutants.
In SR-SIM images, we also noted that synaptic ribbons in cav1.3a mutant hair cells were frequently misshapen (Fig. 3E). Using a standard shape factor that varies from 0 for elongated shapes to 1.0 for perfectly round shapes, we were able to quantify the shape of synaptic ribbons. At 3 dpf, mutant synaptic ribbons were, on average, significantly less round (Fig. 3H), further supporting a role for CaV1.3a in refining the architecture of synaptic ribbons.
Because CaV1.3a is required for neurotransmitter release at hair-cell active zones, we sought to determine whether the synaptic phenotype we observed in cav1.3a mutants was attributable to loss of synaptic transmission. We therefore examined vglut3 mutants that lack both evoked and spontaneous synaptic transmission at hair-cell synapses (Obholzer et al., 2008; Trapani and Nicolson, 2011). Using Ca2+ imaging, we found that, consistent with the results of previous studies (Obholzer et al., 2008; Ruel et al., 2008), the evoked Ca2+ responses in vglut3 mutants were indistinguishable from WT siblings (Fig. 4B). We then examined the juxtaposition of synaptic components in vglut3 mutants and observed normal apposition of Ribeye and MAGUK in 5 dpf larvae (Fig. 4C,D,G). In addition, we examined the intensities of presynaptic Ribeye and MAGUK immunolabeled puncta in 3 and 5 dpf larvae. At 3 dpf, the intensities of presynaptic Ribeye and MAGUK puncta in vglut3 mutant hair cells were comparable with WT siblings (Fig. 4E,F). In contrast, presynaptic Ribeye puncta were slightly more intense in vglut3 mutants at 5 dpf (Fig. 4E) but not to the same extent as cav1.3a mutants. Similar to cav1.3a mutants, MAGUK puncta were significantly more intense in 5 dpf vglut3 mutants; this comparable increase in intensity suggests that loss of glutamate release contributes to the expansion of the PSD in 5 dpf cav1.3a mutants (Fig. 4F). Overall, these results support that the function of CaV1.3a in modulating synaptic ribbon size during development and maintaining synaptic juxtaposition is independent of its role in synaptic transmission.
Figure 4.

vglut3 mutant hair cells have normal calcium responses and relatively normal synaptic ribbons. A, Representative immunolabeling of CaV1.3a clusters in a cross-section of an NM in vglut3484+2T>2 larvae at 5 dpf. Merged image includes Ribeye b and DAPI. Scale bar, 3 μm. B, Scatter plot depicts the average calcium response per NM in WT and vglut3 mutants at 3 and 5 dpf. n ≥ 3 fish and n ≥ 7 NMs per genotype. Error bars are SEM. C, D, Representative confocal images of Vglut3, Ribeye b (Rib b), and MAGUK label in NM2 hair cells of a 5 dpf WT (C) and vglut3 484+2T>2 larvae (D). Scale bars: mail panels, 3 μm; right panels, 1 μm. E, F, Box plots of immunolabel puncta intensities in 3 and 5 dpf vglut3 484+2T>2 and WT sibling NM2 hair cells. Whiskers indicate the 10th and 90th percentiles. Each plot represents a population of intensity measurements collected from NM2 hair cells of 6 (3 dpf) or 10–12 (5 dpf) individual larvae. E, Intensities of presynaptic Ribeye b puncta. Mann–Whitney U test, p = 0.2420 and *p = 0.0156, respectively. F, Intensities of postsynaptic MAGUK puncta. Mann–Whitney U test, p = 0.2249 and ***p < 0.0001, respectively. G, Percentage of MAGUK-label containing pixels overlapping with Ribeye b in 5 dpf WT and vglut3 484+2T>2 mutant NM hair cells. MAGUK immunolabel overlapped with Ribeye b comparably in mutants and WT (unpaired t test, p = 0.1811). Each circle represents an NM in an individual larva. Error bars are SEM.
Pharmacological block of CaV1.3a rapidly enlarges hair-cell synaptic ribbons in 3-d-old larvae
Aside from inducing neurotransmitter release, Ca2+ influx through L-type calcium channels can act on other cellular processes (Catterall, 2010). Based on the R284C mutant phenotype, we predicted that Ca2+ influx plays a role in regulating ribbon size. To test this, we pharmacologically blocked L-type calcium channels in WT larvae with bath application of isradipine, an antagonist of L-type calcium channels. Using Ca2+ imaging, we observed that, after 15 min application of isradipine, Ca2+ responses were significantly reduced in 3-d-old WT NMs and to a similar extent as observed in cav1.3a mutants (Fig. 5A,B). Moreover, exposure to isradipine did not further reduce Ca2+ responses in cav1.3a mutant hair cells (Fig. 5B). We then determined whether acute block phenocopied the mutant defects in developing NM hair cells at 3 dpf. When examining Ribeye b immunolabel in isradipine-treated WT larvae, we saw significantly more intense presynaptic puncta within 15 min of exposure to the drug (Fig. 5C,C′,D). Moreover, after 1 h exposure to isradipine, we observed a significant increase in MAGUK immunolabel intensity (Fig. 5C″; Mann–Whitney U test, p > 0.0001), indicating acute block of CaV1.3a phenocopies the synaptic morphology we observed in 3 dpf cav1.3a mutant hair cells.
Figure 5.
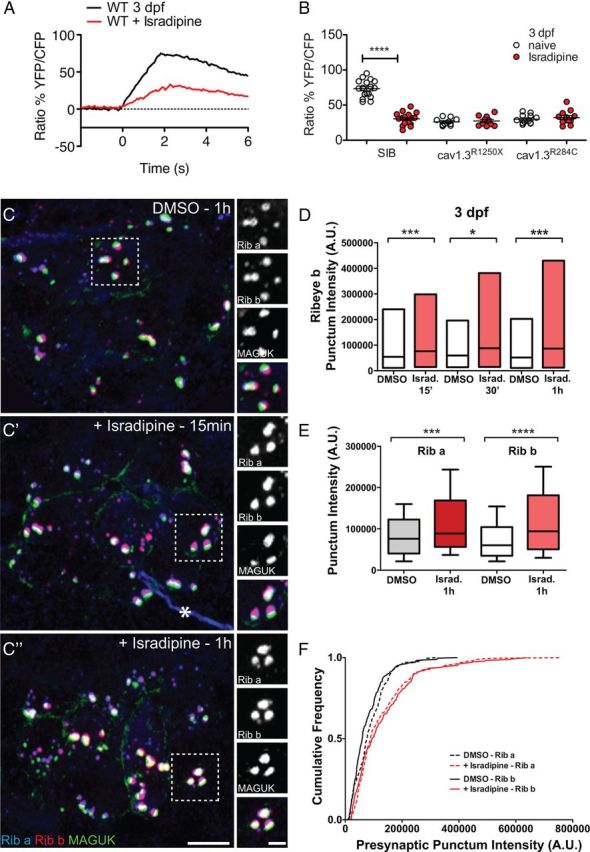
Pharmacological block of CaV1.3a at 3 dpf enlarges synaptic ribbons in WT hair cells. A, Mechanically evoked Ca2+ responses in WT untreated NM hair cells (black) and hair cells exposed to 10 μm isradipine (red) for 15 min at 3 dpf. Cells were stimulated with a fluid jet for 2 s, using a 10 Hz alternating square waveform. Each trace represents the average response of hair cells from four NMs. B, Scatter plot depicts the average Ca2+ response per NM in WT and cav1.3a mutants at 3 dpf (white circles) and after isradipine treatment (red circles). n ≥ 4 fish and n ≥ 10 NMs per genotype. Error bars are SEM. ****p < 0.0001, defined by a paired t test. C–C″, Representative images of Ribeye a (Rib a), Ribeye b (Rib b), and MAGUK immunolabel in NM1 of 3 dpf larvae exposed to 0.1% DMSO alone (C) or 10 μm isradipine for 15 min (C′) or 1 h (C″). Ribeye a and Ribeye b appear more intense than the control after 15 min exposure to isradipine. Asterisk in C′ indicates nonspecific label of nerve fiber. Scale bars: main panels, 3 μm; right panels, 1 μm. D, Floating bar plot of presynaptic Ribeye b intensities in 3 dpf larvae after exposure to 0.1% DMSO alone or 10 μm isradipine (Israd.) for 15 min, 30 min, and 1 h. The floating bars represent the minimum to maximum intensities, and the horizontal bars indicate the mean intensities. Mann–Whitney U test, ***p = 0.0005 (15′), *p = 0.0021 (30′), and ***p < 0.0001(1h). E, Box plots of the intensities of presynaptic Ribeye a and Ribeye b puncta in 3 dpf larvae exposed to DMSO or 10 μm isradipine for 1 h. Both Ribeye a and Ribeye b are significantly more intense in the isradipine-treated hair cells than the control. Mann–Whitney U test, ****p < 0.0001. Each plot represents a population of intensity measurements collected from NM1 hair cells of 12 individual larvae. F, Cumulative frequency distributions of Ribeye a and Ribeye b puncta intensities in 3 dpf isradipine-treated and control hair cells.
Because zebrafish have two isoforms of Ribeye within hair-cell synaptic ribbons (Sheets et al., 2011), we also examined Ribeye a immunolabel. We observed presynaptic Ribeye a puncta were also significantly more intense in isradipine-exposed WT larvae (Fig. 5E). The relative frequency of more intense presynaptic Ribeye puncta was similar for both isoforms of Ribeye in isradipine-treated larvae (Fig. 5F), indicating an increase in the amount of overall Ribeye protein within presynaptic ribbons. We also saw a similar effect of isradipine on Ribeye immunolabel of inner ear hair cells (data not shown). These results suggest that acute block of CaV1.3a can rapidly increase the size of hair-cell synaptic ribbons.
In addition, we examined whether acute exposure to isradipine could introduce fine structural changes in synapse morphology in 3 dpf larvae, similar to what we observe in cav1.3a mutant hair cells. In SR-SIM images, the area of the presynaptic ribbon is, on average, larger in isradipine-treated hair cells than control cells (Fig. 6A–C), and the ribbons are significantly less round (Fig. 6E). Moreover, we observed a larger ratio of synapses that consisted of two or three synaptic ribbons associated with a single PSD in isradipine-treated hair cells (Fig. 6D), although the difference was not as dramatic as what we observed in cav1.3a mutant hair cells (Fig. 3G). As seen in 3 dpf cav1.3a mutants, we did not observe a change in juxtaposition of Ribeye and MAGUK. Our SR-SIM analysis provides evidence that Ca2+ influx though CaV1.3a regulates the size of hair-cell synaptic ribbons and contributes to synaptic refinement.
Figure 6.

Pharmacological block of CaV1.3a leads to less refined ribbon synapses in hair cells at 3 dpf. A, B, SR-SIM images of ribbon synapses in 3 dpf WT hair cells in larvae exposed to 0.1% DMSO (A) or 10 μm isradipine for 1 h (B). In isradipine-treated larvae, hair-cell synaptic ribbons appear enlarged and often misshapen. Scale bars, 1 μm. C, Average area of synaptic ribbons in control and isradipine (Israd.)-treated hair cells at 3 dpf. DMSO, 233 ± 12 nm2; isradipine, 293 ± 18 nm2; Mann–Whitney U test, *p = 0.0415. Error bars are SEM. D, Fraction of 3 dpf ribbon synapses within individual NMs with PSDs juxtaposing one, two, or three synaptic ribbons. Isradipine-treated NM hair-cell synapses contain two to three synaptic ribbons with slightly greater frequency than control (n = 4 NMs per condition, each containing ∼15–25 synapses). E, The shape factor of synaptic ribbons. Each spot represents an individual ribbon. Synaptic ribbons in hair cells are significantly less round in isradipine-treated larvae than control. Mann–Whitney U test, **p = 0.0051.
Because we exposed whole larvae to isradipine and are likely blocking other L-type calcium channels, we determined whether the enlargement of synaptic ribbons in hair cells was attributable to specific block of CaV1.3a. We exposed R1250X mutants to isradipine and found that presynaptic Ribeye intensity was comparable with DMSO-treated mutants (see Fig. 8B). This result indicates that the enlarged synaptic ribbons we observe in hair cells are attributable to specific pharmacological block of CaV1.3a. Collectively, these results support the notion that Ca2+ influx though CaV1.3a modulates synaptic ribbon size and contributes to the refinement of hair-cell synapses during development.
Figure 8.

Response and synaptic changes in cav1.3a mutant hair cells to isradipine and S-(−)Bay K8644 exposure. A, Mechanically evoked calcium responses in R1250X hair cells (gray line) and after a 15 min treatment with 10 μm isradipine (Israd.; red line) at 3 dpf. Each trace represents the average response of hair cells from four NMs. B, Box plots of presynaptic Ribeye a and Ribeye b puncta intensities in 3 dpf R1250X and WT sibling (sib) larvae exposed to DMSO or 10 μm isradipine for 1 h. To achieve the greatest dynamic range of intensities, laser settings were adjusted for imaging R1250X hair cells using the brightest R1250X DMSO-treated NM (thus, relative intensities of control R1250X larvae and WT siblings look comparable). Ribeye b intensities in the isradipine-treated R1250X hair cells are comparable with the DMSO-treated mutant hair cells (Mann–Whitney U test, R1250X, p = 0.3374; WT, ****p < 0.0001). Each plot represents a population of intensity measurements collected from NM1 hair cells of seven individual larvae. C, Mechanically evoked calcium responses in R1250X hair cells (gray line) and after a 15 min treatment with 10 μm S-(−)Bay K8644 (green line) at 3 dpf. Each trace represents the average response of hair cells from four NMs. D, Box plots of presynaptic Ribeye a and Ribeye b puncta intensities in 3 dpf R1250X and WT sibling larvae exposed to DMSO or 10 μm S-(−)Bay K8644 for 1 h. Ribeye b intensities in the Bay K8644-treated R1250X hair cells were significantly reduced compared with DMSO-treated hair cells but to a lesser extent than WT siblings (Mann–Whitney U test, R1250X, ****p = 0.0010; WT sibling, ***p < 0.0001). Each plot represents a population of intensity measurements collected from NM1 hair cells of seven individual larvae. E–E′, Fraction of PSDs (MAGUK immunolabel) with adjacent synaptic ribbons within an NM. Each circle represents NM1 in an individual larva. There are no significant differences in the ratio of intact ribbon synapses within hair cells of drug-treated R1250X larvae versus control larvae (E′), but there are significantly fewer intact synapses in S-(−)Bay K8644-treated WT siblings. ***p < 0.0001, defined by the Dunn's multiple comparison test.
Activation of L-type calcium channels depletes synaptic ribbons in 3-d-old larval hair cells
We reasoned that, if blocking L-type calcium channels leads to larger synaptic ribbons in 3 dpf hair cells, then activating L-type calcium channels should lead to smaller synaptic ribbons. We therefore exposed 3 dpf larvae to the L-type calcium channel agonist S-(−)Bay K8644. Given that increased Ca2+ influx can lead to excitoxicity, we took care to choose a concentration of S-(−)Bay K8644 that significantly increased Ca2+ influx in lateral-line hair cells (Fig. 7A,B) but did not compromise hair-cell morphology or lead to cell death (data not shown). Hair cells exposed to 10 μm S-(−)Bay K8644 showed significantly reduced presynaptic Ribeye a and Ribeye b puncta intensity compared with controls (Fig. 7C–H). Moreover, in S-(−)Bay K8644-exposed hair cells, there was a significant decrease in the number of intact synapses as defined by presynaptic Ribeye juxtaposing MAGUK (Fig. 7I).
Figure 7.

Pharmacological activation of L-type calcium channels reduces synaptic ribbons in hair cells at 3 dpf. A, Mechanically evoked Ca2+ responses in untreated NM hair cells (black) and hair cells treated with 10 μm S-(−)Bay K8644 (green) for 15 min at 3 dpf in response to a 2 s, 10 Hz stimulus. Each trace represents the average response of hair cells from four NMs. B, Scatter plot depicts the average Ca2+ response per NM in WT and cav1.3a mutants at 3 dpf (white circles) and after S-(−)Bay K8644 treatment (green circles). n ≥ 4 fish and n ≥ 10 NMs per genotype. Error bars are SEM. **p < 0.01, defined by a paired t test. C–E, Representative images of Ribeye a (Rib a), Ribeye b (Rib b), and MAGUK label in NM1 of 3 dpf larvae exposed to 0.1% DMSO alone (C), 10 μm isradipine (Israd.) (D), or 10 μm S-(−)Bay K8644 (E–E′) for 1 h. Scale bars: main panels, 3 μm; right panels, 1 μm. D, Ribeye and MAGUK puncta appear more intense after 1 h exposure to isradipine in hair cells than untreated (data not shown) and DMSO-treated larvae. E, Ribeye and MAGUK puncta appear less intense in the majority (n = 9 of 15 NMs) of S-(−)Bay K8644-treated NMs. In addition, MAGUK puncta often appeared without discernible adjacent Ribeye (white arrowheads; refer to I for quantification). E′, In a subset of S-(−)Bay K8644-treated NMs (n = 6 of 15 NMs) variable Ribeye label was observed. A few hair cells within the NMs showed diffuse Ribeye label with somewhat enlarged puncta (right panels). F, G, Box plots of puncta intensities in 3 dpf NM1 hair cells treated with buffer alone (E3), 0.1% DMSO, 10 μm isradipine, or 10 μm S-(−)Bay K8644 for 1 h. Whiskers indicate the 10th and 90th percentiles (n = 7–15 larvae for each plot). F, Intensity of presynaptically localized Ribeye a. ***p < 0.0001, defined by the Dunn's multiple comparison test. G, Intensity of presynaptically localized Ribeye b. ***p < 0.0001, defined by the Dunn's multiple comparison test. H, Cumulative frequency distribution of presynaptic Ribeye b puncta intensities in 3 dpf hair cells treated with E3 (gray), DMSO (black), isradipine (red), or Bay K8644 (green). I, Fraction of PSDs (MAGUK immunolabel) with adjacent synaptic ribbons within an NM. Each circle represents NM1 in an individual larva. S-(−)Bay K8644-treated NMs have a significantly higher percentage of MAGUK puncta without adjacent Ribeye immunolabel. ***p < 0.0001, defined by the Tukey's multiple comparison test. J, Relative expression level of ribeye b transcripts in larvae exposed to DMSO alone or with drug for 1 h. There was no significant change in ribeye b expression levels in drug-treated larvae (Wilcoxon's signed-rank test). The level of gene expression in DMSO was normalized to one (n = 3 experiments).
Notably, S-(−)Bay K8644 treatment resulted in greater variability of Ribeye label than observed in control and isradipine-treated hair cells. The labeling could be described as two types; first, NMs, in which all hair cells showed an overall reduction in presynaptic Ribeye intensity (9 of 15 NMs; Fig. 7E), and second, NMs with hair cells containing Ribeye puncta with variable intensities (6 of 15 NMs; Fig. 7E′). In this latter case, some hair cells showed depleted presynaptic puncta, whereas other hair cells had somewhat enlarged presynaptic puncta with diffuse Ribeye label throughout the hair-cell body (Fig. 7E′, right column). Additionally, we observed a reduction in presynaptic Ribeye intensity in R1250X larvae exposed to S-(−)Bay K8644 (Fig. 8D), although not as sizable as what we observed in WT siblings. This result implies that bath application of Bay K8644 may activate additional L-type calcium channels and is in contrast to what we saw with isradipine exposure of R1250X larvae, in which isradipine had no effect on Ribeye intensity. Alternatively, S-(−)Bay K8644 treatment may have nonspecific effects on hair-cell synapse morphology.
Overall, our results with antagonist or agonist treatment suggest that modulation of calcium channel function has dramatic effects on synaptic ribbon architecture. Because L-type calcium channels have been implicated in the activation of transcription in neurons (Dolmetsch et al., 2001), we sought to address whether acute block or activation leads to modulation of ribeye expression. We therefore performed qPCR and observed no significant change in the relative expression of transcripts of ribeye b in larvae treated with either isradipine or S-(−)Bay K8644 (Fig. 7J), indicating that changes in Ribeye immunolabel intensity are not attributable to altered gene expression of ribeye.
Mature 5-d-old hair-cell ribbon synapses are not susceptible to acute pharmacological block of L-type calcium channels
The formation of ribbon synapses in nascent zebrafish hair cells is fairly rapid, occurring within a 6–12 h period (Sheets et al., 2011). Although it is apparent that ribbon synapses have initially formed in 3 dpf NM hair cells, it was not clear whether modulation of synaptic ribbon size by Ca2+ influx is restricted to a critical period of synapse maturation or whether Ca2+ influx is capable of changing ribbons in more mature synapses. We therefore tested whether acute pharmacological manipulation of CaV1.3a in comparatively mature NMs of 5 dpf larvae would affect ribbon-synapse morphology. When exposed to isradipine, we observed a significant reduction of Ca2+ transients in NM hair cells (Fig. 9D) comparable with that of cav1.3a mutants. However, we saw no change in the intensity of presynaptic Ribeye (Fig. 9A,B,F–H), suggesting that ribbon synapses in more mature NMs are insensitive to acute block of CaV1.3a. We also observed a less profound effect in 5 dpf hair cells exposed to S-(−)Bay K8644 than observed in 3 dpf larvae; presynaptic Ribeye intensity was reduced (Fig. 9C,F–H) but not to the same extent that we see at 3 dpf, and there was no difference in the ratio of intact ribbon synapses per NM compared with control larvae (Fig. 9I). These results suggest there is a period of synaptic maturation in zebrafish hair cells in which Ca2+ influx through CaV1.3 refines synaptic ribbons.
Figure 9.

Relatively mature hair-cell synapses in 5 dpf larvae are less susceptible to pharmacological manipulation of L-type calcium channels. A, Representative confocal images of Ribeye a (Rib a), Ribeye b (Rib b), and MAGUK immunolabel in NM2 of 5 dpf larvae exposed to 0.1% DMSO alone (control, A), 10 μm isradipine (B), or 10 μm S-(−)Bay K8644 (C) for 1 h. Scale bars: main panels, 3 μm; right panels, 1 μm. B, Ribeye labeled puncta appear comparable with control-treated larvae after 1 h exposure to isradipine. C, Ribeye labeled puncta appear somewhat less intense in S-(−)Bay K8644-treated NMs compared with controls. D, E, Scatter plots depict the average Ca2+ response per NM in WT and cav1.3a mutants at 5 dpf (white squares) and after Bay K8644 (red squares) or isradipine (green squares) treatment. n ≥ 4 fish and n ≥ 10 NMs per genotype. Error bars are SEM. ***p < 0.001, ****p < 0.0001, defined by a paired t test. SIB, Sibling. F, G, Box plots of puncta intensities in 5 dpf NM2 hair cells treated with buffer alone (E3), 0.1% DMSO, 10 μm isradipine, or 10 μm S-(−)Bay K8644 for 1 h. Whiskers indicate the 10th and 90th percentiles. Each plot represents a population of intensity measurements collected from NM1 hair cells of 11–13 individual larvae. *p < 0.05, ***p < 0.0001, defined by the Dunn's multiple comparison test. H, Cumulative frequency distribution of Ribeye b presynaptic puncta intensities in 5 dpf hair cells treated with E3 (gray), DMSO (black), isradipine (red), or Bay K8644 (green). I, Ratio of PSDs (MAGUK immunolabel) with adjacent presynaptic ribbons within an NM. Each circle represents NM2 in an individual larva. There are no significant difference in the ratio of intact ribbon synapses within hair cells of drug-treated larvae versus control (one-way ANOVA, p = 0.3762). J, Representative confocal images of Ribeye a, Ribeye b, and MAGUK label in NM2 after exposure to 10 μm isradipine for ≥12 h. Scale bars: main panels, 3 μm; right panels, 1 μm. K, Intensity of presynaptic Ribeye b puncta (Mann–Whitney U test, ***p < 0.0001). Note the significant increase in Ribeye b label at 5 dpf, indicating that long-term block of Cav1.3a can induce changes in ribbon size at comparatively mature stages. L, Percentage of MAGUK-label containing pixels overlapping with Ribeye b in 5 dpf control and isradipine-treated NM hair cells. Each circle represents an NM in an individual larva. Error bars are SEM.
To further address whether there is a critical window of synaptic maturation in hair cells, we exposed 3 dpf larvae to 10 μm isradipine or DMSO alone for 1 h, washed out the drug, and then allowed the larvae to recover for 2 d. Interestingly, the ribbon morphology does not completely recover after washout of isradipine; we observed 1.4-fold greater mean intensity of presynaptic Ribeye b puncta in the isradipine-treated versus control larvae (Mann–Whitney U test, p = 0.0001; n = 10 larvae per condition). These data suggest that there is a period of developmental plasticity in hair cells in which modulating Ca2+ through CaV1.3 brings about lasting architectural changes in the synaptic ribbon.
Generality of ribbon-synapse modulation by Ca2+ influx
Because we observed changes in synaptic ribbons during inhibition or activation of Cav1.3a in hair cells, we sought to address whether regulation by Ca2+ influx is a general mechanism used at ribbon synapses in other cell types. In zebrafish larvae, ribeye a and a gene duplicate of cav1.3a, cav1.3b, are expressed in pinealocytes and photoreceptors (Sidi et al., 2004; Sheets et al., 2011). Because the peripherally located pineal gland is amenable to bath application of reagents and not occluded by pigment cells, such as photoreceptors, we used larval pinealocytes for our experiments. We exposed 3 dpf larvae to either isradipine or Bay K8644 and examined Ribeye a immunolabel in the pineal organ. Isradipine-treated larvae had significant increases in the average intensity of Ribeye a-labeled synaptic structures within their pineal organs than control larvae (Fig. 10A,B,D), whereas Bay K8644-treated larvae showed a reduction in average Ribeye a intensity (Fig. 10A,C,D). These data support that Ca2+ influx through L-type calcium channels may also regulate developmental ribbon-synapse plasticity in other cell types.
Figure 10.

Pharmacological manipulation of L-type calcium channels modulates Ribeye immunolabel intensity in zebrafish pinealocytes. A–C, Representative confocal images of Ribeye a immunolabel in the pineal organ of 3 dpf larvae exposed to DMSO (A), 10 μm isradipine (B), or 10 μm S-(−)Bay K8644 (C) for 1 h. Scale bar, 10 μm. D, Average intensities of Ribeye a aggregates in pineal organs at 3 dpf. Each circle represents one pineal organ. Isradipine (Israd.)-treated showed significantly more intense Ribeye a immunolabel, whereas S-(−) Bay K8644-treated showed less intense label than DMSO-treated control larvae. Mann–Whitney U test, **p = 0.0023 and *p = 0.0175, respectively.
Discussion
Our study reveals a unique role for the L-type calcium channel CaV1.3a in regulating Ribeye assembly and maintaining juxtaposition of synaptic components in developing zebrafish hair cells. Modulation of ribbon-synapse morphology by CaV1.3a and a requirement for alignment of synaptic components is supported by our findings that (1) genetically disrupting or pharmacologically blocking CaV1.3a produces enlarged synaptic ribbons and less refined ribbon synapses (i.e., changes in synaptic ribbon shape and a greater number of synaptic ribbons per single PSD), (2) pharmacologically activating L-type calcium channels leads to smaller or absent synaptic ribbons, (3) cav1.3a mutants show a progressive loss of presynaptic and postsynaptic juxtaposition, and (4) mature hair-cell synapses are not susceptible to short-term pharmacological block of CaV1.3a.
These data, combined with our previous study, reveal an interplay between Ribeye and CaV1.3 that is necessary for proper hair-cell ribbon synapse formation and maturation. We propose a model by which Ribeye-containing aggregates initially accumulate at the basolateral end of hair cells to form synaptic ribbons that stabilize afferent-nerve-fiber contacts and cluster CaV1.3 channels (Sheets et al., 2011). CaV1.3 channels then regulate synaptic-ribbon size during a critical period of development and contribute to the refinement and maintenance of synaptic contacts.
Several of our observations support a mechanism by which Ca2+ influx through CaV1.3 channels regulates the assembly of Ribeye protein, thereby affecting synaptic-ribbon size and morphology. Acute block of CaV1.3a during a critical time window of hair-cell maturation results in a rapid increase in presynaptic accumulations of both zebrafish isoforms of Ribeye, whereas activation of L-type calcium channels generally produces a decrease in presynaptic Ribeye. In contrast, we see no significant difference in the level of ribeye b transcripts in drug-treated larvae, suggesting that the changes in Ribeye intensity we observed in drug-exposed larvae were not attributable to regulation of ribeye at the transcriptional level. Additionally, in larvae with either mutant allele of cav1.3a, we observed a significantly greater number of Ribeye aggregates in the hair-cell body but no difference in the number of synaptic ribbons. These data suggest that Ca2+ influx though CaV1.3a may propagate Ca2+ signaling throughout the hair cell (e.g., Ca2+ induced Ca2+ release from ER stores) that regulates not only the accumulation of Ribeye at the synapse but also assembly of synaptic-ribbon precursors.
Previous studies of hair-cell synapses in other species have reported that synaptic ribbon size positively correlates with calcium influx (Martinez-Dunst et al., 1997; Schnee et al., 2005; Frank et al., 2009). In relation to these studies, our results initially seem paradoxical; how is it that we observe enlarged ribbons when calcium influx is blocked? A key observation in our study is that Ca2+-mediated changes in synaptic ribbon size occur during a critical window of hair-cell development. In our experiments, the plasticity of hair-cell ribbons was apparent only during early developmental stages, which were not examined in the previous studies referenced above. However, in agreement with the descriptions of mature synapses in other species, we observe that relatively mature hair-cell synapses at 5 dpf are not susceptible to acute pharmacological block of CaV1.3a. The actual source of heterogeneity of the size of hair-cell ribbon bodies is not clear. We speculate that larger cytosolic aggregates of Ribeye or early attachment of Ribeye aggregates before calcium currents peak may generate larger ribbon bodies that are able to recruit additional calcium channels to the ribbon synapse (Frank et al., 2010; Sheets et al., 2011). Such a scenario could explain why larger ribbons showed greater calcium influx in mature hair cells (Frank et al., 2009).
Considering that we observe a similar phenomenon in pinealocytes as we do in hair cells—namely, that pharmacological manipulation of L-type calcium channels modulates presynaptic Ribeye accumulation—we propose that Ca2+ influx through L-type calcium channels may regulate synaptic-ribbon morphology in other ribbon synapse-containing cell types. Previous ultrastructural studies of pineal organ and photoreceptor synapses have shown that synaptic ribbons are dynamic structures whose size and shape change in response to illumination (Vollrath and Spiwoks-Becker, 1996; Spiwoks-Becker et al., 2004) or diurnal cycle (Hull et al., 2006; Spiwoks-Becker et al., 2008). Moreover, recent studies report that manipulating internal Ca2+ levels with a chelator or ionophore also produces structural changes in photoreceptor synaptic ribbons (Spiwoks-Becker et al., 2004; Regus-Leidig et al., 2010), but the sources of intracellular Ca2+ were not identified. Our results point to presynaptic L-type Ca2+ channels as the initial source of Ca2+ that mediates dynamic changes in synaptic-ribbon morphology. Additional studies identifying downstream targets of Ca2+ influx may not only reveal essential signaling pathways for hair-cell synapse maturation but also uncover mechanisms of ribbon-synapse plasticity in other cell types.
Overall, both our genetic and pharmacological evidence support the idea that Ca2+ influx modulates the size, morphology, and, to some extent, the number of synaptic ribbons at active zones. How CaV1.3a refines the synapse and maintains the juxtaposition of presynaptic and postsynaptic components in hair cells is less clear. The function of CaV1.3a in synaptic maintenance appears to be independent of its role in synaptic transmission, because vglut3 mutants do not show a similar phenotype. Because we observed a failure to maintain synaptic alignment in R284C larvae, wherein nonconducting CaV1.3a channels localize correctly to synaptic ribbons, we propose that the physical presence of CaV1.3a is not sufficient to maintain postsynaptic juxtaposition. Instead, the phenotype indicates that Ca2+ influx through CaV1.3a may be mediating yet-to-be identified intracellular processes required for synaptic maintenance. Accordingly, we tested whether long-term block would result in loss of juxtaposition by exposing WT larvae to isradipine overnight, but synaptic juxtaposition was unaffected (Fig. 9L). This result suggests that either long-term block was not able to phenocopy the effects of congenital loss of CaV1.3a or that CaV1.3a may indeed play a structural role in maintaining ribbon synapses. Interestingly, the R284C amino acid substitution is within an extracellular loop of CaV1.3a (IS5–IS6), raising the possibility that this extracellular loop may interact with postsynaptic components. A similar interaction has been reported for the neuromuscular junction (Nishimune et al., 2004; Chen et al., 2011). At this type of synapse, the direct interaction of an extracellular loop of presynaptic P/Q-type and N-type voltage-gated calcium channels with muscle-derived laminin β2 is required for proper active-zone organization. Additional investigation may address whether CaV1.3a channel function or postsynaptic protein interaction with the IS5–IS6 extracellular loop is critical for maintaining synaptic alignment.
In conclusion, our results reveal several important roles for CaV1.3a in both the maturation and maintenance of hair-cell ribbon synapses. Future studies exploring the downstream mechanisms of the mediation of synaptic-ribbon size by CaV1.3 channel may shed light on not only hair-cell synaptic maturation but also reveal a general mechanism of ribbon-synapse plasticity relevant for synaptic function.
Footnotes
This study was supported by National Institutes of Health Grants R01 DC006880 and P30 DC005983, the M. J. Murdock Charitable Trust, and Howard Hughes Medical Institute. We thank Stefanie Kaech Petrie and Aurelie Snyder of the Advanced Light Microscopy Core at the Jungers Center (Oregon Health and Science University, Portland, OR) for training and assistance with SR-SIM image acquisition and analysis.
The authors declare no competing financial interests.
References
- Brandt A, Striessnig J, Moser T. CaV1.3 channels are essential for development and presynaptic activity of cochlear inner hair cells. J Neurosci. 2003;23:10832–10840. doi: 10.1523/JNEUROSCI.23-34-10832.2003. [DOI] [PMC free article] [PubMed] [Google Scholar]
- Brandt A, Khimich D, Moser T. Few CaV1.3 channels regulate the exocytosis of a synaptic vesicle at the hair cell ribbon synapse. J Neurosci. 2005;25:11577–11585. doi: 10.1523/JNEUROSCI.3411-05.2005. [DOI] [PMC free article] [PubMed] [Google Scholar]
- Buran BN, Strenzke N, Neef A, Gundelfinger ED, Moser T, Liberman MC. Onset coding is degraded in auditory nerve fibers from mutant mice lacking synaptic ribbons. J Neurosci. 2010;30:7587–7597. doi: 10.1523/JNEUROSCI.0389-10.2010. [DOI] [PMC free article] [PubMed] [Google Scholar]
- Catterall WA. Signaling complexes of voltage-gated sodium and calcium channels. Neurosci Lett. 2010;486:107–116. doi: 10.1016/j.neulet.2010.08.085. [DOI] [PMC free article] [PubMed] [Google Scholar]
- Chen J, Billings SE, Nishimune H. Calcium channels link the muscle-derived synapse organizer laminin β2 to Bassoon and CAST/Erc2 to organize presynaptic active zones. J Neurosci. 2011;31:512–525. doi: 10.1523/JNEUROSCI.3771-10.2011. [DOI] [PMC free article] [PubMed] [Google Scholar]
- Dirksen RT, Nakai J, Gonzalez A, Imoto K, Beam KG. The S5–S6 linker of repeat I is a critical determinant of L-type Ca2+ channel conductance. Biophys J. 1997;73:1402–1409. doi: 10.1016/S0006-3495(97)78172-4. [DOI] [PMC free article] [PubMed] [Google Scholar]
- Dolmetsch RE, Pajvani U, Fife K, Spotts JM, Greenberg ME. Signaling to the nucleus by an L-type calcium channel-calmodulin complex through the MAP kinase pathway. Science. 2001;294:333–339. doi: 10.1126/science.1063395. [DOI] [PubMed] [Google Scholar]
- Dou H, Vazquez AE, Namkung Y, Chu H, Cardell EL, Nie L, Parson S, Shin HS, Yamoah EN. Null mutation of alpha1D Ca2+ channel gene results in deafness but no vestibular defect in mice. J Assoc Res Otolaryngol. 2004;5:215–226. doi: 10.1007/s10162-003-4020-3. [DOI] [PMC free article] [PubMed] [Google Scholar]
- Frank T, Khimich D, Neef A, Moser T. Mechanisms contributing to synaptic Ca2+ signals and their heterogeneity in hair cells. Proc Natl Acad Sci U S A. 2009;106:4483–4488. doi: 10.1073/pnas.0813213106. [DOI] [PMC free article] [PubMed] [Google Scholar]
- Frank T, Rutherford MA, Strenzke N, Neef A, Pangršič T, Khimich D, Fejtova A, Fetjova A, Gundelfinger ED, Liberman MC, Harke B, Bryan KE, Lee A, Egner A, Riedel D, Moser T. Bassoon and the synaptic ribbon organize Ca2+ channels and vesicles to add release sites and promote refilling. Neuron. 2010;68:724–738. doi: 10.1016/j.neuron.2010.10.027. [DOI] [PMC free article] [PubMed] [Google Scholar]
- Glowatzki E, Fuchs PA. Transmitter release at the hair cell ribbon synapse. Nat Neurosci. 2002;5:147–154. doi: 10.1038/nn796. [DOI] [PubMed] [Google Scholar]
- Grant L, Yi E, Glowatzki E. Two modes of release shape the postsynaptic response at the inner hair cell ribbon synapse. J Neurosci. 2010;30:4210–4220. doi: 10.1523/JNEUROSCI.4439-09.2010. [DOI] [PMC free article] [PubMed] [Google Scholar]
- Gustafsson MG. Surpassing the lateral resolution limit by a factor of two using structured illumination microscopy. J Microsc. 2000;198:82–87. doi: 10.1046/j.1365-2818.2000.00710.x. [DOI] [PubMed] [Google Scholar]
- Hull C, Studholme K, Yazulla S, von Gersdorff H. Diurnal changes in exocytosis and the number of synaptic ribbons at active zones of an ON-type bipolar cell terminal. J Neurophysiol. 2006;96:2025–2033. doi: 10.1152/jn.00364.2006. [DOI] [PMC free article] [PubMed] [Google Scholar]
- Khimich D, Nouvian R, Pujol R, Tom Dieck S, Egner A, Gundelfinger ED, Moser T. Hair cell synaptic ribbons are essential for synchronous auditory signalling. Nature. 2005;434:889–894. doi: 10.1038/nature03418. [DOI] [PubMed] [Google Scholar]
- Kindt KS, Finch G, Nicolson T. Kinocilia mediate mechanosensitivity in developing zebrafish hair cells. Dev Cell. 2012;23:329–341. doi: 10.1016/j.devcel.2012.05.022. [DOI] [PMC free article] [PubMed] [Google Scholar]
- Lenzi D, Crum J, Ellisman MH, Roberts WM. Depolarization redistributes synaptic membrane and creates a gradient of vesicles on the synaptic body at a ribbon synapse. Neuron. 2002;36:649–659. doi: 10.1016/s0896-6273(02)01025-5. [DOI] [PubMed] [Google Scholar]
- Li GL, Keen E, Andor-Ardó D, Hudspeth AJ, von Gersdorff H. The unitary event underlying multiquantal EPSCs at a hair cell's ribbon synapse. J Neurosci. 2009;29:7558–7568. doi: 10.1523/JNEUROSCI.0514-09.2009. [DOI] [PMC free article] [PubMed] [Google Scholar]
- Liberman LD, Wang H, Liberman MC. Opposing gradients of ribbon size and AMPA receptor expression underlie sensitivity differences among cochlear-nerve/hair-cell synapses. J Neurosci. 2011;31:801–808. doi: 10.1523/JNEUROSCI.3389-10.2011. [DOI] [PMC free article] [PubMed] [Google Scholar]
- Magupalli VG, Schwarz K, Alpadi K, Natarajan S, Seigel GM, Schmitz F. Multiple RIBEYE-RIBEYE interactions create a dynamic scaffold for the formation of synaptic ribbons. J Neurosci. 2008;28:7954–7967. doi: 10.1523/JNEUROSCI.1964-08.2008. [DOI] [PMC free article] [PubMed] [Google Scholar]
- Martinez-Dunst C, Michaels RL, Fuchs PA. Release sites and calcium channels in hair cells of the chick's cochlea. J Neurosci. 1997;17:9133–9144. doi: 10.1523/JNEUROSCI.17-23-09133.1997. [DOI] [PMC free article] [PubMed] [Google Scholar]
- Meyer AC, Frank T, Khimich D, Hoch G, Riedel D, Chapochnikov NM, Yarin YM, Harke B, Hell SW, Egner A, Moser T. Tuning of synapse number, structure and function in the cochlea. Nat Neurosci. 2009;12:444–453. doi: 10.1038/nn.2293. [DOI] [PubMed] [Google Scholar]
- Murakami SL, Cunningham LL, Werner LA, Bauer E, Pujol R, Raible DW, Rubel EW. Developmental differences in susceptibility to neomycin-induced hair cell death in the lateral line neuromasts of zebrafish (Danio rerio) Hear Res. 2003;186:47–56. doi: 10.1016/s0378-5955(03)00259-4. [DOI] [PubMed] [Google Scholar]
- Nemzou N, RM, Bulankina AV, Khimich D, Giese A, Moser T. Synaptic organization in cochlear inner hair cells deficient for the CaV1.3 (alpha1D) subunit of L-type Ca2+ channels. Neuroscience. 2006;141:1849–1860. doi: 10.1016/j.neuroscience.2006.05.057. [DOI] [PubMed] [Google Scholar]
- Nishimune H, Sanes JR, Carlson SS. A synaptic laminin-calcium channel interaction organizes active zones in motor nerve terminals. Nature. 2004;432:580–587. doi: 10.1038/nature03112. [DOI] [PubMed] [Google Scholar]
- Obholzer N, Wolfson S, Trapani JG, Mo W, Nechiporuk A, Busch-Nentwich E, Seiler C, Sidi S, Söllner C, Duncan RN, Boehland A, Nicolson T. Vesicular glutamate transporter 3 is required for synaptic transmission in zebrafish hair cells. J Neurosci. 2008;28:2110–2118. doi: 10.1523/JNEUROSCI.5230-07.2008. [DOI] [PMC free article] [PubMed] [Google Scholar]
- Platzer J, Engel J, Schrott-Fischer A, Stephan K, Bova S, Chen H, Zheng H, Striessnig J. Congenital deafness and sinoatrial node dysfunction in mice lacking class D L-type Ca2+ channels. Cell. 2000;102:89–97. doi: 10.1016/s0092-8674(00)00013-1. [DOI] [PubMed] [Google Scholar]
- Regus-Leidig H, Specht D, Tom Dieck S, Brandstätter JH. Stability of active zone components at the photoreceptor ribbon complex. Mol Vis. 2010;16:2690–2700. [PMC free article] [PubMed] [Google Scholar]
- Ruel J, Emery S, Nouvian R, Bersot T, Amilhon B, Van Rybroek JM, Rebillard G, Lenoir M, Eybalin M, Delprat B, Sivakumaran TA, Giros B, El Mestikawy S, Moser T, Smith RJ, Lesperance MM, Puel JL. Impairment of SLC17A8 encoding vesicular glutamate transporter-3, VGLUT3, underlies nonsyndromic deafness DFNA25 and inner hair cell dysfunction in null mice. Am J Hum Genet. 2008;83:278–292. doi: 10.1016/j.ajhg.2008.07.008. [DOI] [PMC free article] [PubMed] [Google Scholar]
- Santos F, MacDonald G, Rubel EW, Raible DW. Lateral line hair cell maturation is a determinant of aminoglycoside susceptibility in zebrafish (Danio rerio) Hear Res. 2006;213:25–33. doi: 10.1016/j.heares.2005.12.009. [DOI] [PubMed] [Google Scholar]
- Schmitz F. The making of synaptic ribbons: how they are built and what they do. Neuroscientist. 2009;15:611–624. doi: 10.1177/1073858409340253. [DOI] [PubMed] [Google Scholar]
- Schmitz F, Königstorfer A, Südhof TC. RIBEYE, a component of synaptic ribbons: a protein's journey through evolution provides insight into synaptic ribbon function. Neuron. 2000;28:857–872. doi: 10.1016/s0896-6273(00)00159-8. [DOI] [PubMed] [Google Scholar]
- Schnee ME, Lawton DM, Furness DN, Benke TA, Ricci AJ. Auditory hair cell-afferent fiber synapses are specialized to operate at their best frequencies. Neuron. 2005;47:243–254. doi: 10.1016/j.neuron.2005.06.004. [DOI] [PubMed] [Google Scholar]
- Sheets L, Trapani JG, Mo W, Obholzer N, Nicolson T. Ribeye is required for presynaptic Ca(V)1.3a channel localization and afferent innervation of sensory hair cells. Development. 2011;138:1309–1319. doi: 10.1242/dev.059451. [DOI] [PMC free article] [PubMed] [Google Scholar]
- Sidi S, Busch-Nentwich E, Friedrich R, Schoenberger U, Nicolson T. gemini encodes a zebrafish L-type calcium channel that localizes at sensory hair cell ribbon synapses. J Neurosci. 2004;24:4213–4223. doi: 10.1523/JNEUROSCI.0223-04.2004. [DOI] [PMC free article] [PubMed] [Google Scholar]
- Snellman J, Mehta B, Babai N, Bartoletti TM, Akmentin W, Francis A, Matthews G, Thoreson W, Zenisek D. Acute destruction of the synaptic ribbon reveals a role for the ribbon in vesicle priming. Nat Neurosci. 2011;14:1135–1141. doi: 10.1038/nn.2870. [DOI] [PMC free article] [PubMed] [Google Scholar]
- Spiwoks-Becker I, Glas M, Lasarzik I, Vollrath L. Mouse photoreceptor synaptic ribbons lose and regain material in response to illumination changes. Eur J Neurosci. 2004;19:1559–1571. doi: 10.1111/j.1460-9568.2004.03198.x. [DOI] [PubMed] [Google Scholar]
- Spiwoks-Becker I, Maus C, tom Dieck S, Fejtová A, Engel L, Wolloscheck T, Wolfrum U, Vollrath L, Spessert R. Active zone proteins are dynamically associated with synaptic ribbons in rat pinealocytes. Cell Tissue Res. 2008;333:185–195. doi: 10.1007/s00441-008-0627-3. [DOI] [PMC free article] [PubMed] [Google Scholar]
- Trapani JG, Nicolson T. Mechanism of spontaneous activity in afferent neurons of the zebrafish lateral-line organ. J Neurosci. 2011;31:1614–1623. doi: 10.1523/JNEUROSCI.3369-10.2011. [DOI] [PMC free article] [PubMed] [Google Scholar]
- Vollrath L, Spiwoks-Becker I. Plasticity of retinal ribbon synapses. Microsc Res Tech. 1996;35:472–487. doi: 10.1002/(SICI)1097-0029(19961215)35:6<472::AID-JEMT6>3.0.CO;2-K. [DOI] [PubMed] [Google Scholar]
- Wan L, Almers W, Chen W. Two ribeye genes in teleosts: the role of Ribeye in ribbon formation and bipolar cell development. J Neurosci. 2005;25:941–949. doi: 10.1523/JNEUROSCI.4657-04.2005. [DOI] [PMC free article] [PubMed] [Google Scholar]
- Westerfield M. Eugene, OR: University of Oregon; 1993. The zebrafish book: a guide for the laboratory use of zebrafish (Brachydanio rerio) [Google Scholar]