

Abstract
Hoxa9 is expressed in hematopoietic stem and progenitor cells although this expression is usually diminished as these cells undergo differentiation. In addition, aberrant expression of Hoxa9 is strongly associated with both T-cell and myeloid leukemia in mice and humans. Despite this strong association, enforced expression of Hoxa9 in murine bone marrow or thymus has only shown a modest ability to transform cells. To investigate this question, we used Vav regulatory elements to generate a transgenic mouse that targets Hoxa9 overexpression to all hematopoietic tissues. High level expression of the Hoxa9 transgene in the hematopoietic compartment was associated with embryonic lethality, as no pups from founders that expressed high levels of the transgene were born live. However, offspring of an additional founder line, which expressed lower levels of Hoxa9, developed a precursor T cell lymphoblastic leukemia/lymphoma (pre-T LBL), accompanied by spontaneous Notch1 mutations. In contrast to most murine models of leukemia associated with Hoxa9 overexpression, the Vav-Hoxa9 mice did not overexpress other Hoxa cluster genes, mir196b (a microRNA which is embedded in the Hoxa locus), Meis1, or Pbx3. The Hoxa9 transgenic mouse reported here provides a suitable system for the study of Hoxa9 collaborators that drive myeloid and lymphoid malignant transformation.
Keywords: Hoxa9, pre-T LBL, embryonic lethal, Notch1
Introduction
The clustered homeobox (HOX) genes encode a family of evolutionarily conserved transcription factors that are required for assigning segment identity during embryonic development [1, 2]. The Hox genes are organized into four clusters (A–D) which contain up to 11 genes each. A subset of Hox genes, including Hoxa9, are expressed in hematopoietic stem and progenitor cells (HSPCs); this expression is typically extinguished as these cells differentiate and mature [3–6]. Experiments with Hoxa9-deficient mice have implicated Hoxa9 in HSC self-renewal and in lympho- and myelo-poiesis, as disruption of this gene impairs normal hematopoietic proliferation and repopulation [7, 8].
A role for Hoxa9 in the development of acute myeloid leukemia (AML) was initially recognized in mice. Using retroviral insertional mutagenesis, Hoxa9, along with Meis1, which encodes a homeodomain protein that binds Hoxa9 [9], were identified as common retroviral insertion sties in mice that developed AML [10]. Subsequently, clinical studies showed that a NUP98-HOXA9 fusion protein was expressed as a result of a t(7;11) translocation that is present in a subset of AML patients [11]. In addition, several studies have noted that HOXA9 is overexpressed in about half of all AML patients, and is correlated with poor prognosis [11, 12]. Finally, it has recently been demonstrated that several classes of leukemogenic fusion genes, including those involving the MLL [13] and NUP98 genes [14], as well as the CALM-AF10 fusion [15], lead to over-expression of HOXA9, that is often, but not invariably, accompanied by overexpression of MEIS1.
In addition to myeloid diseases, HOXA9 expression is also involved in a subset of lymphoid malignancies, most prominently precursor T-cell lymphoblastic leukemia/lymphoma (pre-T LBL). HOXA9, along with MEIS1, is overexpressed as a target gene in pre-T LBL samples bearing MLL translocations [16–18]. Similarly, HOXA9 and MEIS1 are overexpressed in patients with pre-T LBL and a CALM-AF10 fusion [19] and the HOXA cluster is deregulated in patients that have a chromosome translocation involving the HOXA locus [20]. In addition, NUP98-HOXD13 (NHD13) and NUP98-PHF23 transgenic mice that develop pre-T LBL also overexpress Hoxa9 [21, 22].
Given the strong correlation between Hoxa9 overexpression and malignant transformation, it is somewhat surprising that mice that overexpress Hoxa9 demonstrate only a modest predisposition to AML. Bone marrow transduction experiments that used retroviral constructs to overexpress Hoxa9, showed that overexpression of Hoxa9 alone was only weakly transforming, and that Hoxa9 cofactors E2a-Pbx1a or Meis1a were needed to accelerate the onset of AML [9, 23]. An impact on hematopoiesis was noted however, in that transplantation of bone marrow transduced with a Hoxa9 construct resulted in increased myelopoiesis and decreased B cell lymphopoiesis [24]. Transgenic mice that expressed Hoxa9 targeted to B and T lymphocytes through the use of the T cell receptor (TCR) Vβ promoter and an immunoglobulin enhancer did not develop hematologic malignancy over an 18 month observation period [24]. It is not clear why the transforming ability of Hoxa9 in these assays was modest. One possibility is that the in vitro culture of bone marrow during the transduction procedure may have selected against transformed cells, which died prior to transplantation. However, this possibility would not explain an absence of leukemia after targeting expression of Hoxa9 to T lymphocytes in transgenic mice.
Because of the strong correlation between HOXA9 expression and both AML and pre-T LBL, but a lack of acute malignancy observed in mouse models that overexpress Hoxa9, we sought to further investigate the role of this gene in mice. Using Vav regulatory elements, we generated a transgenic mouse that targets Hoxa9 overexpression to all hematopoietic tissues. This study reveals that Hoxa9 overexpression in mice leads to pre-T LBL that is accompanied by mutations in Notch1 and a lack of overexpression of other Hoxa genes, making this an attractive system for the study of Hoxa9 collaborators that drive malignant transformation.
Materials and Methods
Transgenic mice
To establish targeted expression in hematopoietic tissues, a murine Hoxa9 cDNA was generated by RT-PCR using primers designated “Hoxa9 cDNA generation” and listed in Table S1, corresponding to nucleotides 1189-2272 of NM_010456, plus 821 additional nucleotides of Hoxa9 3′UTR from BC055059. The resultant Hoxa9 cDNA was completely sequenced to verify the absence of PCR errors, and inserted into the HS 21/45-vav vector which contains 3′ and 5′ Vav regulatory elements [25] (Figure 1A), as previously described [26]. The purified Vav-Hoxa9 construct was microinjected into zygotes from C57BL/6 mice. Malignant tumors that developed in the mice were diagnosed using the Bethesda proposal for lymphoid neoplasms in mice classification [27]. Complete blood counts (CBCs) were obtained every 2–4 months using blood collected from the tail vein. All animal studies were approved by the NCI Intramural Animal Care and Use Committee guidelines.
Figure 1. Level of Hoxa9 transgene expression correlates with transmission of the transgene.

A) Schematic of the Vav vector containing the mouse Hoxa9 cDNA sequence. B) Average number of pups born per litter from Hoxa9 (H6, F7, I2, X1) and NHD13 [30] WT × transgenic breeding pairs (left panel) and the percent of those litters that had transgenic pups (right panel); statistics as compared with NHD13 group. N = 3 litters per genotype. C) Timed matings of the F7 founder. The female mate was euthanized and embryos were genotyped at the indicated days post conception. Each bar represents a separate litter. D) TaqMan assays were used to determine Hoxa9 expression of mouse tissues from the I2, X1 and F7 lines. Assays were performed in triplicate, normalized to the 18S rRNA, and calibrated to WT BM. E) Hoxa9 transgene expression in hematopoietic tissues from the X1 line. Upper band (368bp)-contaminating genomic DNA or unspliced mRNA and lower band (271bp)- spliced (indicated with arrowhead) product without the SV40 intron. Actb was used as a loading control (bottom panel). BM, bone marrow; S, spleen; T, thymus; K, kidney; Li, liver; Lu, lung; w, water. F) Western blot for Hoxa9 (36kDa) with Actin (45kDa) as a loading control. From the far left, (−) WT brain, F7 thymus (T), WT BM and thymus, X1 BM and thymus. *p ≤ 0.05, **p ≤ 0.01, ***p ≤ 0.005.
Flow cytometry, immunohistochemistry, and immunoblots
Single cell suspensions of 1 × 10⁶ cells were prepared in Hank’s Balanced Salt Solution supplemented with 2% fetal bovine serum (HF2) and incubated with antibodies to B220 (RA3-6B2, BD Pharmigen, BD, San Jose, CA USA), CD3 (145-2C11, eBioscience, eB, San Diego, CA, USA), CD4 (GK1.5, BD), CD8 (52-6.7, BD), CD25 (3C7, BD), CD44 (IM7, BD), CD71 (R17217, eB), c-Kit (2B8, BD), Gr-1 (RB 6-8C5, BD), Mac1 (M1/70, eB), Sca-1 (D7, BD), StemSep Mouse Hematopoietic Progenitor Cell Enrichment Cocktail-biotin (Stem Cell Technologies, Vancouver, BC, Canada), and Ter-119 (TER-119, BD) that were conjugated to FITC, PE or APC for 30 min on ice, washed with PBS, resuspended in 1μg/ml propidium iodide to assess viability, and analyzed on a FACScan (BD). Formalin-fixed, paraffin-embedded sections were stained with hematoxylin and eosin (H&E), CD3 (MCA1477, AbD Serotec, Raleigh, NC, USA), or B220 (553086, BD). For immunoblots, 40μg of whole protein extract (RIPA lysis buffer, Santa Cruz Biotechnology, Santa Cruz, CA, USA) were separated on a 10% Tris-glycine gel (Life Technologies, Grand Island, NY, USA) and transferred to 0.2μm PVDF membrane (Millipore). The membrane was blocked with 5% non-fat dry milk in PBS-Tween-20 (0.05%), incubated with primary [Hoxa9 (Millipore 07-178, Billerica, MA, USA) or beta-Actin (Cell Signaling 4967, Danvers, MA, USA)], and secondary antibodies and then with ECL substrate (Pierce, Rockford, IL, USA) before exposure to film.
Gene expression assays
Total RNA was isolated using TRIzol (Invitrogen, Grand Island, NY, USA) reagents and protocols. First strand cDNA for reverse transcriptase polymerase chain reaction (RT-PCR) and real time quantitative PCR (RQ-PCR) was generated from 1 ug of total RNA using SuperScript III (Invitrogen) reagents and protocols. Expression of the Hoxa9 transgene was confirmed by conventional RT-PCR (see Table S1 for primers). Quantitative expression of Hoxa5 (Mm00439362_m1) Hoxa7 (Mm00657963_m1) Hoxa9 (Mm00439364_m1), Hoxa10 (Mm00433966_m1), Meis1 (Mm00487664_m1), and Pbx3 (Mm00479413_m1) was measured using TaqMan primer-probe sets and the 7500 Fast Real-time PCR System (Applied Biosystems, Carlsbad, CA, USA). For Hoxa9 TaqMan assays, the RNA was DNase-treated with a DNA-free kit (Ambion/Life Technologies, Grand Island, NY, USA). Samples were normalized to 18S rRNA endogenous control (4308329) and calibrated to a wild type tissue unless otherwise indicated. TaqMan microRNA assays (Applied Biosystems) were used to assess miR-196b (121219) expression. cDNA was transcribed from 10ng RNA using the TaqMan MicroRNA Reverse Transcription Kit (Applied Biosystems) and U6 snRNA (001973) was used as an endogenous control.
OP9-DL1 co-culture
The CD4−CD8− subset of thymocytes was isolated by negative selection from the whole thymus using biotinylated antibodies (BD Biosciences) and anti-biotin microbeads with LS columns (Miltenyi Biotec, Auburn, CA, USA). 1 × 10⁵ double negative thymocytes were plated onto an OP9-DL1 monolayer and cultured in αMEM media with 20% FBS, 5ng/ml Flt3L and 1ng/ml IL7 (PeproTech, Rocky Hill, NJ, USA). Cultures were fed every 2 days and passaged every 4 days as previously reported [28].
Myeloid CFC culture
Bone marrow was harvested from mouse femorae and tibiae by flushing the bones with HF2 and plating 3 × 10⁴ cells per 35mm dish in MethoCult M3231 (StemCell Technologies) supplemented with 100ng/ml GM-CSF, 10ng/ml IL3, 10ng/ml IL6, and 20ng/ml SCF (PeproTech). Colonies were counted and replated every 7 days at 1 × 10⁴ cells per plate.
Meis1 transduction of bone marrow
Lineage negative (Lin-) cells were isolated from bone marrow using the StemSep Mouse Hematopoietic Progenitor Cell Enrichment Kit (StemCell Technologies) and used as target cells. Lin- cells were prestimulated in vitro for 2 days at 37°C in IMDM with 15% FBS and 6ng/ml mIL3, 10ng/ml hIL6 and 100ng/ml mSCF (PeproTech) until infection. To generate retroviral stocks, Phoenix-Eco cells were transfected using calcium phosphate precipitation with the Meis1/MIYR (MSCV-IRES-YFP-Retrovirus) or control (MIYR) vector plasmids as described in Pineault et al [29]. Virus-containing media was collected 48–72 hrs post transfection and used to infect Lin- bone marrow cells 3 times at 12 hr intervals. Two days following the first infection, infected Lin- bone marrow was harvested and plated in Methocult media (M3231, Stemcell Technologies) supplemented with mSCF (20ng/mL), hIL-6 (10ng/mL), mGM-CSF (10ng/mL) and mIL-3 (10ng/mL) for colony forming cell (CFC) assays. To evaluate the self renewal activity of the transduced cells, CFC cells were harvested and re-plated in M3231 supplemented with the same cytokine cocktail. Colonies were counted and the immunophenotype of the CFC were determined by FACS every 7 days after re-plating (5 × 10³ or 1 × 10⁴ cells per 35mm dish were re-plated each time).
Tcrb gene rearrangements and candidate gene resequencing
The Tcrb region was amplified from cDNA with using a constant (C) region primer and a degenerate variable (V) region primer (Table S1) and previously reported cycling parameters [21]. PCR products were gel purified (Qiagen, Valencia, CA, USA), subcloned into a pGEM T-easy vector (Promega, Madison, WI, USA), and transformed into competent DH5α E. coli. Plasmid DNA was isolated using Qiagen reagents and protocols and sequenced with an ABI 3130 Genetic Analyzer. The sequences were compared to reference mouse Tcrb genomic sequences (GenBank ID MMAE00063.1, MMAE00064.1, MMAE00065.1); V, D (diversity), J (joining) and “N” (non-templated) region nucleotides were identified to determine clonality. Notch1, Bcl11b, Fbxw7, and Pten were examined for mutations using the primers listed in Table S1. Notch1 sequences were compared with GenBank AL732541.11. Genomic DNA was used as a sequencing template for all genes except Pten when a cDNA template was used.
Statistical analysis
The Student’s t test was used to determine statistical significance unless stated otherwise.
Results
Enforced expression of Hoxa9 leads to perinatal death in mice
Following pronuclear injection and implantation into pseudopregnant mothers, potential Hoxa9 founders were identified by Southern blotting, and bred with WT mice. Four independent lines (H6, I2, F7 and X1) were studied. Surprisingly, the F7 and H6 founders did not transmit the transgene despite delivering 3 litters each, containing a combined total of 16 and 15 pups, respectively. Litters from the H6 and F7 lines were smaller than those from either the X1 line or from an independent line of mice that was also generated using the Vav vector backbone (NHD13; Figure 1B left panel) [30]. Furthermore, the pups from the H6 and F7 litters were all negative for the Hoxa9 transgene, whereas the X1 and I2 lines did transmit the transgene to offspring, suggesting that the Hoxa9 transgene was embryonic lethal in the H6 and F7 lines (Figure 1B, right panel). The H6 and F7 founders (males) were bred with WT female mice, and the pregnant mice were euthanized. Although H6 did not produce any additional litters during these timed matings, three timed matings from the F7 founder were analyzed. Between days E8 and E9.5, 38% and 18% of the litters, respectively, were positive for the Hoxa9 transgene, however, none of seven mice analyzed at E16 were positive for the transgene, consistent with the hypothesis that expression of the Hoxa9 transgene resulted in embryonic lethality (Figure 1C).
Despite the observation that transmission of the Hoxa9 transgene was associated with embryonic lethality in offspring of the F7 and H6 founders, the I2 and X1 founders did successfully transmit the transgene to viable pups. In order to determine if there was a correlation between expression level of Hoxa9 and the ability of the founders to transmit the transgene, expression of the Hoxa9 transgene was assessed by RQ-PCR. Interestingly, Hoxa9 expression level for the F7 founder was the highest among the lines assayed, and at least 24 times higher than that of the X1 line, indicating that higher levels of Hoxa9 expression was associated with embryonic lethality (Figure 1D).
Expression of Hoxa9 in hematopoietic tissues (bone marrow (BM), spleen and thymus) in offspring of the X1 line was confirmed by the presence of a 271bp Hoxa9 band, indicating that a splicing event took place to remove the SV40 intron (Figure 1E, arrowhead). Western blot analysis demonstrated clear expression of the Hoxa9 protein in the F7 thymus, lesser expression in the X1 thymus, and no expression in the WT thymus, WT BM, or X1 BM (Figure 1F). These levels of Hoxa9 protein expression were entirely consistent with the Hoxa9 mRNA expression shown in Figure 1D, in which the ratio of F7 thymus: X1 thymus: X1 BM was 330: 9: 1 (Figure 1D and 1F).
Hematologic characterization of tissues from Hoxa9 transgenic mice
Complete blood counts (CBC) were monitored over 10 months for indications of malignant transformation in the I2 and X1 lines, however, these offspring were healthy and had normal CBCs (Supplemental Figure S1A). Although the I2 line transmitted the transgene, the level of expression was lowest of the lines studied (Figure 1D) and offspring from this line did not demonstrate any clinical signs of illness during the 18 month observation period. Therefore, we focused our subsequent studies on the X1 line. Immunophenotypic analysis of peripheral blood and spleen showed no differences in granulocyte, CD4+ T, CD8+ T, or B lymphoctes between the Hoxa9 (X1 line) and WT mice (Supplemental Figure S1B–C). To determine whether any differences in precursor cell populations could be identified, we assayed thymocyte subsets and BM cells, and again detected no differences between the Hoxa9 and WT mice (Supplemental Figure S1D–E).
Hoxa9 has been implicated in the regulation of granulocyte-macrophage progenitor proliferation [8], and retroviral transduction of a Hoxa9 cDNA has been reported to immortalize hematopoietic precursors in vitro [31–33]. To investigate the possibility that Hoxa9 overexpression from the X1 BM would result in increased colony formation and re-plating ability in vitro, whole BM was cultured in methylcellulose media under conditions to promote myeloid colony growth. In 2 of 3 independent experiments, the Hoxa9 bone marrow re-plated one more time than the WT BM; however, these cells were mast cells as defined by expression of CD16 and c-Kit (Supplemental Figure S2 and data not shown). These observations demonstrated that expression of the Hoxa9 transgene, driven by Vav regulatory elements, did not increase the re-plating potential in this assay.
Hoxa9 mice develop pre-T LBL
The X1 mice were observed over a period of 18 months along with age-matched WT littermates. During that time, 4 of 18 (22%) mice in the Hoxa9 group developed a T cell malignancy with the initial signs of illness characterized by hunched posture and weight loss (Figure 2A). These findings were statistically significant and the malignancies were classified as pre-T LBL according to the Bethesda protocols for lymphoid leukemia in mice [27]. The mean age of death among the 4 mice with pre-T LBL was 13.4 months and all exhibited clonal Tcrb gene rearrangements (Tables 1 and 2). The disease presentation varied; mouse 1077 had pleural effusion, thymoma and a CD4 single positive clonal population, whereas 1118 and 1138 had hepatosplenomegaly and lymphadenopathy but no pleural effusion (Table 1). Mouse 1125 had a thymoma and an expansion of single positive CD8 cells (Table 1). Common to all of these mice were heavily-infiltrated areas of the lung, often perivascular as revealed with immunohistochemistry for CD3 (Figure 2B). Of the mice that presented with thymomas, 1077 and 1125 demonstrated a sheet of monomorphic cells in the thymus with no demarcation between cortex and medulla (Figure 2B). Hoxa9 protein in these tumors was expressed at high levels (Figure 2C). The bone marrow from mice 1118 and 1138 was infiltrated with CD3 positive T cells, with the BM of mouse 1118 being more heavily infiltrated than that of 1138.
Figure 2. Overexpression of Hoxa9 results in increased incidence of pre-T LBL in mice.

A) A cohort of X1 mice were monitored for disease development over the course of an 18-month period. WT, N = 18 and Hoxa9, N = 18. Statistics determined by Log-rank Test. B) H&E staining and immunohistochemistry for CD3. Scale bar indicates 200μm. C) Western blot for Hoxa9 (36kDa) with Actin (45kDa) as a loading control. From the far left, WT BM and thymus, 1–1077 thymus and 2–1125 thymus.
Table 1.
Mice from the X1 line with pre-T LBL.
| ID | Sex | Age | Gross Findings | IHC Findings | Infiltration (H&E) | CD3 | B220 | FACS |
|---|---|---|---|---|---|---|---|---|
| 1077 | F | 15 | PE, S, T | liver | ++ | ++ | ND | thymus |
| spleen | +++ | +++ | 73% CD4+ | |||||
| kidney | ++ | ++ | ||||||
| lung | +++ | +++ | ||||||
| thymus | ++ | +++ | ||||||
| bone | + | + | ||||||
|
| ||||||||
| 1118 | F | 13.5 | H, L, S | liver | +++ | +++ | ++ | LN |
| spleen | +++ | +++ | + | 68% CD3+B220+ | ||||
| kidney | + | + | − | |||||
| lung | ++ | ++ | + | |||||
| LN | +++ | ++ | ++ | |||||
| bone | ++ | ++ | + | |||||
|
| ||||||||
| 1138 | M | 10 | H, L, S, K | liver | +++ | faint staining | ND | spleen |
| spleen | +++ | across | 58% CD4+8+ | |||||
| kidney | ++ | all | ||||||
| lung | ++ | tissues | ||||||
| bone | +++ | examined | ||||||
|
| ||||||||
| 1125 | F | 15 | T | liver | − | − | ND | thymus |
| spleen | − | ++ | 61% CD8+ | |||||
| kidney | − | − | ||||||
| lung | ++ | ++ | ||||||
| thymus | +++ | +++ | ||||||
| bone | + | + | ||||||
H, hepatomegaly; K, enlarged/pale kidneys; L, lymphadenopathy; PE, pleural effusion; S, splenomegaly; T, thymoma, ND, not determined
Table 2.
Clonal Tcrb gene rearrangements in tumors from Hoxa9 mice.
| Subclone | V segment | V | N | D | N | J | J segment |
|---|---|---|---|---|---|---|---|
| 1138spl-4 | V11S1 | TGCAAGCAGCTTAga* | ATCT | GGGGC | GCT | AGTCAAAACACCTTG | J2S4 |
| 1138spl-5 | V11S1 | TGCAAGCAGCTTAga | ATCT | GGGGC | GCT | AGTCAAAACACCTTG | J2S4 |
| 1138spl-6 | V11S1 | TGCAAGCAGCTTAga | ATCT | GGGGC | GCT | AGTCAAAACACCTTG | J2S4 |
| 1138spl-7 | V11S1 | TGCAAGCAGCTTAga | ATCT | GGGGC | GCT | AGTCAAAACACCTTG | J2S4 |
| 1138spl-10 | V11S1 | TGCAAGCAGCTTAga | ATCT | GGGGC | GCT | AGTCAAAACACCTTG | J2S4 |
| 1077thy-4 | V6S1 | GTGCCAGCAGTATAg | AGGGTA | GGGA | ctCCTATGAACAAGT | J2S7 | |
| 1077thy-7 | V6S1 | GTGCCAGCAGTATAg | AGGGTA | GGGA | ctCCTATGAACAAGT | J2S7 | |
| 1077thy-3 | V6S1 | GTGCCAGCAGTATAg | AGGGTA | GGGA | ctCCTATGAACAAGT | J2S7 | |
| 1077thy-5 | V6S1 | GTGCCAGCAGTATAg | AGGGTA | GGGA | ctCCTATGAACAAGT | J2S7 | |
| 1077thy-10 | V6S1 | GTGCCAGCAGTATAg | AGGGTA | GGGA | ctCCTATGAACAAGT | J2S7 | |
| 1118LN-1 | V6S1 | GTGCCAGCAGTatag | CCA | GGACAGGGG | TA | TTCTGGAAAATACGC | J1S3 |
| 1118LN-2 | V8S2 | GTGCCAGCGGTGAtg | AG | ctcctATGAACAGTA | J2S7 | ||
| 1118LN-3 | V2S1 | CACCTGCAGTGcaga | GACA | GGGA | GGG | ctcctatGAACAGTA | J2S7 |
| 1118LN-9 | V8S2 | GTGCCAGCGGTGAtg | AG | ctcctATGAACAGTA | J2S7 | ||
| 1118LN-10 | V8S3 | GTGCCAGCAgtgatg | CC | GGACTGGGGGGGC | GC | agtGCAGAAACGCTG | J2S3 |
| 1118LN-11 | V8S2 | GTGCCAGCGGTGAtg | GG | ctccTATGAACAGTA | J2S7 | ||
| 1118LN-12 | V8S2 | GTGCCAGCGGTGAtg | AG | ctcctATGAACAGTA | J2S7 | ||
| 1118LN-13 | V2S1 | CACCTGCAGTGCAGa | TCC | GGGACAGGG | TGG | ttcctataATTCGCC | J1S6 |
| 1118LN-14 | V6S1 | GTGCCAGCAGTAtag | GC | GACTGGGGGGGG | ctccTATGAACAGTA | J2S7 | |
| 1118LN-15 | V8S2 | GTGCCAGCGGTGAtg | AG | ctcctATGAACAGTA | J2S7 | ||
| 1125thy-1 | V6S1 | GTGCCAGCAGTATAG | A | GGGA | GG | cAAACACCGGGCAGC | J2S2 |
| 1125thy-2 | V6S1 | GTGCCAGCAGTATAG | A | GGGA | GG | cAAACACCGGGCAGC | J2S2 |
| 1125thy-5 | V6S1 | GTGCCAGCAGTATAG | A | GGGA | GG | cAAACACCGGGCAGC | J2S2 |
| 1125thy-6 | V6S1 | GTGCCAGCAGTATAG | A | GGGA | GG | cAAACACCGGGCAGC | J2S2 |
| 1125thy-8 | V6S1 | GTGCCAGCAGTATAG | A | GGGA | GG | cAAACACCGGGCAGC | J2S2 |
Due to the latency period prior to disease presentation, we hypothesized that there may be collaborative mutations in the pre-T LBL tumors that contribute to malignant transformation. Therefore, these tumors were assessed for Notch1, Bcl11b, Fbxw7, and Pten mutations as these are commonly associated with T cell leukemias. All 4 tumors had a mutation in either the heterodimerization or PEST domains of Notch1, consistent with the diagnosis of pre-T LBL (Table 3). Additionally, mouse 1138 had a Pten mutation that resulted in a hydrophobic amino acid substitution for a hydrophilic amino acid (Table 3).
Table 3.
Targeted gene re-sequencing in tumors from Hoxa9 mice.
| Sample ID | Tissue | Notch1 5′ del mutation | Notch1 HD Exon 26 | Notch1 HD Exon 27 | Notch1 JM Exon 28 | Notch1 PEST domain Exon 34 | Fbxw7 Exon 8 | Fbxw7 Exon 9 | Bcl11b del mutation | Pten (RT-PCR) |
|---|---|---|---|---|---|---|---|---|---|---|
| 1077 | Thy | GL | GL | GL | GL | 66353CC > TTTG | GL | GL | GL | GL |
| 1118 | Sp | GL | GL | 59855AAGA > TAAG (Lys-Ser > STOP-Gly) | GL | 66336C > GG | GL | GL | GL | GL |
| 1125 | Thy | P | GL | GL | GL | 66282CT > GCG | GL | GL | GL | GL |
| 1138 | Sp | GL | GL | 59724T > C(Leu > Pro) | GL | GL | GL | GL | GL | 388C > T, Arg > Trp |
Sp: spleen, Thy: thymus
HD: heterodimerization domain, JM: juxtamembrane domain
PEST: Proline/Glutmaic Acid/Serine/Threonine domain
GL, germline; P, positive for 5′ del mutation
Clinically healthy Hoxa9 mice from the X1 line were assessed for evidence of T cell abnormalities, including clonal Tcrb gene rearrangements and impaired thymocyte differentiation. Mice ranging from 2 to 8 months of age showed no evidence of clonal Tcrb gene rearrangements (Supplemental Table S2). When CD4−CD8− thymocytes were isolated from Hoxa9 transgenic mice and cultured on a layer of OP9-DL1 cells [28], their differentiation was not distinct from that of WT thymocytes (Supplemental Figure S3).
Expression of Hoxa cluster genes in the pre-T LBL samples
A number of genetically engineered mice that express leukemic fusion genes, such as MLL-AF9, CALM-AF10, NUP98-HOXD13, and NUP98-PHF23 [16, 21, 26] (S. Gough and P.D. Aplan, unpublished observations) overexpress genes from the Hoxa cluster in concert, most commonly Hoxa5-11. In addition, mir 196b, located between Hoxa9 and Hoxa10, has been noted to be upregulated in human and murine leukemias associated with Hoxa9 overexpression [34, 35]. In order to determine whether the pre-T LBL tumors demonstrated a global upregulation of the Hoxa cluster genes, expression of Hoxa5-10 and mir196b was assessed. As shown in Figure 3, the Hoxa9 pre-T LBL samples invariably showed an increase in Hoxa9 compared to WT thymus, but did not show an increase of any of the other Hoxa cluster genes or mir196b, with one exception (1138 Hoxa10 expression).
Figure 3. Hoxa9 T cell tumors lack global overexpression of the Hoxa cluster.
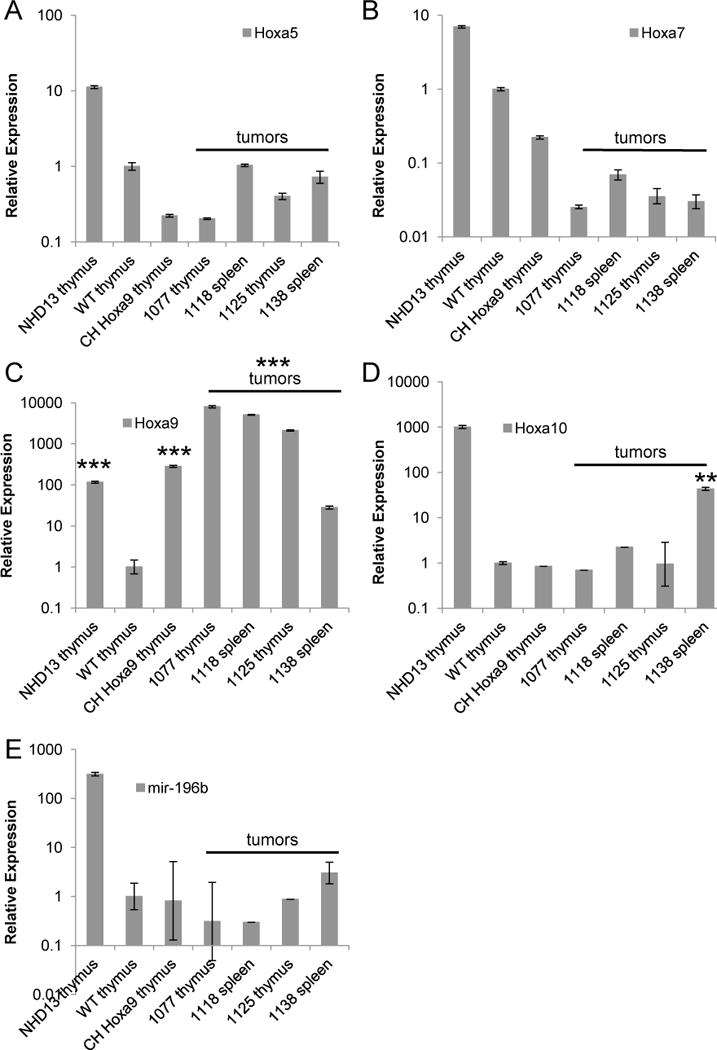
Quantitative RT-PCR for A) Hoxa5, B) Hoxa7, C) Hoxa9, D) Hoxa10, p ≤ 0.01 compared with WT thymus and E) mir-196b. Thymus from a healthy NHD13 mouse was used as a positive control and all samples were calibrated to WT thymus set to 1. CH, clinically healthy. Mice 1077, 1118, 1125 and 1138 were diagnosed with pre-T LBL. **p ≤ 0.01, ***p ≤ 0.005 by Student’s t test.
Role of Meis1 in pre-T LBL and myeloid immortalization
In order to determine the potential involvement of known Hoxa9 cofactors in the pre-T LBL tumors, the expression of Meis1 and Pbx3 was analyzed. Meis1 expression was either similar to or lower than that of WT thymus, suggesting that Meis1 over-expression does not play a crucial role in Hoxa9-induced pre-T LBL (Figure 4A) [9]. Pbx3 overexpression has been associated with myeloid and thymocyte transformation driven by a NUP98-HOXD13 transgene [36, 37]. Tumors 1118 and 1138 expressed modestly elevated levels of Pbx3 compared with the WT control, but the other 2 tumors did not (Figure 4B).
Figure 4. Potential role of Hoxa9 co-factors in leukemic transformation.

Quantitative RT-PCR for A) Meis1 and B) Pbx3. Thymus from a healthy NHD13 mouse was used as a negative control for Meis1 and a positive control for Pbx3. All samples were calibrated to WT thymus set to 1. CH, clinically healthy. Mice 1077, 1118, 1125 and 1138 were mice with pre-T LBL. C) CFC re-plating assay with WT or Hoxa9 Lin- bone marrow transduced with empty vector (MIG) or Meis1. D) FACS analyses of re-plated transduced cells from (C) to assess for transduction efficiency and immunophenotype at 7th re-plating. Inset photomicrograph of Hoxa9 + Meis1 at 7th re-plating stained with May-Giemsa, scale bar = 100μm.
Surprisingly, Hoxa9 mice developed only pre-T LBL and not AML during the 18 month study. In order to determine whether this could be attributed in part to insufficient expression of Meis1, a Hoxa9 binding partner that is often co-expressed in AML samples that express Hoxa9 and has been shown to collaborate with Hoxa9 during leukemic transformation [3, 38], an in vitro immortalization assay was performed [39]. Hoxa9 or WT BM were infected with a Meis1 or control retrovirus, and the cells were subjected to a re-plating assay as previously described [39]. Consistent with our experiments using non-transduced Hoxa9 BM, the Hoxa9 bone marrow transduced with a control vector re-plated only 4 times, whereas the Hoxa9 + Meis1 cells continued to re-plate until the experiment ended following the 7th replating (Figure 4C). The Hoxa9 + Meis1 cells that continued to re-plate displayed morphology and immunophenotype (Mac1+CD16+Gr1−cKit−) that is consistent with a mixed population of monoblasts and macrophages (Figure 4D). The immortalization of the Hoxa9 BM cells by the addition of Meis1 expression suggests that transformation to AML via Hoxa9 overexpression requires an additional co-factor.
Discussion
Overexpression of Hoxa9 has been implicated in both AML and pre-T LBL, both in human patients as well as animal models of leukemia [9–11, 30, 40, 41]. Indeed, several specific recurrent chromosomal rearrangements have been associated with in pre-T LBL in humans, including CALM-AF10, SET-NUP214, MLL-ENL, and TCRB-HOXA9 [42–45]. To further delineate the role of Hoxa9 in malignant transformation, we generated transgenic mice that overexpressed Hoxa9 in hematopoietic tissues through the use of Vav regulatory elements [25]. Unexpectedly, AML was not detected in any of the transgenic mice. Furthermore, although it has previously been reported that overexpression of Hoxa9 is sufficient to immortalize BM myeloid progenitors [31–33], we were unable to replate the Hoxa9 BM more than four times (Fig. S2 and 4), indicating that BM from the Hoxa9 transgenic mice was not immortalized. There are several possible interpretations of this apparent discrepancy. For instance, it may be due to mouse strain differences, the use of similar but not identical cytokine cocktails, or possibly differences in expression levels of Hoxa9 in those experiments compared to the current study. In addition, these previous reports have assessed the Hoxa9 effect by introducing Hoxa9 using retroviral vectors. It is possible that retroviral integrations activated host genes that collaborated with Hoxa9 to allow immortalization. Consistent with this hypothesis, one of these previous reports [31] demonstrated that progenitors immortalized by Hoxa9 were clonal as opposed to polyclonal; if Hoxa9 was sufficient to immortalize the progenitors, then the immortalized culture might be expected to be polyclonal.
A subset of the Hoxa9 mice from the X1 line developed a pre-T LBL that was characterized by clonal Tcrb gene rearrangements, perivascular infiltration of parenchymal tissues, and invasion of the bone marrow and thymus, the latter leading to disruption of the histological architecture that defines the corticomedullary regions (Table 2 and Figure 2B). In addition, all of the Hoxa9 pre-T LBL samples had spontaneously acquired Notch1 mutations, which are commonly associated with pre-T LBL in both mice and humans [46–49] (Table 3). Given that the pre-T LBL only arose in one line, it is possible that a transgene integration effect could have contributed to the pre-T LBL phenotype. However, the observation that the Hoxa9 transgene collaborates with Meis1 to generate an AML-like phenotype (Fig 4) suggests that the X1 integration site did not predispose to a T-cell phenotype. An alternate explanation is that the X1 founder was the only founder that expressed adequate levels of Hoxa9 to predispose to pre-T LBL, as the only other founder that transmitted the transgene (I2) expressed 10.7-fold lower levels of Hoxa9 in the thymus (Fig 1D).
A phenomenon by which Hoxa genes (Hoxa5, Hoxa6, Hoxa7, Hoxa9 and Hoxa10) are upregulated in concert is characteristic of acute leukemias with MLL rearrangements, and has been referred to as the “Hox code” [50]. In addition to leukemias with MLL fusions, Hoxa cluster overexpression, often, but not invariably accompanied by Meis1 overexpression, is seen in patients with other recurrent genetic lesions, including NUP98 fusions, monosomy 7, and CALM-AF10 fusions. The overexpression of Hoxa cluster genes is thought to be a result of the fusion gene driving expression of Hoxa5-10 genes as downstream targets; in some cases, this has been shown to be associated with persistent epigenetic changes, such as persistent H3K4me3 at the Hoxa5-10 cluster [51]. In addition, some MLL and NUP98 fusions also upregulate miR196b [35, 37], and S. Gough unpublished observations), a microRNA located between Hoxa9 and Hoxa10; the role of miR-196b overexpression in AML or pre-T LBL remains unclear. In contrast, although Hoxa9 is reported to positively regulate its own expression, Hoxa9 does not regulate expression of other Hoxa genes [50, 52, 53]; this is the most likely explanation for the lack of Hoxa cluster gene and miR 196b upregulation in the Hoxa9 pre-T LBL samples.
We noted a correlation between the level of Hoxa9 expression, embryonic lethality and incidence of pre-T LBL. Mice from the F7 line expressed the highest level of Hoxa9 (more than 20 times higher than the X1 line) but died in utero between E9.5 and E16, resulting in an absence of transgenic mice in the litters (Figure 1B–D). Mice from the X1 line expressed the next highest level of the transgene; this line developed pre-T LBL (Figure 1D and Figure 2). The I2 line expressed the lowest level of Hoxa9; none of the transgenic mice from this line developed pre-T LBL during the 18 month study (Figure 1D). These observations suggest that there are at least 3 levels of Hoxa9 expression (e.g. high, moderate, low) that may be used to predict compatibility with life and progression to disease. Above a certain threshold (i.e. I2), Hoxa9 mice have the potential to develop leukemia (X1) but overexpression beyond that level interferes with embryonic development resulting in embryonic lethality (F7).
Hoxa9 overexpression was not sufficient to cause AML, consistent with findings from retroviral transduction and transplantation experiments [9, 24]. However, in contrast to the retroviral transduction and transplantation experiments, isolated overexpression of Hoxa9 does predispose mice to develop pre-T LBL. We suspect that the lack of transformation to AML was due to the lack of enforced Meis1 overexpression in the Hoxa9 mice. In the case of MLL fusions, it has been shown that Meis1 is a critical co-factor for transformation to AML, and MLL fusions with the highest levels of Meis1 transformed significantly more rapidly than did MLL fusions which produced lower levels of Meis1 expression [54]. NUP98-HOXD13 transgenic mice overexpress Hoxa cluster genes; however, they have lower expression of Meis1 compared to WT mice [37]. Approximately one-third of the NUP98-HOXD13 mice that transform to AML spontaneously upregulate Meis1 (34), or undergo spontaneous mutations of Ras pathway genes, therefore, we anticipated that some Hoxa9 mice might likewise up-regulate Meis1 or other, undefined complementary genes and transform to AML. However, this was not the case, as we detected no cases of AML despite an observation period of 18 months. Transduction of Hoxa9 bone marrow with Meis1 led to immortalization in a CFC re-plating assay, indicating that Meis1 can complement Hoxa9 in transgenic mice, as has been shown previously in a retroviral transduction and transplantation model [9].
This report demonstrates that overexpression of Hoxa9 alone, in the absence of overexpression of additional Hoxa cluster genes, miR 196b, or Meis1 led to pre-T LBL. The reason for the prolonged latency and modest penetrance is unclear; perhaps the penetrance would be greater if additional Hoxa cluster genes were overexpressed, however, this possibility remains speculative. This Hoxa9 transgenic mouse, unique in its absence of overexpression of other Hoxa cluster genes and Hoxa9 cofactors, may provide a useful tool for the assessment of required complementary cofactors and evaluation of potential therapeutic targets for AML and pre-T LBL.
Acknowledgments
We would like to thank Jerry Adams for the gift of the Vav plasmid, Jan Linkenhoker and Maria Jorge for excellent veterinary care and animal husbandry, and the NCI transgenic and sequencing core facilities. We would also like to thank Chris Slape, Rachel Novak, Sheryl Gough, Zhenhua Zhang and all of the members of the Aplan lab for helpful discussions.
Support and Financial Disclosure Declaration
This research was supported by the Intramural Research Program of the NIH, NCI. The authors declare no competing financial interests.
Footnotes
Publisher's Disclaimer: This is a PDF file of an unedited manuscript that has been accepted for publication. As a service to our customers we are providing this early version of the manuscript. The manuscript will undergo copyediting, typesetting, and review of the resulting proof before it is published in its final citable form. Please note that during the production process errors may be discovered which could affect the content, and all legal disclaimers that apply to the journal pertain.
References
- 1.Argiropoulos B, Humphries RK. Hox genes in hematopoiesis and leukemogenesis. Oncogene. 2007;26:6766–6776. doi: 10.1038/sj.onc.1210760. [DOI] [PubMed] [Google Scholar]
- 2.Gehring WJ, Muller M, Affolter M, et al. The structure of the homeodomain and its functional implications. Trends Genet. 1990;6:323–329. doi: 10.1016/0168-9525(90)90253-3. [DOI] [PubMed] [Google Scholar]
- 3.Kawagoe H, Humphries RK, Blair A, Sutherland HJ, Hogge DE. Expression of HOX genes, HOX cofactors, and MLL in phenotypically and functionally defined subpopulations of leukemic and normal human hematopoietic cells. Leukemia. 1999;13:687–698. doi: 10.1038/sj.leu.2401410. [DOI] [PubMed] [Google Scholar]
- 4.Moretti P, Simmons P, Thomas P, et al. Identification of homeobox genes expressed in human haemopoietic progenitor cells. Gene. 1994;144:213–219. doi: 10.1016/0378-1119(94)90380-8. [DOI] [PubMed] [Google Scholar]
- 5.Pineault N, Helgason CD, Lawrence HJ, Humphries RK. Differential expression of Hox, Meis1, and Pbx1 genes in primitive cells throughout murine hematopoietic ontogeny. Exp Hematol. 2002;30:49–57. doi: 10.1016/s0301-472x(01)00757-3. [DOI] [PubMed] [Google Scholar]
- 6.Sauvageau G, Lansdorp PM, Eaves CJ, et al. Differential expression of homeobox genes in functionally distinct CD34+ subpopulations of human bone marrow cells. Proc Natl Acad Sci USA. 1994;91:12223–12227. doi: 10.1073/pnas.91.25.12223. [DOI] [PMC free article] [PubMed] [Google Scholar]
- 7.Lawrence HJ, Christensen J, Fong S, et al. Loss of expression of the Hoxa-9 homeobox gene impairs the proliferation and repopulating ability of hematopoietic stem cells. Blood. 2005;106:3988–3994. doi: 10.1182/blood-2005-05-2003. [DOI] [PMC free article] [PubMed] [Google Scholar]
- 8.Lawrence HJ, Helgason CD, Sauvageau G, et al. Mice bearing a targeted interruption of the homeobox gene HOXA9 have defects in myeloid, erythroid, and lymphoid hematopoiesis. Blood. 1997;89:1922–1930. [PubMed] [Google Scholar]
- 9.Kroon E, Krosl J, Thorsteinsdottir U, Baban S, Buchberg AM, Sauvageau G. Hoxa9 transforms primary bone marrow cells through specific collaboration with Meis1a but not Pbx1b. EMBO J. 1998;17:3714–3725. doi: 10.1093/emboj/17.13.3714. [DOI] [PMC free article] [PubMed] [Google Scholar]
- 10.Nakamura T, Largaespada DA, Shaughnessy JD, Jr, Jenkins NA, Copeland NG. Cooperative activation of Hoxa and Pbx1-related genes in murine myeloid leukaemias. Nat Genet. 1996;12:149–153. doi: 10.1038/ng0296-149. [DOI] [PubMed] [Google Scholar]
- 11.Borrow J, Shearman AM, Stanton VP, Jr, et al. The t(7;11)(p15;p15) translocation in acute myeloid leukaemia fuses the genes for nucleoporin NUP98 and class I homeoprotein HOXA9. Nat Genet. 1996;12:159–167. doi: 10.1038/ng0296-159. [DOI] [PubMed] [Google Scholar]
- 12.Golub TR, Slonim DK, Tamayo P, et al. Molecular classification of cancer: class discovery and class prediction by gene expression monitoring. Science. 1999;286:531–537. doi: 10.1126/science.286.5439.531. [DOI] [PubMed] [Google Scholar]
- 13.Harper DP, Aplan PD. Chromosomal rearrangements leading to MLL gene fusions: clinical and biological aspects. Cancer Res. 2008;68:10024–10027. doi: 10.1158/0008-5472.CAN-08-2208. [DOI] [PMC free article] [PubMed] [Google Scholar]
- 14.Gough SM, Slape CI, Aplan PD. NUP98 gene fusions and hematopoietic malignancies: common themes and new biologic insights. Blood. 2011;118:6247–6257. doi: 10.1182/blood-2011-07-328880. [DOI] [PMC free article] [PubMed] [Google Scholar]
- 15.Caudell D, Aplan PD. The role of CALM-AF10 gene fusion in acute leukemia. Leukemia. 2008;22:678–685. doi: 10.1038/sj.leu.2405074. [DOI] [PMC free article] [PubMed] [Google Scholar]
- 16.Armstrong SA, Staunton JE, Silverman LB, et al. MLL translocations specify a distinct gene expression profile that distinguishes a unique leukemia. Nat Genet. 2002;30:41–47. doi: 10.1038/ng765. [DOI] [PubMed] [Google Scholar]
- 17.Faber J, Krivtsov AV, Stubbs MC, et al. HOXA9 is required for survival in human MLL-rearranged acute leukemias. Blood. 2009;113:2375–2385. doi: 10.1182/blood-2007-09-113597. [DOI] [PMC free article] [PubMed] [Google Scholar]
- 18.Rozovskaia T, Feinstein E, Mor O, et al. Upregulation of Meis1 and HoxA9 in acute lymphocytic leukemias with the t(4 : 11) abnormality. Oncogene. 2001;20:874–878. doi: 10.1038/sj.onc.1204174. [DOI] [PubMed] [Google Scholar]
- 19.Asnafi V, Radford-Weiss I, Dastugue N, et al. CALM-AF10 is a common fusion transcript in T-ALL and is specific to the TCRgammadelta lineage. Blood. 2003;102:1000–1006. doi: 10.1182/blood-2002-09-2913. [DOI] [PubMed] [Google Scholar]
- 20.Soulier J, Clappier E, Cayuela JM, et al. HOXA genes are included in genetic and biologic networks defining human acute T-cell leukemia (T-ALL) Blood. 2005;106:274–286. doi: 10.1182/blood-2004-10-3900. [DOI] [PubMed] [Google Scholar]
- 21.Choi CW, Chung YJ, Slape C, Aplan PD. A NUP98-HOXD13 fusion gene impairs differentiation of B and T lymphocytes and leads to expansion of thymocytes with partial TCRB gene rearrangement. J Immunol. 2009;183:6227–6235. doi: 10.4049/jimmunol.0901121. [DOI] [PMC free article] [PubMed] [Google Scholar]
- 22.Gough SM, Lee F, Chung YJ, et al. A NUP98-PHF23 Transgenic Mouse Model Develops AML and T-ALL. Blood. 2011;118:1058–1058. [Google Scholar]
- 23.Thorsteinsdottir U, Krosl J, Kroon E, Haman A, Hoang T, Sauvageau G. The oncoprotein E2A-Pbx1a collaborates with Hoxa9 to acutely transform primary bone marrow cells. Mol Cell Biol. 1999;19:6355–6366. doi: 10.1128/mcb.19.9.6355. [DOI] [PMC free article] [PubMed] [Google Scholar]
- 24.Thorsteinsdottir U, Mamo A, Kroon E, et al. Overexpression of the myeloid leukemia-associated Hoxa9 gene in bone marrow cells induces stem cell expansion. Blood. 2002;99:121–129. doi: 10.1182/blood.v99.1.121. [DOI] [PubMed] [Google Scholar]
- 25.Ogilvy S, Metcalf D, Gibson L, Bath ML, Harris AW, Adams JM. Promoter elements of vav drive transgene expression in vivo throughout the hematopoietic compartment. Blood. 1999;94:1855–1863. [PubMed] [Google Scholar]
- 26.Caudell D, Zhang Z, Chung YJ, Aplan PD. Expression of a CALM-AF10 fusion gene leads to Hoxa cluster overexpression and acute leukemia in transgenic mice. Cancer Res. 2007;67:8022–8031. doi: 10.1158/0008-5472.CAN-06-3749. [DOI] [PMC free article] [PubMed] [Google Scholar]
- 27.Morse HC, 3rd, Anver MR, Fredrickson TN, et al. Bethesda proposals for classification of lymphoid neoplasms in mice. Blood. 2002;100:246–258. doi: 10.1182/blood.v100.1.246. [DOI] [PubMed] [Google Scholar]
- 28.Holmes R, Zuniga-Pflucker JC. The OP9-DL1 system: generation of T-lymphocytes from embryonic or hematopoietic stem cells in vitro. Cold Spring Harb Protoc. 2009;2009 doi: 10.1101/pdb.prot5156. pdb prot 5156. [DOI] [PubMed] [Google Scholar]
- 29.Pineault N, Buske C, Feuring-Buske M, et al. Induction of acute myeloid leukemia in mice by the human leukemia-specific fusion gene NUP98-HOXD13 in concert with Meis1. Blood. 2003;101:4529–4538. doi: 10.1182/blood-2002-08-2484. [DOI] [PubMed] [Google Scholar]
- 30.Lin YW, Slape C, Zhang Z, Aplan PD. NUP98-HOXD13 transgenic mice develop a highly penetrant, severe myelodysplastic syndrome that progresses to acute leukemia. Blood. 2005;106:287–295. doi: 10.1182/blood-2004-12-4794. [DOI] [PMC free article] [PubMed] [Google Scholar]
- 31.Calvo KR, Sykes DB, Pasillas M, Kamps MP. Hoxa9 immortalizes a granulocyte-macrophage colony-stimulating factor-dependent promyelocyte capable of biphenotypic differentiation to neutrophils or macrophages, independent of enforced meis expression. Mol Cell Biol. 2000;20:3274–3285. doi: 10.1128/mcb.20.9.3274-3285.2000. [DOI] [PMC free article] [PubMed] [Google Scholar]
- 32.Schnabel CA, Jacobs Y, Cleary ML. HoxA9-mediated immortalization of myeloid progenitors requires functional interactions with TALE cofactors Pbx and Meis. Oncogene. 2000;19:608–616. doi: 10.1038/sj.onc.1203371. [DOI] [PubMed] [Google Scholar]
- 33.Krivtsov AV, Twomey D, Feng Z, et al. Transformation from committed progenitor to leukaemia stem cell initiated by MLL-AF9. Nature. 2006;442:818–822. doi: 10.1038/nature04980. [DOI] [PubMed] [Google Scholar]
- 34.Popovic R, Riesbeck LE, Velu CS, et al. Regulation of mir-196b by MLL and its overexpression by MLL fusions contributes to immortalization. Blood. 2009;113:3314–3322. doi: 10.1182/blood-2008-04-154310. [DOI] [PMC free article] [PubMed] [Google Scholar]
- 35.Schotte D, Lange-Turenhout EA, Stumpel DJ, et al. Expression of miR-196b is not exclusively MLL-driven but is especially linked to activation of HOXA genes in pediatric acute lymphoblastic leukemia. Haematologica. 2010;95:1675–1682. doi: 10.3324/haematol.2010.023481. [DOI] [PMC free article] [PubMed] [Google Scholar]
- 36.Lin YW, Aplan PD. Gene expression profiling of precursor T-cell lymphoblastic leukemia/lymphoma identifies oncogenic pathways that are potential therapeutic targets. Leukemia. 2007;21:1276–1284. doi: 10.1038/sj.leu.2404685. [DOI] [PMC free article] [PubMed] [Google Scholar]
- 37.Novak RL, Harper DP, Caudell D, Slape C, Beachy SH, Aplan PD. Gene expression profiling and candidate gene resequencing identifies pathways and mutations important for malignant transformation caused by leukemogenic fusion genes. Exp Hematol. 2012 doi: 10.1016/j.exphem.2012.08.001. [DOI] [PMC free article] [PubMed] [Google Scholar]
- 38.Armstrong F, Brunet de la Grange P, Gerby B, et al. NOTCH is a key regulator of human T-cell acute leukemia initiating cell activity. Blood. 2009;113:1730–1740. doi: 10.1182/blood-2008-02-138172. [DOI] [PubMed] [Google Scholar]
- 39.Morgado E, Albouhair S, Lavau C. Flt3 is dispensable to the Hoxa9/Meis1 leukemogenic cooperation. Blood. 2007;109:4020–4022. doi: 10.1182/blood-2006-01-039586. [DOI] [PubMed] [Google Scholar]
- 40.Somervaille TC, Cleary ML. Identification and characterization of leukemia stem cells in murine MLL-AF9 acute myeloid leukemia. Cancer cell. 2006;10:257–268. doi: 10.1016/j.ccr.2006.08.020. [DOI] [PubMed] [Google Scholar]
- 41.Heuser M, Yun H, Berg T, et al. Cell of origin in AML: susceptibility to MN1-induced transformation is regulated by the MEIS1/AbdB-like HOX protein complex. Cancer cell. 2011;20:39–52. doi: 10.1016/j.ccr.2011.06.020. [DOI] [PMC free article] [PubMed] [Google Scholar]
- 42.Van Vlierberghe P, van Grotel M, Tchinda J, et al. The recurrent SET-NUP214 fusion as a new HOXA activation mechanism in pediatric T-cell acute lymphoblastic leukemia. Blood. 2008;111:4668–4680. doi: 10.1182/blood-2007-09-111872. [DOI] [PMC free article] [PubMed] [Google Scholar]
- 43.Soulier J, Clappier E, Cayuela JM, et al. HOXA genes are included in genetic and biologic networks defining human acute T-cell leukemia (TALL) Blood. 2005;106:274–286. doi: 10.1182/blood-2004-10-3900. [DOI] [PubMed] [Google Scholar]
- 44.Ferrando AA, Armstrong SA, Neuberg DS, et al. Gene expression signatures in MLL-rearranged T-lineage and B-precursor acute leukemias: dominance of HOX dysregulation. Blood. 2003;102:262–268. doi: 10.1182/blood-2002-10-3221. [DOI] [PubMed] [Google Scholar]
- 45.Cauwelier B, Cave H, Gervais C, et al. Leukemia. Vol. 21. Leukemia Society of America, Leukemia Research Fund; UK: 2007. Clinical, cytogenetic and molecular characteristics of 14 T-ALL patients carrying the TCRbeta-HOXA rearrangement: a study of the Groupe Francophone de Cytogenetique Hematologique; pp. 121–128. official journal of the. [DOI] [PubMed] [Google Scholar]
- 46.Lin YW, Nichols RA, Letterio JJ, Aplan PD. Notch1 mutations are important for leukemic transformation in murine models of precursor-T leukemia/lymphoma. Blood. 2006;107:2540–2543. doi: 10.1182/blood-2005-07-3013. [DOI] [PMC free article] [PubMed] [Google Scholar]
- 47.O’Neil J, Calvo J, McKenna K, et al. Activating Notch1 mutations in mouse models of TALL. Blood. 2006;107:781–785. doi: 10.1182/blood-2005-06-2553. [DOI] [PMC free article] [PubMed] [Google Scholar]
- 48.Weng AP, Ferrando AA, Lee W, et al. Activating mutations of NOTCH1 in human T cell acute lymphoblastic leukemia. Science. 2004;306:269–271. doi: 10.1126/science.1102160. [DOI] [PubMed] [Google Scholar]
- 49.Pear WS, Aster JC, Scott ML, et al. Exclusive development of T cell neoplasms in mice transplanted with bone marrow expressing activated Notch alleles. J Exp Med. 1996;183:2283–2291. doi: 10.1084/jem.183.5.2283. [DOI] [PMC free article] [PubMed] [Google Scholar]
- 50.Kumar AR, Hudson WA, Chen W, Nishiuchi R, Yao Q, Kersey JH. Hoxa9 influences the phenotype but not the incidence of Mll-AF9 fusion gene leukemia. Blood. 2004;103:1823–1828. doi: 10.1182/blood-2003-07-2582. [DOI] [PubMed] [Google Scholar]
- 51.Wang GG, Song J, Wang Z, et al. Haematopoietic malignancies caused by dysregulation of a chromatin-binding PHD finger. Nature. 2009;459:847–851. doi: 10.1038/nature08036. [DOI] [PMC free article] [PubMed] [Google Scholar]
- 52.Trivedi CM, Patel RC, Patel CV. Differential regulation of HOXA9 expression by nuclear factor kappa B (NF-kappaB) and HOXA9. Gene. 2008;408:187–195. doi: 10.1016/j.gene.2007.11.001. [DOI] [PubMed] [Google Scholar]
- 53.Horton SJ, Grier DG, McGonigle GJ, et al. Continuous MLL-ENL expression is necessary to establish a “Hox Code” and maintain immortalization of hematopoietic progenitor cells. Cancer Res. 2005;65:9245–9252. doi: 10.1158/0008-5472.CAN-05-1691. [DOI] [PubMed] [Google Scholar]
- 54.Wong P, Iwasaki M, Somervaille TC, So CW, Cleary ML. Meis1 is an essential and rate-limiting regulator of MLL leukemia stem cell potential. Genes Dev. 2007;21:2762–2774. doi: 10.1101/gad.1602107. [DOI] [PMC free article] [PubMed] [Google Scholar]