

Abstract
Purpose
Activation of the epidermal growth factor receptor (EGFR) requires cell surface cleavage of EGFR ligands, uptake of soluble ligand by the receptor, and initiation of EGFR tyrosine kinase activity. We define these collective events as the EGFR axis. Transforming growth factor-α (TGF-α) and amphiregulin are two EGFR ligands that are delivered preferentially to the basolateral surface of polarized epithelial cells where the EGFR resides. TACE/ADAM-17 (tumor necrosis factor-α converting enzyme/a disintegrin and metalloprotease) has been implicated in ectodomain cleavage of TGF-α and amphiregulin.
Experimental Design
Using a human polarizing colorectal cancer (CRC) cell line, HCA-7, and a tissue array of normal colonic mucosa and primary and metastatic CRC, we determined the intracellular localization of TACE and the effects of EGFR axis inhibition in CRC.
Results
Herein, we show that TACE is localized to the basolateral plasma membrane of polarized HCA-7 cells. TACE is overexpressed in primary and metastatic CRC tumors compared with normal colonic mucosa; the intensity of its immunoreactivity is inversely correlated with that of TGF-α and amphiregulin. Pharmacologic blockade of HCA-7 cells with an EGFR monoclonal antibody, a selective EGFR tyrosine kinase inhibitor, and a selective TACE inhibitor results in concentration-dependent decreases in cell proliferation and active, phosphorylated mitogen-activated protein kinase. Combining suboptimal concentrations of these agents results in cooperative growth inhibition, increased apoptosis, and reduced mitogen-activated protein kinase pathway activation. Furthermore, an EGFR tyrosine kinase – resistant clone of HCA-7 cells is growth-inhibited by combined monoclonal antibody and TACE inhibition.
Conclusion
These results implicate TACE as a promising target of EGFR axis inhibition in CRC.
The Food and Drug Administration has approved the use of cetuximab (Erbitux) and panitumumab (Vectibix), monoclonal antibodies (mAb) directed against the ectodomain of the epidermal growth factor receptor (EGFR) that block ligand binding, for the treatment of advanced colorectal cancer (CRC), and gefitinib (Iressa) and erlotinib (Tarceva), two reversible EGFR tyrosine kinase inhibitors (TKI), for the treatment of advanced non–small cell lung cancer. Although designed against the same molecular target, it is clear that these two drug classes affect the EGFR signaling pathway in very distinct ways. This, in turn, has resulted in different spectra of clinical activity and utility. Several studies have identified the presence of specific somatic mutations in the tyrosine kinase domain of the EGFR gene in the tumor to be responsible for responsiveness to gefitinib (1, 2). Additional factors contribute to the likelihood of responding to gefitinib; these include EGFR gene amplification (3) and mutant K-Ras (4) in the tumor, as well as tumor tissue levels of epiregulin and amphiregulin (5). Previous work from our laboratory has shown that EGFR ligands transforming growth factor-α (TGF-α) and amphiregulin are frequently up-regulated in CRC (6, 7). Cell surface proteolytic processing of TGF-α and amphiregulin requires tumor necrosis factor-α converting enzyme (TACE), which is also known as a disintegrin and metalloprotease (ADAM-17), a member of the ADAM family of metalloproteases (8–10). The importance of the role of TACE in the cleavage of these ligands is highlighted by the fact that mice lacking TACE die perinatally and resemble EGFR-null mice (8, 11). The finding that TACE-null mice exhibit a more severe phenotype than TGF-α–null mice, suggests that additional EGFR ligands are also cleaved by TACE, and we subsequently showed that amphiregulin is also cleaved by TACE (12). These genetic experiments substantiated that TACE is essential for the activation of EGFR ligands in vivo. Consistent with these observations, TACE-deficient cells have also been shown to be defective in the shedding of TGF-α, amphiregulin, and heparin-binding EGF–like growth factor (8, 13).
Recently, inhibition of TACE has been shown to block shedding of TGF-α and amphiregulin in breast cancer cell lines, as well as blocking subsequent EGFR signaling (14). Therefore, one can consider TACE a component of the “EGFR axis” which we define as the proximal events associated with the activation of EGFR in vivo and include cell surface EGFR ligand cleavage, ligand uptake by receptor, and EGFR tyrosine kinase phosphorylation and activation (Fig. 1). The purpose of this study was to determine if TACE is a viable target of the EGFR axis in CRC and to determine if combined inhibition of two or more elements involved in the EGFR axis results in more effective tumor growth inhibition.
Fig. 1.

Pharmacologic blockade of the EGFR axis. Agents that target discrete components of the EGFR axis (arrows). The EGFR axis is defined as the proximal events involved in the activation of the EGFR (arrows pointing to the component that is targeted). These events include proteolytic cleavage of cell surface ligand to release mature soluble growth factor, uptake of ligand by EGFR, and EGFR tyrosine kinase activation.
Materials and Methods
Reagents
Cell culture reagents were purchased from Invitrogen Corporation. NP40, culture reagent, Tween 20, and TCA were purchased from Fisher Scientific. Acrylamide was purchased from Bio-Rad Laboratories. Tritiated thymidine was purchased from MP Biomedical. All other chemicals were purchased from Sigma. TACE antibody was purchased from Santa Cruz Biotechnology, TGF-α antibody was from Oncogene/Calbiochem, amphiregulin antibody was from Lab Vision Corporation, and mitogen-activated protein kinase (MAPK) and phosphorylated MAPK (pMAPK) antibodies were from Cell Signaling Technology. mAb528 was generously provided by Hideo Masui (Memorial Sloan-Kettering Cancer Center, New York, NY), whereas WAY-022 and EKI-785 were generously provided by Jay Gibbons from Wyeth-Aherst (Pearl River, NY).
Cells and cell culture
HCA-7 cells, passage 20 to 35, were grown in DMEM supplemented with 10% fetal calf serum (Intergen), glutamine, nonessential amino acids, 100 units/mL of penicillin, and 100 μg/mL of streptomycin in a 5% CO2 atmosphere with constant humidity at 37°C. HCA-7 cells were cultured on 12-mm Transwell filters (pore size, 0.4 μmol/L) under previously defined conditions (15). Transepithelial electrical resistance across the Transwell filter was measured using a Millicell Electrical Resistance System (Millipore) to evaluate the functional integrity of tight junctions. Experiments were conducted 7 days after seeding, when resistance was >400 ohms/cm2.
Measurement of DNA replication by tritiated-thymidine incorporation
HCA-7 cells were polarized on 12 mm Transwell filters as described above. Cells were treated with 3-log doses of (a) EKI-785, an irreversible EGFR TKI (0.01, 0.1, and 1 μmol/L), (b) mAb528—a mAb to the ectodomain of EGFR that blocks ligand binding (0.3, 3, and 30 μg/mL), and (c) a selective TACE inhibitor—WAY-022 (0.1, 1, and 10 μmol/L) individually to the apical and basolateral surface of polarized HCA-7 cells to determine the effects of compartmental delivery of these agents. In separate experiments, HCA-7 cells were also subconfluently grown on 24-well plates (20,000 cells/well). After determining dose-response curves, drugs were added in combination at suboptimal doses. Cells were pulsed with diluted tritiated-thymidine (1:10) for 3 h, from 21 to 24 h after treatment with the agents listed above. Medium was aspirated and cells were washed thrice with 10% TCA. TCA precipitable counts were determined as described previously (16).
Cell count
HCA-7 cells were grown to near confluence on 24-well plates (20,000 cells/well). Cells were treated with 3-log doses of (a) EKI 785 (0.01, 0.1, and 1 μmol/L), (b) mAb528 (0.03, 0.3, and 3 μg/mL), and (c) WAY-022 (0.1, 1, and 10 μmol/L). After determining dose-response curves, drugs were added in combination at suboptimal doses. At days 2, 4, and 6, cells were trypsinized and added to 9.5 mL of Coulter fluid and counted in a Coulter counter. At day 6, cells were washed, drugs were removed, and cells were allowed to re-grow in the washed medium. At days 3 and 6 of the reversal of drug treatment, cells were trypsinized and added to 9.5 mL of Coulter fluid and then counted in a Coulter counter.
Cell surface biotinylation
Cell surface biotinylation was done on cells grown on Transwell filters. All steps were done on ice or at 4°C. Filter chambers were washed four times with PBS. Cells were then rinsed in biotinylation buffer (250 mmol/L sucrose, 2 mmol/L CaCl in 10 mmol/L triethanolamine-HCl; pH 9.0). Sulfosuccinimidobiotin was diluted to a final concentration of 2.0 mg/mL in ice-cold biotinylation buffer and used immediately. For steady state expression, cells biotinylated at either the apical or basolateral surface were lysed and immunoprecipitated. Immunoprecipitates were separated by SDS-PAGE under reducing conditions and electrophoretically transferred overnight at a constant 30 V to nitrocellulose (0.2 μmol/L). The nitrocellulose filters were blocked in T-TBS [50 mmol/L Tris-HC1 (pH 7.5), 150 mmol/L NaC1, 0.05% Tween 20] containing 2.5% bovine serum albumin for 1 h at room temperature and then incubated with 125I-streptavidin (0.2 pCi/mL) diluted in T-TBS containing 1% bovine serum albumin for 1 h at room temperature. The filters were washed extensively with T-TBS, dried and then autoradiographed.
EKI-resistant HCA-7 cells
Parental HCA-7 cells (passage 25) were sparsely grown in supplemented media and 5 nmol/L of EKI-785. Cells were allowed to attach and grow for 1 to 2 weeks and were split to sequentially passage in increasing concentrations of EKI-785 (5, 10, 20, 40, 60, 70, 80, 100, 150, 300, and 500 nmol/L, and 1, 2, and 3 μmol/L) over a 6-month period. Cells did not survive at EKI-785 concentrations >2 μmol/L. Cells that survived in 1 μmol/L of EKI-785 were considered EKI-resistant.
Apoptosis assay
Twenty-five thousand HCA-7 cells were plated into each well of an glass-bottomed 96-well plate in 100 μL of DMEM containing 10% fetal calf serum. Cells were incubated at 37°C with 5% CO2. Cells were treated with 3-log doses of (a ) EKI-785 (0.01, 0.1, and 1 μmol/L), (b) mAb528 (0.3, 3, and 30 μg/mL), and (c) WAY-022 (0.1, 1, and 10 μmol/L). After determining dose-response curves, drugs were added in combination at suboptimal doses. Cells were incubated in new media for 24 h after which caspase 3/7 activity was quantified using Caspase-Glo 3/7 assay kit (Promega). After 1 h of incubation at 25°C, luminescent signals were measured using the Xenogen IVIS system. Signal was quantified using IVIS software.
Western blot analysis
Western blotting was done/did as described previously (15) using rabbit anti-human antibodies to MAPK and pMAPK (Cell Signaling Technology) at a 1:1,000 dilution.
TACE, amphiregulin, and TGF-α immunohistochemistry and tissue microarray
Sections from paraffin-embedded tissue were deparaffinized in xylene and rehydrated. Antigen retrieval was done by incubating the sections in citrate buffer (pH 6.0) at 120°C and cooling. Endogenous peroxidase was blocked in 3% H2O2. Primary antibody (TACE) was applied at a dilution of 1:50. Sections were incubated in a biotinylated secondary antibody followed by a peroxidase-labeled streptavidin. The sections were lightly counterstained in Mayer’s hematoxylin, dehydrated, cleared in xylene and coverslipped.
A tissue microarray containing 34 matched primary colorectal carcinomas, liver metastases, and normal colorectal mucosa was constructed using 1-mm cores. Samples were immunostained with mouse monoclonal TGF-α antibody (1:40 primary dilution), goat polyclonal TACE (K-20) antibody (1:50 primary dilution), and rabbit polyclonal amphiregulin (RB-257-PO) antibody (1:100 primary dilution). Primary antibody detection was accomplished using the following systems.
TGF-α and amphiregulin
Specimen slides were incubated at room temperature for 30 min (TGF-α) or 60 min (amphiregulin) at the noted dilution followed by a 30-min incubation using the Envision+ System horseradish peroxidase–labeled polymer staining technique (Dakocytomation).
TACE (K-20)
Specimen slides were incubated at room temperature for 30 min at the noted dilution followed by two 15-min sequential incubations with a biotinylated link antibody and peroxidase-labeled streptavidin, LSAB+ System horseradish peroxidase (Dakocytomation). Staining was completed for all three protocols after incubation with a 3,3′-diaminobenzidine substrate–chromogen solution.
TGF-α, amphiregulin, and TACE cytoplasmic staining was graded using the intensity of staining scored as 0, 1 (+), 2 (++), and 3 (+++) for normal colonic mucosa, primary CRC tumor, and metastatic CRC tumor on the tissue microarray. A paired t test statistic was used to examine the differences in TACE and amphiregulin, and TACE and TGF-α intensity of staining between tumor (both primary and metastatic) and normal mucosa. The Wilcoxon rank sum test was used to examine the distribution of these differences compared with each other (i.e., TACE versus TGF-α and amphiregulin).
Results
TACE localizes to the basolateral membrane of polarized HCA-7 cells
Previous work from our laboratory has shown that in polarizing epithelial cells, EGFR is restricted predominantly to the basolateral surface, and both TGF-α and amphiregulin are delivered selectively to this compartment in which they are cleaved, and soluble ligand then binds to EGFR (12, 17). TACE has been implicated in the cell surface cleavage of TGF-α and amphiregulin (8–10). We now show that TACE is also restricted to the basolateral surface of polarized HCA-7 cells by immunohistochemistry and cell surface biotinylation. In the xz-axis, TACE immunoreactivity is detected along the basolateral, but not the apical, plasma membrane of polarizing HCA-7 cells (Fig. 2A). Selective biotinylation of the apical and basolateral cell surface and immunoprecipitation of cell lysates with a TACE-specific antibody followed by streptavidin Western blotting confirmed the presence of TACE at the basolateral, but not the apical, cell surface (Fig. 2B). Therefore, there is basolateral compartmentalization of the proximal events in the activation of EGFR, i.e., cell surface delivery and ligand cleavage, ligand uptake by the receptor, and activation of the receptor’s intrinsic tyrosine kinase. TACE was also observed at the basolateral surface of two additional polarizing CRC cell lines, Caco-2 and HCT-8 (data not shown).
Fig. 2.
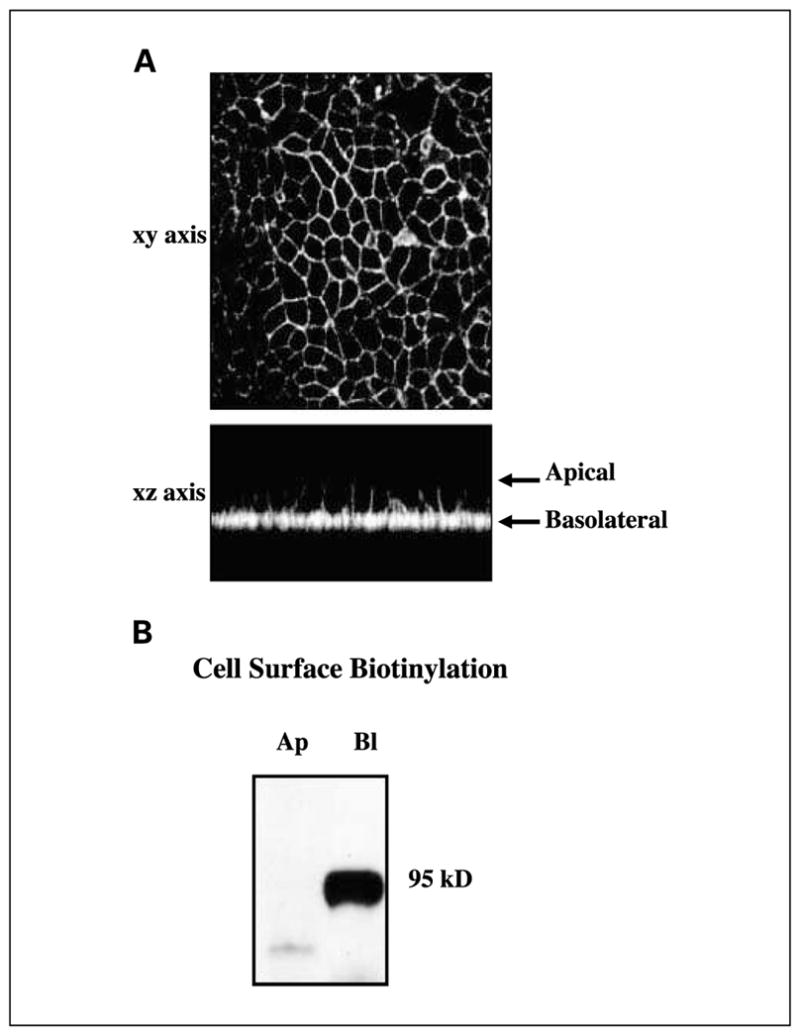
TACE localizes to the basolateral surface of polarized HCA-7 cells. HCA-7 cells were grown on Transwell filters for 7 days when electrical resistance exceeded 400 ohms/cm2. A, cells then were fixed and stained with TACE-specific mAb M222. TACE was visualized using Cy3-conjugated donkey anti-mouse IgG. xz-axis, the top and bottom of the cell monolayer (arrows). B, on day 7, cells were selectively cell surface – biotinylated at either the apical or basolateral surface. Total cell lysates were prepared and immunoprecipitated with M222. Immunoprecipitants were separated by SDS-PAGE, transferred to nitrocellulose, and probed with streptavidin-horseradish peroxidase. Immunoreactivity was detected using the enhanced chemiluminescence Western blotting detection kit in combination with fluorography. Ap, apical; Bl, basolateral.
TACE expression in colorectal tumors
Although the expression of TGF-α and amphiregulin has been previously reported (18–21), there have been no reports of immunologic expression of TACE in CRC. Therefore, we examined the expression of TACE in human normal colonic mucosa and primary CRC tissue. Immunohistochemistry of TACE in normal colonic mucosa shows weak patchy basolateral membrane expression in deep colonic crypts of epithelial cells. In primary CRC, there is an increased membranous expression of TACE in tumor cells with weaker cytoplasmic staining (Fig. 3A and B).
Fig. 3.

Expression of TACE in (A) normal colonic mucosa and (B) primary colon cancer by immunohistochemistry. A, normal colonic mucosa shows weak patchy basolateral membrane expression of TACE in epithelial cells of deep colonic crypts. B, primary colorectal carcinomas exhibit increased membranous expression of TACE in tumor cells and weaker cytoplasmic staining.
A tissue microarray containing 34 matched primary colorectal carcinomas, liver metastases, and normal colorectal mucosa was constructed using 1-mm cores. Figure 4A and B depict the distribution of the difference in intensity staining between the normal colonic mucosa and primary tumor and normal colonic mucosa and metastatic tumor for TACE, TGF-α, and amphiregulin. Expression of these proteins was scored as 0 to 3+ in intensity, and the percentage of positive tumor cells was estimated. Cytoplasmic and nuclear positivity was assessed separately.
Fig. 4.

Distribution of differences in TACE, TGF-α, and amphiregulin staining between paired normal colonic mucosa and primary and metastatic CRCs. A, distribution of the difference in intensity staining between normal colonic mucosa, primary CRCs, and metastatic CRCs for TACE, TGF-α, and amphiregulin. Expression of these proteins was scored as 0 to 3+ in intensity and the percentage of positive tumor cells was estimated. In normal colonic mucosa, immunohistochemistry for TACE showed weak patchy basolateral membrane expression in crypt epithelial cells, more prominent at the crypt base. As a group, primary and metastatic CRCs overexpressed TACE compared with normal colonic epithelium, with strong diffuse cytoplasmic staining and with membrane and nuclear staining also seen in some tumors. In contrast, immunohistochemistry for TGF-α showed strong positivity in normal colonic mucosa localized to the superficial portion of the crypts and the surface epithelium with limited expression seen in primary and metastatic CRCs. Immunohistochemistry for amphiregulin in normal colonic mucosa showed granular 1+ to 2+ supranuclear positivity in all but two cases. Diffuse cytoplasmic, nuclear, or membrane staining was not seen. In primary and metastatic CRCs, a variable degree of supranuclear granular staining was present, and many cases showed homogeneous diffuse cytoplasmic staining as well. B, diamond plots showing the distribution of differences in TACE, TGF-α, and amphiregulin staining in primary CRC tumors compared with paired normal colonic mucosa (P < 0.0001 for TACE, P = 0.0323 for TGF-α and P = 0.6615 for amphiregulin) and (C) metastatic tumors compared with paired normal colonic mucosa for each subject on tissue array (P < 0.0001 for both TACE and TGF-α and P = 0.0388 for amphiregulin). Differences >0 describe tumor tissue with higher levels of protein staining than normal colonic mucosa, whereas differences <0 describe levels of protein staining greater in normal colonic mucosa. There is an inverse relationship between TACE and TGF-α immunostaining with respect to both primary and metastatic tumors. In both primary and metastatic CRCs, TGF-α staining is greater in normal colonic mucosa (therefore, less in tumor tissue), and TACE staining is greater in tumor tissues (less in normal colonic mucosa; P < 0.0001). Difference in amphiregulin expression (normal mucosa compared with CRCs) was less than both TACE and TGF-α expression in both primary (P < 0.0001 and P = 0.0312, respectively) and metastatic CRCs (P < 0.0001 and P = 0.0048, respectively).
In normal colonic mucosa, immunohistochemistry for TACE showed weak patchy basolateral membrane expression in crypt epithelial cells, more prominent at the crypt base. In contrast, immunohistochemistry for TGF-α showed strong positivity in normal colonic mucosa localized to the superficial portion of the crypts and the surface epithelium. As a group, colorectal carcinomas overexpressed TACE compared with normal colonic epithelium with strong diffuse cytoplasmic staining; membrane staining and nuclear staining was also seen in some tumors. In normal colonic mucosa, granular 1+ to 2+ supranuclear positivity for amphiregulin was present in all but two cases. Diffuse cytoplasmic, nuclear, or membrane staining was not seen. In primary colorectal carcinomas, a variable degree of supranuclear granular staining was present, and many cases showed homogeneous diffuse cytoplasmic staining as well. Only three primary cancers showed nuclear staining and no cases showed membranous staining. A similar pattern of expression was seen in the liver metastases. See Fig. 4A for representative staining pattern of TACE, TGF-α, and amphiregulin from the tissue microarray.
Figure 4B and C depict the distribution of the difference in intensity staining between the normal colonic mucosa and primary tumor, and normal colonic mucosa and metastatic tumor for TACE, TGF-α, and amphiregulin. There was an overall statistical difference between TACE, TGF-α, and amphiregulin in normal mucosa and primary CRC tissue (P = 0.0001), as well as in normal mucosa and metastatic CRC tissue (P < 0.0001) in pairwise comparisons. The average intensity of staining of TACE was higher in both primary and metastatic CRC tumors compared with normal colonic mucosa (P < 0.0001 and 0.0323, respectively). On the other hand, average intensity of TGF-α staining was higher in normal colonic mucosa compared with both primary and metastatic CRC tumors (P < 0.0001 for both primary and metastatic CRC tumors). The average intensity for amphiregulin staining was greater in primary and metastatic CRC tumors than in paired normal colonic mucosa, but this reached statistical significance only in the normal colonic mucosa to metastatic tumor pairwise comparison (P = 0.6615 and 0.0388, respectively).
The Wilcoxon signed rank test statistic showed a statistically significant inverse correlation for both amphiregulin and TGF-α when compared with TACE, with TACE showing greater expression in both primary (P < 0.0001 for TGF-α and amphiregulin) and metastatic (P < 0.0001 for TGF-α and amphiregulin) CRC tissue. This inverse relationship to TACE was greater for TGF-α than for amphiregulin. Amphiregulin expression was significantly greater than TGF-α in both primary (P = 0.0312) and metastatic (P = 0.0048) CRC tissue.
Inhibition of components of the EGFR axis results in a decrease in cell growth
We first sought to determine the effect of individual agents of the EGFR axis on a human CRC cell line, HCA-7, grown as a subconfluent monolayer on plastic. In this set of experiments, we used 3-log doses of an irreversible TKI of EGFR (EKI-785), a mAb that selectively blocks ligand binding to EGFR (mAb528) and a selective TACE inhibitor (WAY-022). Treatment of HCA-7 cells with individual doses of these agents resulted in concentration-dependent decreases in DNA replication and cell growth.
Having determined that blockade of different targets of the EGFR axis inhibits cell growth, we sought to address the relevance of the basolateral localization of the targets of the EGFR axis. Therefore, HCA-7 cells were first polarized on Transwell filters. Apical treatment of polarized HCA-7 cells with mAb528 and WAY-022 had no effect on cell proliferation. Basolateral treatment with mAb528 resulted in a significant concentration-dependent decrease in DNA replication (Fig. 5A). Basolateral treatment with 10 μmol/L of WAY-022 resulted in a significant decrease in DNA replication (Fig. 5B). Being a small molecule, both apical and basolateral treatment with EKI-785 resulted in a decrease in cell proliferation in a concentration-dependent fashion. However, basolateral treatment with 0.1 μmol/L of EKI-785 resulted in a significantly lower DNA replication compared with the same dose added apically (Fig. 5C). These results further underscore the importance of the spatial compartmentalization of targets of the EGFR axis.
Fig. 5.

Basolateral versus apical delivery of (A) mAb528, (B) WAY-022, and (C) EKI-785 in polarized HCA-7 cells. A to C, for basolateral and apical delivery experiments, agents were delivered separately to the apical and basolateral surface of polarized HCA-7 cells for 24 h. A, mAb528.0.3, 3, and 30 μg/mL (*, P < 0.05 versus Control); B, WAY-022.0.1, 1, and 10 μmol/L (*, P <0.05 versus Control); C, EKI-785.0.01, 0.1, and 1 μmol/L (*, P < 0.05 versus Control; †, P < 0.05 versus 0.1 μmol/L EKI-785 Apical). Basolateral versus apical delivery of the agents resulted in decreased cell proliferation in a concentration-dependent manner.
Combined blockade of the EGFR axis results in cooperative growth inhibition
Cetuximab, a mAb against EGFR, has been shown to have clinical activity in only 10% of patients with chemotherapy-resistant metastatic CRC (22, 23). We have shown that gefitinib has no response in patients with metastatic CRC (24). These results clearly show the limitations of using individual agents which target the EGFR axis in the treatment of CRC. It has been suggested that combining these agents might augment the effects of the individual drugs alone. To test this, we treated HCA-7 colon cancer cells with suboptimal concentrations of combinations of two of the three drugs blocking the EGFR axis. Combined treatment of two drugs at suboptimal concentrations resulted in cooperative growth inhibition as determined by tritiated thymidine incorporation compared with optimal and suboptimal concentrations of the individual agents alone. The optimal doses for EKI-785, mAb528, and WAY-022 were 1 μmol/L, 30 μg/mL, and 10 μmol/L, respectively. Treatment with suboptimal combinations of EKI-785 (0.01 μmol/L) and mAb528 (3 μg/mL) showed significantly decreased DNA replication compared with EKI-785 (0.01 μmol/L) and mAb528 (3 μg/mL) alone (P < 0.05). Combinations of suboptimal concentrations of EKI-785 (0.01 μmol/L) and WAY-022 (1 μmol/L) resulted in cooperative inhibition in DNA replication, which was significantly lower than that seen by either dose alone (P < 0.05). Combinations of WAY-022 (1 μmol/L) and mAb528 (3 μg/mL) also resulted in significantly decreased DNA replication compared with either suboptimal dose alone (P < 0.05; Fig. 6A). We have also shown these results in FET and HCT 116 colon cancer cell lines. Cell counts of suboptimal concentrations of drug combinations showed similar cooperative growth inhibition compared with counts seen with individual drugs alone, and this effect was reversible (data not shown).
Fig. 6.


Effect of pharmacologic blockade of the EGFR axis on proliferative and apoptotic indices in parental (A-C) and EKI-resistant (D) HCA-7 cells. For the combination experiments, HCA-7 cells were grown subconfluently on 24-well plates (20,000 cells/well). Agents were added in combination at suboptimal doses. Combinations of suboptimal doses of agents resulted in cooperative growth inhibition: 0.01 μmol/L of EKI-785 + 3 μg/mL of mAb528 (*, P < 0.05 versus 3 μg/mL of mAb528; †, P < 0.05 versus 0.01 μmol/L of EKI-785); 0.01 μmol/L of EKI-785 + 1 μmol/L of WAY-022 (†, P < 0.05 versus 0.01 μmol/L of EKI-785; ‡, P < 0.05 versus 1 μmol/L of WAY-022); 1 μmol/L of WAY-022 + 3 μg/mL of mAb528 (*, P < 0.05 versus 3 μg/mL mAb528; ‡, P < 0.05 versus 1 μmol/L WAY-022). B, subconfluent HCA-7 cells were treated for 24 h with 3-log doses of EKI-785, mAb528, and WAY-022 as well as suboptimal concentrations of two of the agents in combination. Treatment with EKI-785 showed significantly enhanced, concentration-dependent caspase 3/7 activity compared with untreated HCA-7 cells (P < 0.05). Only the highest dose (30 μg/mL) of mAb528 resulted in significantly increased caspase 3/7 activity compared with untreated cells (P < 0.05). WAY-022 had minimal effects on caspase 3/7 activity (data not shown). Suboptimal concentrations of two of the agents were added as shown. Combinations of suboptimal doses of agents resulted in cooperative increase in caspase 3/7 activity: 0.1 μmol/L of EKI-785 + 3 μg/mL of mAb528 (*, P < 0.05 versus 3 μg/mL of mAb528); 0.1 μmol/L of EKI-785 + 1 μmol/L of WAY-022 (‡, P < 0.05 versus 1 μmol/L of WAY-022); 1 μmol/L of WAY-022 + 3 μg/mL of mAb528 (‡, P < 0.05 versus 1 μmol/L of WAY-022). C, representative Western blot showing a decrease in pMAPK with suboptimal concentrations of EKI-785 and WAY-022. An additive decrease in pMAPK was observed using suboptimal concentrations of combinations of EKI-785 with mAb528 and EKI-785 with WAY-022. D, EKI-resistant HCA-7 cells were maintained in medium containing 1 μmol/L of EKI-785 and were grown subconfluent on 24-well plates (20,000 cells/well). These cells were treated with the optimal and suboptimal dose of mAb528 (0.3 and 3 μg/mL), WAY-022 (1 and 10 μmol/L), and a combination of the suboptimal dose of both drugs for 24 h. Treatment with mAb528 and WAY-022 enhances growth inhibition of EKI-resistant HCA-7 cells (*, P < 0.05 versus Control; **, P < 0.05 versus all groups).
Combined blockade of the EGFR axis results in a cooperative increase in apoptotic activity
Treatment of HCA-7 cells with EKI-785 resulted in a concentration-dependent increase in caspase 3/7 activity; treatment with mAb528 showed a significant increase in caspase 3/7 activity only at the highest dose (30 μg/mL), and treatment with WAY-022 had minimal effects on apoptotic activity (data not shown). Despite this, treatment with combinations of suboptimal doses of EKI-785 (0.1 μmol/L) and mAb528 (3 μg/mL) as well as EKI-785 (0.1 μmol/L) and WAY-022 (1 μmol/L) resulted in a cooperative increase in apoptotic activity which was significantly greater than the caspase 3/7 activity seen with all doses of mAb528 and WAY-022, including the optimal doses of these agents. These combinations, however, resulted in increased caspase 3/7 activity compared with only the lowest dose of EKI-785 (0.01 μmol/L) added alone, but not the higher doses of EKI-785. Combinations of suboptimal doses of mAb528 (3 μg/mL) and WAY-022 (1 μmol/L) resulted in a significant increase in apoptotic activity compared with all doses of WAY-022; however, no significant differences in apoptotic activity were noted compared with any individual doses of mAb528 (Fig. 6B). Similar cooperative increases in caspase 3/7 activity have also been seen with DiFi colon cancer cells using combinations of mAb528 and EKI-785.
Combined blockade of the EGFR axis results in enhanced reduction in pMAPK
Similar to that seen with DNA replication, a concentration-dependent decrease in pMAPK was seen with treatment of HCA-7 cells over 3-log doses of EKI-785, mAb528, and WAY-022 (data not shown). Combinations of suboptimal doses of EKI-785 (0.1 μmol/L) and WAY-022 (1 μmol/L), and EKI-785 (0.1 μmol/L) and mAb528 (3 μg/mL) resulted in an enhanced decrease in pMAPK levels compared with that seen with the suboptimal concentrations of each drug alone. This decrease in pMAPK level was not seen with the combination of 3 μg/mL of mAb528 and 1 μmol/L of WAY-022. These experiments were repeated and confirmed four times. A representative Western blot showing these results is seen in Fig. 6C.
Treatment with mAb528 and WAY-022 enhances growth inhibition of EKI-resistant HCA-7 cells
Acquired resistance to kinase-targeted anticancer therapy has been a significant problem in many tumor types. Receptor TKIs to EGFR have shown benefit in clinical trials; however, they have had limited effects in certain malignancies such as CRC. To determine if resistance to TKI inhibition could be overcome by blockade of the other components of the EGFR axis, we developed EKI-resistant HCA-7 cells (see Materials and Methods). EKI-resistant HCA-7 cells were maintained in medium containing 1 μmol/L of EKI-785 and were subconfluently grown on 24-well plates (20,000 cells/well). These cells were then treated with the optimal and suboptimal doses of mAb528 (3 and 30 μg/mL) and WAY-022 (1 and 10 μmol/L) for 24 h. Treatment of EKI-resistant HCA-7 cells with both the optimal and suboptimal doses of WAY-022 and the optimal dose of mAb528 (30 μg/mL) resulted in a significant decrease in DNA replication compared with untreated EKI-resistant HCA-7 cells (P < 0.05). No change in DNA replication was seen with the treatment of the suboptimal dose of mAb528 (3 μg/mL). Treatment of these cells with a combination of the suboptimal dose of mAb528 (3 μg/mL) and WAY-022 (1 μmol/L) resulted in further cooperative inhibition of DNA replication compared with that seen with the suboptimal dose of each drug added individually (P < 0.05; Fig. 6D). These results suggest that mAb blockade of EGFR and TACE inhibition could overcome TKI resistance in CRC.
Discussion
The results of our study highlight the importance of the spatial compartmentalization of the EGFR and its ligands in the context of polarizing epithelial cells. Critical control points in the EGFR axis include cleavage of ligand at the cell surface, ligand uptake by the receptor, and activation of receptor tyrosine kinase. TACE cleaves TGF-α and amphiregulin at the cell surface (8), and we now show that TACE is restricted to the basolateral surface of our polarizing CRC cell line, HCA-7, as well as in CRC tumors at the cell membrane. Furthermore, the results of our tissue array show that TACE is overexpressed in primary and metastatic CRC compared with normal colonic mucosa, and its expression is inversely related to TGF-α and amphiregulin expression. These findings are consistent with the increased cleavage of TGF-α and amphiregulin at the cell surface and activation of EGFR with overexpression of TACE in primary and metastatic CRC, further highlighting the importance of TACE as a potential target for EGFR inhibition in CRC. Amphiregulin expression, however, is greater than TGF-α expression in primary and metastatic CRC tissue. These findings are consistent with several other reports showing increased amphiregulin expression in CRC tumors (18–21). Furthermore, it has been suggested that amphiregulin is involved in autocrine growth of CRC cells through the EGFR via an extracellular autocrine loop (18, 25). The supranuclear staining pattern of amphiregulin in our tissue microarray is suggestive of a Golgi staining pattern consistent with an induction of amphiregulin transcription after cleavage by TACE. These findings suggest that TACE and amphiregulin may be the more important protease/ligand pair for EGFR activation in CRC and further suggest that TACE inhibition may provide a clinical benefit in these patients. Others have shown the importance of TACE and TGF-α, and not amphiregulin, in EGFR activation in breast cancer (14). Therefore, it suggests that different tumors are dependent on specific ligands for EGFR activation. We have recently shown TGF-α and amphiregulin can exhibit distinct biological effects in MDCK cells (26).
The importance of the spatial compartmentalization of the EGFR is also highlighted by our results showing a lack of response to the apical treatment of polarized HCA-7 cells with mAb528 and WAY-022, whereas basolateral delivery of these drugs results in inhibition of cell proliferation. Apical (as well as basolateral) treatment with EKI-785 did result in a decrease in cell proliferation of these polarized cells. An increase in apoptosis was also seen with EKI-785 but not with individual treatments of WAY-022 and mAb528 in cells grown on plastic. Being a small molecule, it is possible that EKI-785 is able to diffuse across membranes to reach the basolateral EGFR. Alternatively, a small number of EGFRs have been reported at the apical surface of polarized epithelial cells (27); however, we saw no growth-inhibitory effects when mAb528 was added to the apical compartment. WAY-022 is also a small molecule, but no growth-inhibitory effect was observed with its apical delivery. It is possible that WAY-022 may be cell-impermeant based on its molecular weight and hydrophobicity. Because TGF-α, amphiregulin, and TACE are restricted to the basolateral component of HCA-7 cells, this might also explain the lack of an effect that was seen with apical delivery of WAY-022. Taken together, these results underscore the biological and pharmacologic insights that can be gained by the compartment-selective delivery of drugs that target the EGFR axis in the context of polarized epithelial cells.
The EGFR axis has become an attractive therapeutic target in the treatment of several malignancies. However, the enthusiasm and potential value of blockade of EGFR has waned recently based on the negative results of several large-scale phase III clinical trials using TKIs in lung cancer (28, 29). The chimeric IgG1 antibody cetuximab has also been shown to have clinical activity in only 10% of patients with chemotherapy-resistant metastatic CRC (22, 23). We recently completed a trial using two doses of gefitinib, a reversible TKI, in patients with metastatic CRC and saw no response in the 115 patients treated (24). These trials were designed to inhibit single elements of the EGFR axis. The purpose of our study was to determine if blockade of multiple sites of the EGFR axis is more effective than inhibition at a single site. Furthermore, the emergence of drug resistance, especially with TKIs, remains a significant challenge in the employment of EGFR axis blockade. It can be argued that if there is no response to gefitinib in metastatic CRC, TKIs should not be used in the treatment of CRC. However, these results are seen using a reversible TKI. Our data suggests that the use of an irreversible TKI may have a significant effect on the treatment of CRC. To study this process, we developed an EKI-785–resistant strain of HCA-7 cells and now show that treatment of these cells with suboptimal concentrations of mAb528 and WAY-022 results in further growth inhibition.
Another factor that may contribute to the limited clinical activity observed with single-agent EGFR-directed therapy is the development of gastrointestinal toxicity, especially diarrhea, for the TKIs and skin rash for both classes of agents. These toxicities limit duration of drug administration. In a number of cases, the EGFR inhibitor had to be discontinued, even in responding patients, due to the persistence of these troubling side effects (24, 29–31). The ability of suboptimal doses of the drugs in combination showing cooperative growth inhibition, as seen in our study, may have a significant effect on reducing the clinical toxicity of these drugs and may overcome drug resistance.
Several recent reports using combined blockade of EGFR and its downstream signaling pathways suggest that this approach warrants further investigation (32, 33). A recent report by Huang et al., using dual-agent blockade of EGFR with cetuximab and gefitinib or erlotinib, showed enhanced growth inhibition and augmented inhibition of pEGFR, pMAPK, and pAKT over that observed with either agent alone in head and neck cancer cell lines (33). Furthermore, gefitinib or erlotinib retained the capacity to inhibit the growth of lung and head and neck tumor cells that were highly resistant to cetuximab, similar to the results of our enhanced growth inhibition with WAY-022 and mAb528 in our EKI-resistant CRC cell line, HCA-7. Similar to our results showing a limited inhibition of pMAPK with the combination of mAb528 and WAY-022, the results from the study by Huang et al. suggest that TKIs may further modulate intracellular signaling that is not fully blocked by extracellular anti-EGFR antibody treatment or by blockade of cell surface proteolytic processing of ligands. Similar findings were also recently reported by Matar and colleagues who found a synergistic growth-inhibitory effect in A431 cells in vitro using the combination of gefitinib and C225 (34).
The results of our study clearly show that combinations of drugs affecting different targets of the EGFR axis (EKI-785, mAb528, and WAY-022) result in cooperative growth inhibition and increased apoptosis at suboptimal doses of the individual drugs. Furthermore, our results show that TACE is a viable target of EGFR axis inhibition. This strategy would be flawed if TGF-α and amphiregulin were acting in a juxtacrine manner as suggested by the initial studies by Derynck and colleagues based on mutations of the protease cleavage sites of the ectodomain of TGF-α (35). We have examined cells expressing this construct and are able to measure soluble TGF-α in the media using a sensitive and specific TGF-α RIA.8 Further evidence for the lack of juxtacrine signaling by TGF-α are results from TACE knockout mice which show that TGF-α is found at the cell surface but is unable to signal during early development (8). Kenney and Bissell have further shown that amphiregulin and TGF-α work exclusively as soluble ligands and not in a juxtacrine manner (14).
Molecularly targeted therapies against the EGFR have emerged from the laboratory and have rapidly been integrated into the treatment of several malignancies. Due to the somewhat complementary mechanisms of inhibition of the EGFR signaling pathway and the potential for nonoverlapping mechanisms of drug resistance, our study has explored the biological effects of inhibiting EGFR at multiple points in its activation cascade. Our results suggest that lower doses of each drug may improve the therapeutic activity of the regimen by overcoming mechanisms of resistance that may be responsible for clinical inactivity observed with any one agent. Reducing EGFR-mediated signaling events with combined blockade of the EGFR axis may improve the treatment of human CRC and be applicable to the treatment of other solid neoplasms.
Acknowledgments
Grant support: Vanderbilt Physician Scientist Development grant (N.B. Merchant), the Vanderbilt GI Specialized Project of Research Excellence (P50 CA95103), and NCI grants CA46413 (R.J. Coffey) and DK59778 (P.J. Dempsey).
Footnotes
R.J. Coffey unpublished observations.
References
- 1.Lynch TJ, Bell DW, Sordella R, et al. Activating mutations in the epidermal growth factor receptor underlying responsiveness of non-small-cell lung cancer to gefitinib. N Engl J Med. 2004;350:2129–39. doi: 10.1056/NEJMoa040938. [DOI] [PubMed] [Google Scholar]
- 2.Paez JG, Janne PA, Lee JC, et al. EGFR mutations in lung cancer: correlation with clinical response to gefitinib therapy. Science. 2004;304:1497–500. doi: 10.1126/science.1099314. [DOI] [PubMed] [Google Scholar]
- 3.Cappuzzo F, Hirsch FR, Rossi E, et al. Epidermal growth factor receptor gene and protein and gefitinib sensitivity in non-small-cell lung cancer. J Natl Cancer Inst. 2005;97:643–55. doi: 10.1093/jnci/dji112. [DOI] [PubMed] [Google Scholar]
- 4.Pao W, Wang TY, Riely GJ, et al. KRAS mutations and primary resistance of lung adenocarcinomas to gefitinib or erlotinib. PLoS Med. 2005;2:e17. doi: 10.1371/journal.pmed.0020017. [DOI] [PMC free article] [PubMed] [Google Scholar]
- 5.Khambata-Ford S, Garrett CR, Meropol NJ, et al. Expression of epiregulin and amphiregulin and K-ras mutation status predict disease control in metastatic colorectal cancer patients treated with cetuximab. J Clin Oncol. 2007;25:3230–7. doi: 10.1200/JCO.2006.10.5437. [DOI] [PubMed] [Google Scholar]
- 6.Saltzman AK, Hartenbach EM, Carter JR, et al. Transforming growth factor-α levels in the serum and ascites of patients with advanced epithelial ovarian cancer. Gynecol Obstet Invest. 1999;47:200–4. doi: 10.1159/000010095. [DOI] [PubMed] [Google Scholar]
- 7.Cook PW, Pittelkow MR, Keeble WW, Graves-Deal R, Coffey RJ, Jr, Shipley GD. Amphiregulin messenger RNA is elevated in psoriatic epidermis and gastrointestinal carcinomas. Cancer Res. 1992;52:3224–7. [PubMed] [Google Scholar]
- 8.Peschon JJ, Slack JL, Reddy P, et al. An essential role for ectodomain shedding in mammalian development. Science. 1998;282:1281–4. doi: 10.1126/science.282.5392.1281. [DOI] [PubMed] [Google Scholar]
- 9.Sahin U, Weskamp G, Kelly K, et al. Distinct roles for ADAM10 and ADAM17 in ectodomain shedding of six EGFR ligands. J Cell Biol. 2004;164:769–79. doi: 10.1083/jcb.200307137. [DOI] [PMC free article] [PubMed] [Google Scholar]
- 10.Lee DC, Sunnarborg SW, Hinkle CL, et al. TACE/ ADAM17 processing of EGFR ligands indicates a role as a physiological convertase. Ann N Y Acad Sci. 2003;995:22–38. doi: 10.1111/j.1749-6632.2003.tb03207.x. [DOI] [PubMed] [Google Scholar]
- 11.Threadgill DW, Dlugosz AA, Hansen LA, et al. Targeted disruption of mouse EGF receptor: effect of genetic background on mutant phenotype. Science. 1995;269:230–4. doi: 10.1126/science.7618084. [DOI] [PubMed] [Google Scholar]
- 12.Brown CL, Meise KS, Plowman GD, Coffey RJ, Dempsey PJ. Cell surface ectodomain cleavage of human amphiregulin precursor is sensitive to a metalloprotease inhibitor. Release of a predominant N-glycosylated 43-kDa soluble form. J Biol Chem. 1998;273:17258–68. doi: 10.1074/jbc.273.27.17258. [DOI] [PubMed] [Google Scholar]
- 13.Sunnarborg SW, Hinkle CL, Stevenson M, et al. Tumor necrosis factor-α converting enzyme (TACE) regulates epidermal growth factor receptor ligand availability. J Biol Chem. 2002;277:12838–45. doi: 10.1074/jbc.M112050200. [DOI] [PubMed] [Google Scholar]
- 14.Kenny PA, Bissell MJ. Targeting TACE-dependent EGFR ligand shedding in breast cancer. J Clin Invest. 2007;117:337–45. doi: 10.1172/JCI29518. [DOI] [PMC free article] [PubMed] [Google Scholar]
- 15.Coffey RJ, Hawkey CJ, Damstrup L, et al. Epidermal growth factor receptor activation induces nuclear targeting of cyclooxygenase-2, basolateral release of prostaglandins, and mitogenesis in polarizing colon cancer cells. Proc Natl Acad Sci U S A. 1997;94:657–62. doi: 10.1073/pnas.94.2.657. [DOI] [PMC free article] [PubMed] [Google Scholar]
- 16.Chinery R, Coffey RJ, Graves-Deal R, et al. Prostaglandin J2 and 15-deoxy-δ12,14-prostaglandin J2 induce proliferation of cyclooxygenase-depleted colorectal cancer cells. Cancer Res. 1999;59:2739–46. [PubMed] [Google Scholar]
- 17.Dempsey PJ, Coffey RJ. Basolateral targeting and efficient consumption of transforming growth factor-α when expressed in Madin-Darby canine kidney cells. J Biol Chem. 1994;269:16878–89. [PubMed] [Google Scholar]
- 18.Johnson GR, Saeki T, Gordon AW, Shoyab M, Salomon DS, Stromberg K. Autocrine action of amphiregulin in a colon carcinoma cell line and immunocytochemical localization of amphiregulin in human colon. J Cell Biol. 1992;118:741–51. doi: 10.1083/jcb.118.3.741. [DOI] [PMC free article] [PubMed] [Google Scholar]
- 19.Saeki T, Stromberg K, Qi CF, et al. Differential immunohistochemical detection of amphiregulin and cripto in human normal colon and colorectal tumors. Cancer Res. 1992;52:3467–73. [PubMed] [Google Scholar]
- 20.Ciardiello F, Kim N, Saeki T, et al. Differential expression of epidermal growth factor-related proteins in human colorectal tumors. Proc Natl Acad Sci US A. 1991;88:7792–6. doi: 10.1073/pnas.88.17.7792. [DOI] [PMC free article] [PubMed] [Google Scholar]
- 21.DeAngelis E, Grassi M, Gullick WJ, et al. Expression of cripto and amphiregulin in colon mucosa from high risk coloncancer families. Int J Oncol. 1999;14:437–40. doi: 10.3892/ijo.14.3.437. [DOI] [PubMed] [Google Scholar]
- 22.Cunningham D, Humblet Y, Siena S, et al. Cetuximab monotherapy and cetuximab plus irinotecan in irinote-can-refractory metastatic colorectal cancer. N Engl J Med. 2004;351:337–45. doi: 10.1056/NEJMoa033025. [DOI] [PubMed] [Google Scholar]
- 23.Costa AF, Sander GB, Picon PD. Cetuximab in colon cancer. N Engl J Med. 2004;351:1575–6. [PubMed] [Google Scholar]
- 24.Rothenberg ML, LaFleur B, Levy DE, et al. Randomized phase II trial of the clinical and biological effects of two dose levels of gefitinib in patients with recurrent colorectal adenocarcinoma. J Clin Oncol. 2005;23:9265–74. doi: 10.1200/JCO.2005.03.0536. [DOI] [PubMed] [Google Scholar]
- 25.Shao J, Lee SB, Guo H, Evers BM, Sheng H. Prostaglandin E2 stimulates the growth of colon cancer cells via induction of amphiregulin. Cancer Res. 2003;63:5218–23. [PubMed] [Google Scholar]
- 26.Chung E, Graves-Deal R, Franklin JL, Coffey RJ. Differential effects of amphiregulin and TGF-α on the morphology of MDCK cells. Exp Cell Res. 2005;309:149–60. doi: 10.1016/j.yexcr.2005.05.012. [DOI] [PubMed] [Google Scholar]
- 27.Chen MC, Solomon TE, Kui R, Soll AH. Apical EGF receptors regulate epithelial barrier to gastric acid: endogenous TGF-α is an essential facilitator. Am J Physiol Gastro intest Liver Physiol. 2002;283:G1098–106. doi: 10.1152/ajpgi.00507.2001. [DOI] [PubMed] [Google Scholar]
- 28.Giaccone G, Herbst RS, Manegold C, et al. Gefitinib in combination with gemcitabine and cisplatin in advanced non-small-cell lung cancer: a phase III trial. INTACT1 J Clin Oncol. 2004;22:777–84. doi: 10.1200/JCO.2004.08.001. [DOI] [PubMed] [Google Scholar]
- 29.Herbst RS, Giaccone G, Schiller JH, et al. Gefitinib in combination with paclitaxel and carboplatin in advanced non-small-cell lung cancer: a phase III trial. INTACT 2 J Clin Oncol. 2004;22:785–94. doi: 10.1200/JCO.2004.07.215. [DOI] [PubMed] [Google Scholar]
- 30.Needle MN. Safety experience with IMC-C225, an anti-epidermal growth factor receptor antibody. Semin Oncol. 2002;29:55–60. doi: 10.1053/sonc.2002.35648. [DOI] [PubMed] [Google Scholar]
- 31.Baselga J, Rischin D, Ranson M, et al. Phase I safety, pharmacokinetic, and pharmacodynamic trial of ZD1839, a selective oral epidermal growth factor receptor tyrosine kinase inhibitor, in patients with five selected solid tumor types. J Clin Oncol. 2002;20:4292–302. doi: 10.1200/JCO.2002.03.100. [DOI] [PubMed] [Google Scholar]
- 32.Fan QW, Specht KM, Zhang C, Goldenberg DD, Shokat KM, Weiss WA. Combinatorial efficacy achieved through two-point blockade within a signaling pathway. a chemical genetic approach. Cancer Res. 2003;63:8930–8. [PubMed] [Google Scholar]
- 33.Huang S, Armstrong EA, Benavente S, Chinnaiyan P, Harari PM. Dual-agent molecular targeting of the epidermal growth factor receptor (EGFR): combining anti-EGFR antibody with tyrosine kinase inhibitor. Cancer Res. 2004;64:5355–62. doi: 10.1158/0008-5472.CAN-04-0562. [DOI] [PubMed] [Google Scholar]
- 34.Matar P, Rojo F, Cassia R, et al. Combined epidermal growth factor receptor targeting with the tyrosine kinase inhibitor gefitinib (ZD1839) and the monoclonal antibody cetuximab (IMC-C225): superiority over single-agent receptor targeting. Clin Cancer Res. 2004;10:6487–501. doi: 10.1158/1078-0432.CCR-04-0870. [DOI] [PubMed] [Google Scholar]
- 35.Brachmann R, Lindquist PB, Nagashima M, et al. Transmembrane TGF-α precursors activate EGF/TGF-α receptors. Cell. 1989;56:691–700. doi: 10.1016/0092-8674(89)90591-6. [DOI] [PubMed] [Google Scholar]