

Abstract
Background
Indwelling urinary catheters may lead to both infectious and non-infectious complications and are often used in the hospital setting without an appropriate indication. The objective of this study was to evaluate the results of a statewide quality improvement effort to reduce inappropriate urinary catheter use.
Methods
Retrospective analysis of data collected between 2007 and 2010 as part of a statewide collaborative initiative before, during, and after an educational intervention-promoting adherence to appropriate urinary catheter indications. The data was collected from 163 inpatient units in 71 participating Michigan hospitals. The intervention consisted of engaging clinicians about the appropriate indications for urinary catheter use and promoting the daily assessment of urinary catheter necessity during daily nursing rounds. The main outcome measures were change in prevalence of urinary catheter use and adherence with appropriate indications. We used flexible generalized estimating equation (GEE) and multilevel methodology to estimate rates over time while accounting for the clustering of patients within hospital units.
Results
The urinary catheter utilization rate decreased from 18.1% (95% CI: 16.8–19.6) at baseline to 13.8% (95% CI: 12.9–14.8) at end of year 2 (p <0.001). The proportion of catheterized patients with appropriate indications increased from 44.3% (95% CI: 40.3–48.4) to 57.6% (95% CI: 51.7–63.4) by the end of year 2 (p = 0.005).
Conclusions
A statewide effort to reduce inappropriate urinary catheter utilization was associated with a significant reduction in catheter use and improved compliance with appropriate use. The effect of the intervention was sustained for at least 2 years. Word count: 249
Keywords: urinary catheter, device utilization, healthcare-associated infection, patient safety
Introduction
Urinary tract infection accounts for a large portion of all hospital-acquired infections,1 with catheter-associated urinary tract infection (CAUTI) representing the majority of these cases.2 CAUTI has been classified as a “reasonably preventable” hospital-acquired condition by the Centers for Medicare and Medicaid Services (CMS); CMS no longer reimburses hospitals for this condition.3 Among the most effective approaches for reducing CAUTI is using a urinary catheter only when an appropriate indication is present.4 Assessing whether there is an appropriate indication for catheter use should be part of the initial decision for placement as well as part of an ongoing process for determining the continuing need for a catheter throughout the hospital stay.4 Prior studies reveal that interventions promoting awareness of the presence of an indwelling catheter and timely removal have been associated with a reduction in inappropriate urinary catheter use and CAUTI. Most studies, however, have evaluated interventions at a single site6–10; the effectiveness of a larger-scale intervention to promote appropriate catheter use has yet to be determined. Moreover, the extent to which improvements might be sustained for substantial periods of time remains unclear. In 2008, the Michigan Health & Hospital Association (MHA) Keystone Center implemented a state-wide program to reduce the unnecessary use of urinary catheters in Michigan hospitals.11 The program was based on an intervention developed by one Michigan hospital in which nurse-led multidisciplinary rounds were used to prompt removal of unnecessary catheters, leading to a 45% reduction in inappropriate catheter use.8 The purpose of the current study was to evaluate the effect of the MHA Keystone program on urinary catheter use among participating Michigan hospitals and to assess multi-year sustainability.
Methods
We conducted a retrospective review of the MHA data collected as part of the CAUTI prevention initiative over a period of over 3 years (2007–2010). All Michigan hospitals and their respective inpatient units (primarily medical-surgical, non-intensive care units) were eligible for participation and were encouraged to enroll. For each participating hospital, we obtained de-identified data on catheter utilization and the reason for use from the Web-based MHA data system “Care Counts” which was also used by hospitals to follow up on their progress over time.
Before starting the intervention, key hospital leaders were informed of the study and asked for their support. Hospitals were encouraged to disseminate the information regarding the intervention to physicians and nurses. Hospitals were asked to form a team to implement the process. The team included a nursing champion (educates the patient-care nurses and triggers the evaluation for urinary catheter necessity on the participating unit), a physician champion (obtains physician support for the initiative), an infection preventionist (addresses the infectious complications related to the urinary catheter), and other stakeholders (quality improvement, case managers, patient care assistants, nurse educators). Hospitals formed their teams based on their resources. Multiple webinars were given to the participating teams. The initial webinar addressed the infectious and non-infectious risks with urinary catheter use, the appropriate indications for urinary catheter use and common situations where the catheter is used inappropriately. It also addressed the proper insertion technique and maintenance of the urinary catheter. The main message was to evaluate daily the urinary catheter for need. The second webinar included a detailed description of “how to implement the process” at each facility. We suggested to hospitals to consider involving units with high urinary catheter utilization and increased unnecessary utilization; however, each hospital made the decision on choosing the unit involved. Initially, each unit involved collected baseline data on urinary catheter utilization and appropriateness (week 1); this was followed by the education of nurses on evaluating patients for urinary catheter presence and need during nursing or multidisciplinary, unit-based rounds (weeks 2–3). Nurses were encouraged to evaluate the presence and need for the catheter during nursing rounds and contact the physician if no appropriate indication is present. Following the intensive intervention periods, catheter utilization was tracked and evaluated over time (at 8- and then 12-week intervals), and appropriate practices were reinforced. A healthcare worker from each facility collected all the data prospectively including the number of patients on the unit, presence of the catheter, and the reason for utilization. Appropriate indications for catheter utilization were defined based on the 1983 Center for Disease Control and Prevention (CDC) recommendations12 (issued prior to the new CDC Healthcare Infection Control Practices Advisory Committee (HICPAC) guidelines4). The appropriate indications included: urinary tract obstruction, neurogenic bladder dysfunction and urinary retention, and urologic studies or surgery on contiguous structures. In addition, urinary catheter use was considered appropriately indicated for patients with urinary incontinence and stage III or IV sacral pressure ulcers, and for end-of-life care. Continued feedback was given to the units on their performance (i.e., any changes in urinary catheter utilization and compliance with the appropriate indications). Teams were able to calculate through “MHA Care Counts” their total and appropriate urinary catheter utilization. Appropriate catheter-days were calculated by summing all catheter-days used based on the different appropriate indications. Support to hospitals was provided by the use of multiple coaching calls to existing teams and additional webinars were presented to newly participating hospitals. All webinars were open to all the teams. Finally, a “Bladder Bundle” manual was distributed to all participating hospitals; it included a step-by-step description of the process, educational materials to staff (including posters and pocket cards), examples of policies, and information about barriers and facilitators.
We used generalized estimating equation (GEE) methods13 to estimate population average rates of catheter utilization (urinary catheter-days / patient-days) and appropriate catheterization (appropriate catheter-days / catheter-days), and multilevel models with empirical Bayes prediction14 to explore unit-specific rates. Population average rates capture trends across rather than within hospital units, and can be viewed as a weighted average of unit-specific rates. Both GEE and multilevel approaches account for clustering of patients within units, and empirical Bayes methodology accounts for differential sample sizes across units by shrinking less reliable unit-specific estimates towards the overall mean. In order to allow for non-linearity across time, we modeled population average rates as a function of continuous time (from baseline) using natural cubic splines with five knots. The clustered robust (or “sandwich”) variance estimator was used to account for correlation among patients within hospital units. 15 Multilevel models allowed intercepts and slopes to vary randomly across units, and assumed a linear relationship between rates and log-transformed time (log-transformation was deemed to be sufficient via likelihood ratio tests for more complicated spline structure). Odds ratios for specific units comparing week 20 to baseline were calculated using multilevel model empirical Bayes predictions; for this analysis we used only those units that collected data for up to 20 weeks. Both GEE and multilevel analyses were done at the patient level rather than at the unit level, and models did not include covariates (besides time from baseline) since covariate data were not collected and interest centered on urinary catheter prevalence. Units that failed to collect data for any of the first 3 weeks (i.e., during baseline or intervention) were excluded from analysis.
The St. John Hospital and Medical Center Institutional Review Board approved the study prior to all data analysis.
Results
A total of 194,162 patient-days of data were collected across 163 units within 71 acute care hospitals (55% of 130 eligible Michigan hospitals). Urinary catheters were utilized for a total of 29,990 patient-days (15.4%) across the study period. Most units (127/163 or 77.9%) collected data for at least 80% of the maximum possible follow-up time, and a majority collected data for at least 90% of the maximum (105/163 or 64.4%) (Figure 1); in other words, most missing data was a result of administrative censoring rather than potentially biasing dropout.
Figure 1.

Duration of data collection for individual units, by calendar time and follow-up time
The average urinary catheter utilization rate decreased from 18.1% (95% CI: 16.8–19.6) at baseline to 17.2% (95% CI: 16.0–18.4; p = 0.011) at week 3 (the second week of the intervention), representing a statistically significant 6% decrease in the odds of catheter use. The rate decreased to 15.9% (95% CI: 14.7–17.2; p <0.001) by week 8, and to 14.8% (95% CI: 13.6–16.0; p <0.001) by week 20 (Table 1 and Figure 2). The proportion of appropriately indicated catheter-days increased from 44.3% (95% CI: 40.3–48.4) at baseline to 46.8% (95% CI: 42.6–51.0; p <0.001) at week 3 (the second week of the intervention), representing an 11% increase in the odds of appropriately indicated catheter use. By weeks 8 and 20, the proportion had increased to 50.4% (95% CI: 45.4–55.4; p <0.001) and 53.5% (95% CI: 48.7–58.4; p <0.001), respectively (Table 1 and Figure 2). Two years after baseline, the catheter utilization rate was 13.8% (95% CI: 12.9–14.8; p <0.001) and appropriate catheterization increased to 57.6% (95% CI: 51.7–63.4; p = 0.005). However, estimates after week 104 are relatively unreliable due to limited data collection (Table 1, Figures 1 and 2). Table 2 illustrates the crude distribution of the indications (both appropriate and inappropriate) for urinary catheter use at weeks 1, 3, 8 and 20.
Table 1.
Rates and confidence intervals for catheter utilization and appropriate catheterization
| Time1 | # Units Collecting Data2 (%) | Catheter Utilization | Appropriate Catheterization | ||
|---|---|---|---|---|---|
| Rate, % | 95% CI | Rate, % | 95% CI | ||
| Baseline | |||||
| Day 0 (Wk 1) | 163 (100%) | 18.1 | 16.8–19.6 | 44.3 | 40.3–48.4 |
|
| |||||
| Intervention | |||||
|
| |||||
| Day 11 (Wk 2) | 163 (100%) | 17.5 | 16.3–18.8 | 45.9 | 41.8–50.0 |
|
| |||||
| Day 18 (Wk 3) | 163 (100%) | 17.2 | 16.0–18.4 | 46.8 | 42.6–51.0 |
|
| |||||
| Post-Intervention | |||||
|
| |||||
| Day 53 (Wk 8) | 162 (99%) | 15.9 | 14.7–17.2 | 50.4 | 45.4–55.4 |
|
| |||||
| Day 137 (Wk 20) | 154 (94%) | 14.8 | 13.6–16.0 | 53.5 | 48.7–58.4 |
|
| |||||
| Day 221 (Wk 32) | 144 (88%) | 14.9 | 13.8–16.2 | 53.0 | 48.7–57.3 |
|
| |||||
| Day 305 (Wk 44) | 122 (75%) | 15.0 | 13.8–16.3 | 52.8 | 48.1–57.5 |
|
| |||||
| Day 389 (Wk 56) | 113 (69%) | 14.8 | 13.8–15.9 | 53.4 | 48.5–58.3 |
|
| |||||
| Day 473 (Wk 68) | 103 (63%) | 14.5 | 13.6–15.6 | 54.4 | 49.1–59.7 |
|
| |||||
| Day 557 (Wk 80) | 98 (60%) | 14.3 | 13.4–15.2 | 55.5 | 49.9–60.9 |
|
| |||||
| Day 641 (Wk 92) | 87 (53%) | 14.0 | 13.2–15.0 | 56.5 | 50.9–62.0 |
|
| |||||
| Day 725 (Wk 104) | 78 (48%) | 13.8 | 12.9–14.8 | 57.6 | 51.7–63.4 |
|
| |||||
| Day 809 (Wk 116) | 58 (36%) | 13.6 | 12.4–14.9 | 58.7 | 51.8–65.3 |
|
| |||||
| Day 893 (Wk 128) | 37 (23%) | 13.4 | 11.8–15.1 | 59.8 | 51.2–67.8 |
|
| |||||
| Day 977 (Wk 140) | 22 (13%) | 13.2 | 11.2–15.4 | 60.9 | 50.2–70.6 |
|
| |||||
| Day 1061 (Wk 152) | 13 (8%) | 13.0 | 10.6–15.7 | 61.9 | 49.0–73.4 |
|
| |||||
| Day 1152 (Wk 165) | 9 (6%) | 12.7 | 10.0–16.1 | 63.1 | 47.6–76.3 |
|
| |||||
| Day 1243 (Wk 178) | 5 (3%) | 12.5 | 9.4–16.5 | 64.2 | 46.1–79.0 |
|
| |||||
| Day 1332 (Wk 190) | 4 (2%) | 12.3 | 8.8–17.0 | 65.3 | 44.5–81.5 |
Results are shown for days at the end of “data collection weeks” (weeks when the majority of remaining hospitals contributed data).
After excluding any units that failed to collect data throughout the first three weeks (i.e., during baseline and intervention weeks)
Figure 2. Rates of catheter utilization and appropriate catheterization across time.
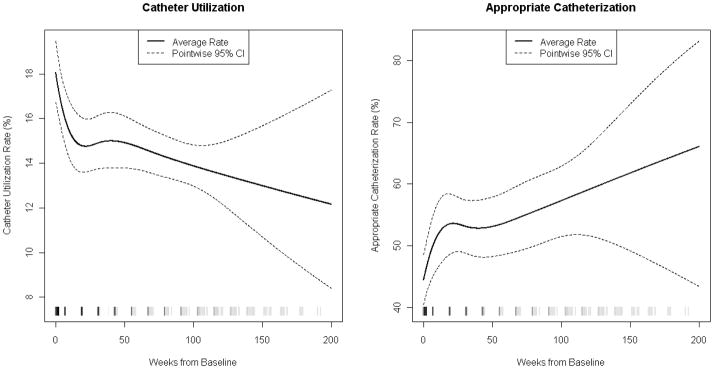
Note: The tick marks at the x-axis denote times at which data were collected; the darkness of the tick marks reflects the number of units contributing data (darker means more units and lighter means fewer units, with black representing all units and white representing no units).
Table 2.
Reasons for catheter utilization across time (raw percentages)
| Reason | Week 1 | Week 3 | Week 8 | Week 20 |
|---|---|---|---|---|
| Appropriate, % | ||||
| Urinary tract obstruction | 6.3 | 7.1 | 7.9 | 7.1 |
| Neurogenic bladder | 9.9 | 11.7 | 12.3 | 10.8 |
| Urologic study or surgery on contiguous structures | 13.7 | 17.7 | 17.7 | 19.0 |
| Sacral pressure ulcer (stage III or IV) with incontinence | 5.9 | 6.4 | 6.0 | 6.0 |
| End-of-life care | 6.6 | 8.6 | 6.8 | 8.7 |
| Total appropriate, % | 42.4 | 51.5 | 50.7 | 51.6 |
| Inappropriate, % | ||||
| Non-obstructive renal insufficiency | 2.2 | 1.6 | 1.3 | 1.1 |
| Transferred from intensive care | 4.2 | 3.9 | 3.9 | 6.1 |
| Patient request | 1.5 | 1.3 | 1.4 | 1.7 |
| Confusion | 4.6 | 3.2 | 3.3 | 3.0 |
| Incontinence | 6.5 | 5.2 | 4.6 | 4.5 |
| Other or no clear reasons | 38.6 | 33.3 | 34.8 | 32.0 |
| Total inappropriate, % | 57.6 | 48.5 | 49.3 | 48.4 |
| Total catheterized, n | 3,934 | 3,083 | 2,903 | 2,606 |
Note: The rates of appropriate catheterization given in Table 1 are estimated at specific time points and arise from modeling the rate of appropriateness as a continuous function across time (see Figure 1). In contrast, for this table the observed data is binned by week and simple percentages are computed; as a result, the raw rates presented here should not agree exactly with the estimated rates given in Table 1.
From baseline to week 20 (and for units with data up to week 20), the top decile of units in terms of decreased odds of catheter use had estimated odds ratios ranging between 0.48 and 0.25, while the top decile of units in terms of increased odds of appropriate catheter utilization (not necessarily the same as the previous decile) had estimated odds ratios ranging between 5.06 and 10.92. Such performance may represent best-case scenarios for response to the interventions. Conversely, the bottom decile of units had odds ratios for increases in catheter utilization ranging between 1.22 and 1.88, and odds ratios for decreases in appropriate catheterization ranging between 0.36 and 0.04 during this time period. The median units, however, had odds ratios of 0.80 for catheter utilization and 1.71 for appropriate catheterization. This decrease in utilization and increase in appropriate catheterization is aligned with the results seen in the GEE analysis (where the corresponding ORs were 0.79 and 1.45, respectively). Figure 3 shows the odds ratios for catheter utilization and appropriate catheterization for units with data for both quantities up until at least week 20. This figure indicates that high-performing units with respect to catheter utilization (i.e., those with low odds ratios) were not necessarily high-performing units with respect to appropriate catheterization (i.e., those with high odds ratios); however, most units (56.6%) that continued to collect data until week 20 saw both a decrease in catheter utilization and an increase in appropriate catheterization.
Figure 3.

The relationship between catheter utilization and appropriate catheterization
Discussion
We examined the results of a statewide quality improvement initiative among a large cohort of hospitals that implemented an intervention to evaluate the presence and appropriate use of urinary catheters. Overall, the intervention led to a significant reduction in utilization and an improvement in the appropriateness of use. Our results largely parallel the improvement seen when the intervention was piloted in a single hospital. 8 The improvement in urinary catheter utilization was apparent within the first 2 weeks of the intervention, and the progressive improvement in utilization continued throughout the study period from a baseline rate of 18.1% to 13.8% at year 2. This translates to an overall 28% reduction in the odds of catheter use. Our results show that Michigan hospitals were able to reduce utilization significantly to levels that are comparable to the NHSN reported 25th percentile for medical-surgical inpatient wards for urinary catheter utilization. 16
Avoiding initial placement and reducing the duration of catheterization is associated with fewer infectious complications. Previous studies have shown that urinary catheter reminders and stop orders leading to a reduction in utilization were associated with a significant reduction in CAUTI.5 In addition to reducing the infection risk, promoting the appropriate use of the catheter may lead to fewer non-infectious complications, such as urethral injury. 17 Moreover, the patient may experience less discomfort and be free of the restraints brought by the catheter. 18,19 The appropriate use of urinary catheters also improved significantly over the course of the study. By year 2, the odds of appropriate placement among those with urinary catheters increased by 71% compared to baseline. Despite this significant improvement, appropriate utilization (based on the 1983 CDC guidelines12) reached only 57.6% at year 2. While this suggests that there may be further opportunity for improvement, the 1983 CDC12 and the newer HICPAC4 guidelines are consensus-based and may not be inclusive of all conditions where the catheter may be required.
We observed between-unit variation in response to the intervention. Possible differences between high- and low-performing hospitals might include varying levels of commitment from each institution to make this effort a high priority, or differential involvement of champions to support the effort.20 External forces influencing the decision to fully adopt safe processes may also play an important role, whether related to public reporting or financial incentives.20 Moreover, organizations have different contextual characteristics; hospitals with a strong emotional commitment to patient care and an active clinical leadership provide a milieu favorable to quality improvement activities.21 In contrast, while some hospitals lacking emotional commitment to patient care or with weak leadership support may respond favorably to externally facilitated initiatives, such as the Keystone CAUTI program, others may face substantial barriers that inhibit implementing evidence-based practices in their institution.21
Our findings should be interpreted in the context of the following limitations. First, not all hospitals collected data throughout the entire study period, mostly due to staggered start times. Although we did observe continued decreases in catheter use and increases in appropriately indicated catheters in those placed throughout the 3-year study period, fewer than half of the units collected data for more than 2 years. If low-performing hospitals were more likely to discontinue data collection or more likely to start the study later, our results could be misleading. Still, most hospital units collected data through 20–30 weeks after intervention, so immediate effects of the intervention are unlikely to be compromised by such selection bias. Further, discontinued data collection largely resulted from the ending of the study (administrative censoring) rather than unit dropout. Second, we did not have data for a control group of hospitals that did not receive the intervention; thus, the possibility exists that some portion of the effects would have occurred even without the intervention. For example, some hospitals may have established programs to reduce the risk for CAUTI in response to the CMS non-reimbursement. However, due to the complexity of coding cases of hospital-acquired CAUTI, errors in coding may underestimate the number and lessen the financial impact on hospitals.22 Additionally, our results may not be universally generalizable since hospitals self-selected into the study and units that were enrolled in the study were chosen by individual hospitals, rather than selected at random. Finally, we only explored the process measures of urinary catheter utilization and appropriateness of urinary catheter placement, as we did not have data available to investigate the influence of the intervention on infectious or non-infectious outcomes.
Limitations notwithstanding, the MHA Keystone initiative was successful in reducing urinary catheter use and increasing appropriateness of catheterization in a large number of hospitals throughout the state of Michigan. Our results indicate that hospitals can improve appropriate urinary catheter use and that such efforts can be successfully implemented on a broad scale. Our findings may help motivate and guide other hospitals to undergo similar intervention programs to reduce inappropriate catheter use and collectively achieve the Department of Health and Human Services’23 goal of reducing CAUTI rates by 25% by 2013.
Acknowledgments
We thank Mr. Andrew Hickner for his review of the manuscript.
Dr. Fakih was responsible for study conception and design, acquisition of data, drafting of the manuscript, and administrative, technical and material support. Mr. Watson was responsible for acquisition of data, and administrative, technical and material support. Dr. Greene was responsible for study conception and design, analysis and interpretation of data, drafting of the manuscript, and statistical analysis. Mr. Kennedy was responsible for responsible for study conception and design, analysis and interpretation of data, drafting of the manuscript, and statistical analysis. Mr. Olmsted was responsible for interpretation of data, critical revision of manuscript for intellectual content, and administrative, technical and material support. Dr. Krein was responsible for interpretation of data and critical revision of manuscript for intellectual content. Dr. Saint was responsible for study conception and design, interpretation of data, critical revision of manuscript for intellectual content, and supervision.
Dr. Fakih has a subcontract to implement multi-state CAUTI prevention with the Agency for Healthcare Research and Quality/Health Educational and Research Trust. Mr. Watson has a contract to implement statewide CAUTI prevention with the Agency for Healthcare Research and Quality/Health Educational and Research Trust. Dr. Greene is a project manager on a multi-state CAUTI prevention project with the Agency for Healthcare Research and Quality/Health Educational and Research Trust. Mr. Kennedy has no potential conflicts of interest to disclose. Mr. Olmsted has provided professional consulting services to Arizant Healthcare, Bard Medical Division, ECOLAB, and Mintie. He has also served as faculty for presentations sponsored by Advanced Sterilization Products, Baxter Healthcare, BD, CareFusion, Ethicon, and several not-for-profit organizations. Mr. Olmsted is also serving as an expert consultant on an extended faculty group for a multi-state CAUTI prevention project with the Agency for Healthcare Research and Quality/Health Educational and Research Trust. Dr. Krein has a subcontract to implement multi-state CAUTI prevention with the Agency for Healthcare Research and Quality/Health Educational and Research Trust. Dr. Saint has a subcontract to implement multi-state CAUTI prevention with the Agency for Healthcare Research and Quality/Health Educational and Research Trust. He has also received numerous honoraria and travel reimbursement from hospitals, academic medical centers, specialty societies, state societies (including the Michigan Health & Hospital Association), and other nonprofit organizations (including the Institute for Healthcare Improvement) for speaking about healthcare-associated infection prevention
Contributor Information
Mohamad G. Fakih, St John Hospital and Medical Center, and Wayne State University School of Medicine, Detroit, MI.
Sam R Watson, Michigan Health & Hospital Association, Lansing, MI.
M. Todd Greene, University of Michigan Health System, Ann Arbor, MI.
Edward H. Kennedy, VA Ann Arbor Health Care System and the University of Michigan Health System, Ann Arbor, MI.
Russell N. Olmsted, Saint Joseph Mercy Health System, Ann Arbor, MI.
Sarah L. Krein, VA Ann Arbor Health Care System and the University of Michigan Health System, Ann Arbor, MI.
Sanjay Saint, Hospital Outcomes Program of Excellence (HOPE) - VA Ann Arbor Health Care System and the University of Michigan Health System, Ann Arbor, MI.
References
- 1.Klevens RM, Edwards JR, Richards CL, Jr, et al. Estimating health care-associated infections and deaths in U.S hospitals, 2002. Public Health Rep. 2007;122(2):160–166. doi: 10.1177/003335490712200205. [DOI] [PMC free article] [PubMed] [Google Scholar]
- 2.Chenoweth CE, Saint S. Urinary tract infections. Infect Dis Clin North Am. 2011;25(1):103–115. doi: 10.1016/j.idc.2010.11.005. [DOI] [PubMed] [Google Scholar]
- 3.Saint S, Meddings JA, Calfee D, Kowalski CP, Krein SL. Catheter-associated urinary tract infection and the Medicare rule changes. Ann Intern Med. 2009;150(12):877–884. doi: 10.7326/0003-4819-150-12-200906160-00013. [DOI] [PMC free article] [PubMed] [Google Scholar]
- 4.Gould C, Umscheid C, Agarwal R, Kuntz G, Pegues D. Guideline for Prevention of Catheter-Associated Urinary Tract Infections 2009. Infect Control Hosp Epidemiol. 2010;31(4):319–326. doi: 10.1086/651091. [DOI] [PubMed] [Google Scholar]
- 5.Meddings J, Rogers MA, Macy M, Saint S. Systematic review and meta-analysis: reminder systems to reduce catheter-associated urinary tract infections and urinary catheter use in hospitalized patients. Clin Infect Dis. 2010;51(5):550–560. doi: 10.1086/655133. [DOI] [PubMed] [Google Scholar]
- 6.Apisarnthanarak A, Thongphubeth K, Sirinvaravong S, et al. Effectiveness of multifaceted hospitalwide quality improvement programs featuring an intervention to remove unnecessary urinary catheters at a tertiary care center in Thailand. Infect Control Hosp Epidemiol. 2007;28(7):791–798. doi: 10.1086/518453. [DOI] [PubMed] [Google Scholar]
- 7.Crouzet J, Bertrand X, Venier AG, Badoz M, Husson C, Talon D. Control of the duration of urinary catheterization: impact on catheter-associated urinary tract infection. J Hosp Infect. 2007;67(3):253–257. doi: 10.1016/j.jhin.2007.08.014. [DOI] [PubMed] [Google Scholar]
- 8.Fakih MG, Dueweke C, Meisner S, et al. Effect of nurse-led multidisciplinary rounds on reducing the unnecessary use of urinary catheterization in hospitalized patients. Infect Control Hosp Epidemiol. 2008;29(9):815–819. doi: 10.1086/589584. [DOI] [PubMed] [Google Scholar]
- 9.Huang WC, Wann SR, Lin SL, et al. Catheter-associated urinary tract infections in intensive care units can be reduced by prompting physicians to remove unnecessary catheters. Infect Control Hosp Epidemiol. 2004;25(11):974–978. doi: 10.1086/502329. [DOI] [PubMed] [Google Scholar]
- 10.Saint S, Kaufman SR, Thompson M, Rogers MA, Chenoweth CE. A reminder reduces urinary catheterization in hospitalized patients. Jt Comm J Qual Patient Saf. 2005;31(8):455–462. doi: 10.1016/s1553-7250(05)31059-2. [DOI] [PubMed] [Google Scholar]
- 11.Saint S, Olmsted RN, Fakih MG, et al. Translating health care-associated urinary tract infection prevention research into practice via the Bladder Bundle. Jt Comm J Qual Patient Saf. 2009;35(9):449–455. doi: 10.1016/s1553-7250(09)35062-x. [DOI] [PMC free article] [PubMed] [Google Scholar]
- 12.Wong ES. Guideline for prevention of catheter-associated urinary tract infections. Am J Infect Control. 1983;11(1):28–36. doi: 10.1016/s0196-6553(83)80012-1. [DOI] [PubMed] [Google Scholar]
- 13.Zeger SL, Liang KY. Longitudinal data analysis for discrete and continuous outcomes. Biometrics. 1986;42(1):121–130. [PubMed] [Google Scholar]
- 14.Laird NM, Ware JH. Random-effects models for longitudinal data. Biometrics. 1982;38(4):963–974. [PubMed] [Google Scholar]
- 15.Williams RL. A note on robust variance estimation for cluster-correlated data. Biometrics. 2000;56(2):645–646. doi: 10.1111/j.0006-341x.2000.00645.x. [DOI] [PubMed] [Google Scholar]
- 16.Dudeck MA, Horan TC, Peterson KD, et al. National Healthcare Safety Network (NHSN) report, data summary for 2009, device-associated module. Am J Infect Control. 2011;39(5):349–367. doi: 10.1016/j.ajic.2011.04.011. [DOI] [PubMed] [Google Scholar]
- 17.Aaronson DS, Wu AK, Blaschko SD, McAninch JW, Garcia M. National incidence and impact of noninfectious urethral catheter related complications on the Surgical Care Improvement Project. J Urol. 2011;185(5):1756–1760. doi: 10.1016/j.juro.2010.12.041. [DOI] [PubMed] [Google Scholar]
- 18.Saint S, Lipsky BA, Goold SD. Indwelling urinary catheters: a one-point restraint? Ann Intern Med. 2002;137(2):125–127. doi: 10.7326/0003-4819-137-2-200207160-00012. [DOI] [PubMed] [Google Scholar]
- 19.Saint S, Lipsky BA, Baker PD, McDonald LL, Ossenkop K. Urinary catheters: what type do men and their nurses prefer? J Am Geriatr Soc. 1999;47(12):1453–1457. doi: 10.1111/j.1532-5415.1999.tb01567.x. [DOI] [PubMed] [Google Scholar]
- 20.Saint S, Kowalski CP, Forman J, et al. A multicenter qualitative study on preventing hospital-acquired urinary tract infection in US hospitals. Infect Control Hosp Epidemiol. 2008;29(4):333–341. doi: 10.1086/529589. [DOI] [PubMed] [Google Scholar]
- 21.Krein SL, Damschroder LJ, Kowalski CP, Forman J, Hofer TP, Saint S. The influence of organizational context on quality improvement and patient safety efforts in infection prevention: a multi-center qualitative study. Soc Sci Med. 2010;71(9):1692–1701. doi: 10.1016/j.socscimed.2010.07.041. [DOI] [PubMed] [Google Scholar]
- 22.Meddings J, Saint S, McMahon LF., Jr Hospital-acquired catheter-associated urinary tract infection: documentation and coding issues may reduce financial impact of Medicare’s new payment policy. Infect Control Hosp Epidemiol. 2010;31(6):627–633. doi: 10.1086/652523. [DOI] [PubMed] [Google Scholar]
- 23.US Department of Health and Human Services. [Accessed July 10, 2011.];HHS Action Plan to Prevent Healthcare-Associated Infections. http://www.hhs.gov/ash/initiatives/hai/actionplan/index.html-tier1.