

Abstract
It is becoming increasingly evident that the urocortins (Ucns) and their receptors are involved in the initiation and development of inflammation in the gastrointestinal (GI) tract. There has not been a systematic study of the basal expression of Ucns or their receptors in the GI tract. Here, we examined basal expression of Ucn 2 and its high-affinity receptor, CRF-R2 in the rat GI tract. Ucn 2 mRNA was expressed throughout the small and large intestine. Surprisingly, CRF-R2 mRNA expression was detected in only a subset of GI regions that expressed Ucn 2. Immunohistochemical study showed that both Ucn 2 immuno-reactivity (Ucn 2-IR) and CRF-R2-IR were consistently seen in the neurons of the myenteric plexus and the nerve fibers innervating the circular muscle. By and large, Ucn 2-IR was detected in all layers, including the mucosal and the submucosal layers throughout the GI regions. In contrast, CRF-R2-IR was very low or undetectable in the mucosal layers of all regions examined. The role of Ucn 2 and CRF-R2 was then examined in a rat model of chemically-induced colitis. In the early phase of colitis, Ucn 2 mRNA levels peaked, whereas, in striking contrast, CRF-R2 mRNA expression decreased ∼2.5-fold below control levels. At the peptide level, Ucn 2-IR was specifically induced in a large population of immune cells that infiltrated the lamina propria and submucosa of the distal colon, whereas CRFR2-IR was detected in only a small fraction of infiltrated immune cells. CRF-R2-IR was dramatically reduced in the neurons of the myenteric plexus. Thus, we show, for the first time, that in the acute phase of inflammation, Ucn 2 levels are increased whereas expression levels of its only identified receptor, CRF-R2, are decreased. This suggests that Ucn 2 exerts its effects only in part via CRF-R2.
Keywords: Urocortin 2, Corticotropin-Releasing Factor receptor 2, inflammation, cytokine, rat, gastrointestinal tract, immunohistochemistry
1. Introduction
The urocortins (Ucn 1, Ucn 2 and Ucn 3) are members of the corticotropin-releasing factor (CRF) family of neuropeptides. These neuropeptides were originally described with respect to their role in the endocrine stress response [19]. They have since been found to have important roles in regulating diverse processes such as vascular tone, cardiac function, immune cell activation, feeding, and gastrointestinal (GI) motility [6, 17]. The urocortins exert their effects via two known receptors, CRF-R1 and CRF-R2 [10]. Ucn 1 binds with similar affinity to both receptors, while Ucn 2 and Ucn 3 bind exclusively to CRF-R2 [5]. Localization of these ligands and receptors has been done primarily in the central nervous system, and to a lesser extent in peripheral tissue [9, 16, 20].
A growing number of studies demonstrate that the urocortins and their receptors play an important role in regulating inflammation in the GI tract of both humans and rodents [1, 4, 12, 13]. However, basal urocortin expression throughout the GI tract has not been systematically studied. What has been published focuses on Ucn 1; Ucn 2 and Ucn 3 are less well-described. In this study, we examined the basal expression of Ucn 2 and CRF-R2 in each segment of the rat GI tract, from the duodenum to the rectum.
Many animal models have been described for simulating inflammatory bowel disease, each with its own advantages and drawbacks [14]. To study if the expression of Ucn 2 and its receptor, CRF-R2, is affected in inflammatory conditions, we used trinitrobenzene sulfonic acid (TNBS) enemas to induce a chemical colitis that is an immunologically mediated, commonly accepted model for Crohn's disease. We studied the expression of Ucn 2 and CRF-R2 at various time-points in a 15-day course of TNBS colitis. We hypothesized that this time course would capture the peak of inflammation and the return to a non-inflamed state. The purpose of this study was to determine how Ucn 2 and CRF-R2 expression is altered in colonic inflammation, as compared to basal conditions, and thereby gain an understanding of its role in GI inflammation.
2. Materials and Methods
2.1 Animals
Adult male Sprague-Dawley rats (Simonsen Laboratories, Gilroy, CA), weighing 260-280 g were used for the experiments. The rats were individually housed in hanging wire cages in a room that was temperature-controlled (22°C) and light-controlled (12-h light/12-h dark cycle starting at 7 a.m.). The rats had ad libitum access to food and water, unless otherwise stated, and were given at least 3 days to acclimate to the housing facility before any experiments were done. All procedures were in accordance with the Institutional Animal Care and Use Committee at the University of California, San Francisco.
2.2 Experimental Design 1: Basal Studies
Rats (n=5) received isoflurane anesthesia prior to decapitation. The GI tract was removed from duodenum to rectum. Two portions of each segment were removed: one was snap-frozen in liquid nitrogen for RNA extraction, and the other was fixed in 4% paraformaldehyde (PFA) for histological study.
2.3 Experimental Design 2: Inflammation Studies
Rats (n=4-5 per group) were anesthetized with isoflurane, and a silicone catheter (Mallinckrodt Inc, St. Louis, MO) was inserted into the anus to a depth of 8 cm (to the splenic flexure). An enema consisting of 30 mg TNBS in a 50% ethanol (EtOH) vehicle was then given in a 250 μL volume via a 1 mL syringe attached to the catheter; a 50% ethanol enema served as a vehicle control. Rats were weighed daily at 10 a.m. Groups of rats (n=4) were then sacrificed on days 1, 3, 6, 9, 12 and 15, and tissue was collected as described above for RNA extraction and immunohistochemistry, with an additional segment collected for myeloperoxidase (MPO) assay analysis. The 50% ethanol control group was sacrificed on day 15.
2.4 Histological evaluation and Immunohistochemistry
Tissue from the GI tract was fixed in 4% PFA with 30% sucrose, embedded in OCT compound (Tissue-Tek, Sakura Finetek, Torrance, CA), sectioned (4-6 μm), and thaw-mounted onto Superfrost Plus (Fisher, Pittsburg) slides. Immunohistochemical analysis of Ucn 2 was done using a Ucn 2 primary antibody (rabbit, Phoenix Pharmaceuticals, Belmont, CA) at a 1:2000 dilution, and analysis of CRF-R2 was done using a CRF-R2 primary antibody (rabbit, Abcam Inc., Cambridge, MA) at a 1:4000 dilution. The secondary antibody used was a horseradish peroxidase-conjugated goat anti-rabbit (Jackson ImmunoResearch, West Grove, PA) at a 1:300 dilution. Diaminobenzidine tetrachloride was used for visualization and hematoxylin was used as a counterstain. Ucn 2 blocking peptide (Phoenix Pharmaceuticals) was used to pre-adsorb the Ucn 2 primary antibody and served as a negative control. Sections were also stained with hematoxylin and eosin for histological evaluation.
2.5 Semi-quantitative RT-PCR
Total RNA was isolated from snap-frozen tissue using RNA Stat-60 (Tel-Test, Friendswood, TX) according to the manufacturer's protocol. First-strand cDNA was synthesized from 2 μg of total RNA using random hexamers and MMLV-RT (Invitrogen, Carlsbad, CA) in a 20 μL reaction volume. 4 μL of the RT reaction was used as the template for each PCR reaction, using primers specific for rat Ucn 2, CRF-R2, TNF-α, IL-6 or cyclophilin (Table 1). For normalization, cyclophilin was selected as an unrelated housekeeping gene. PCR products were analyzed using agarose gel electrophoresis, and band intensities of the transcripts of interest were quantified relative to cyclophilin band intensities using NIH Image.
Table 1. Primer Sequences.
| Genes | Primers | Length (bp) | Accession Number (GenBank) |
|---|---|---|---|
| Ucn 2 | |||
| Forward | 5′-GGCACTGGTGGTGTTTATG-3′ | 371 | NM 133385.1 |
| Reverse | 5′-CTCCAGAACTTCTCATCCAG-3′ | ||
| CRF-R2 | |||
| Forward | 5′-CACACTGTGAACCCATTTTGG-3′ | 231 | NM 022714.1 |
| Reverse | 5′-GATGAGTTGCAGCAGGAACC-3′ | ||
| TNF-α | |||
| Forward | 5′-CGTCGTAGCAAACCACCAAGCA-3′ | 296 | NM 012675.2 |
| Reverse | 5′-ACCAGGGCTTGAGCTCAGCTC-3′ | ||
| IL-6 | |||
| Forward | 5′-CAGGGAGATCTTGGAAATGAG-3′ | 481 | NM 012589.1 |
| Reverse | 5′-TGATATGCTTAGGCATAGCACAC-3′ | ||
| Cyclophilin | |||
| Forward | 5′-TGCAGACGCCGCTGTCTC-3′ | 593 | NM 017101.1 |
| Reverse | 5′-TGCTCTCCTGAGCTACAG-3′ | ||
2.6 Myeloperoxidase (MPO) Assay
MPO activity was measured using a modified 3, 3′, 5′, 5-tetramethylbenzidine (TMB) assay [15]. Snap-frozen tissue was homogenized in hexadecyltrimethylammonium bromide and 50 mM KH2PO4 (pH 6). This suspension was then sonicated and centrifuged. The supernatant was freeze-thawed and assayed using the TMB Liquid Substrate System (Sigma, St. Louis, MO). Human MPO with known activity was used as a standard. MPO activity was then normalized to the weight of tissue sample used.
2.7 Statistical Analysis
Omnibus testing was done using one-way ANOVA, and planned pairwise comparisons of MPO activity and semi-quantitative PCR were done using Fisher's LSD post hoc test. This method was selected because we had formulated the hypothesis that inflammation would peak, and then resolve, during the selected time course, and because only a select list of variables were to be studied. Data from adjacent time-points were pooled to form early, middle, and late groups based on non-significant differences between pooled time-points. A value of p ≤ 0.05 was accepted as statistically significant. Rats that had MPO activity or a semi-quantitative PCR result that was ≥ 1.96 standard deviations from the mean were excluded from all analyses in order to reduce variance.
3. Results
3.1 Localization of Ucn 2 under basal conditions
Immunoreactive Ucn 2 (Ucn 2-IR) was distributed ubiquitously throughout the GI tract (Fig. 1). The rectum exhibited the least Ucn 2-IR, whereas the jejunum exhibited the most. Moderate levels of Ucn 2-IR were seen in the duodenum, proximal ileum, terminal ileum, proximal colon and distal colon.
Figure 1.
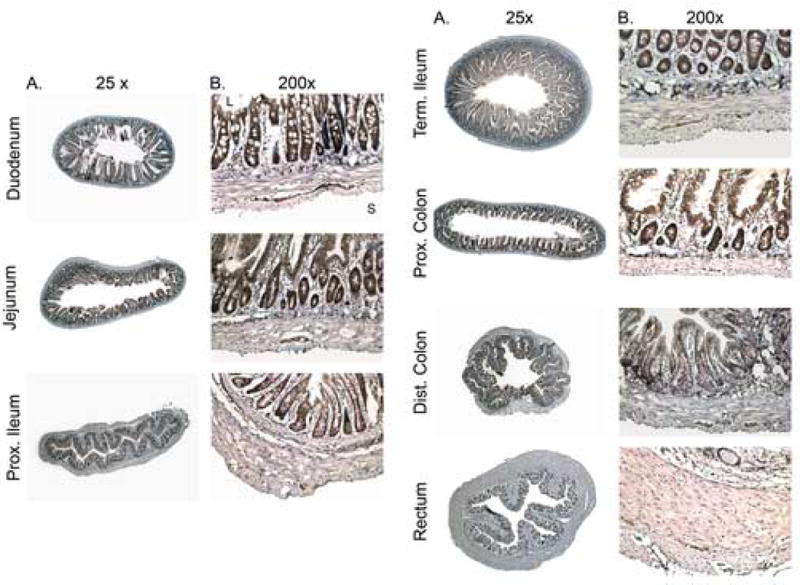
Ucn 2 immuno-reactivity in the basal gastrointestinal tract. A: 25× magnification. B: 200× magnification. L – lumenal surface, S – serosal surface. For reproduction in color on the Web and in print.
Detailed analysis of the various GI segments revealed that in all segments, Ucn 2-IR was present in the epithelial cells of the mucosa. In the duodenum, jejunum, ileum and the colon, certain support cells and immune cells of the lamina propria were positive for Ucn 2-IR. However, Payer's patches, when present, demonstrated faint and inconsistent immunoreactivity for Ucn 2. The endothelial lining of the lymphatics and the blood vessels were negative for Ucn 2-IR, but the neurons of the submucosal plexus, when present, were positive. The nerve fibers present in the circular muscle showed weak Ucn 2-IR and the neurons of the myenteric plexus were strongly positive for Ucn 2 (Fig. 1B).
RT-PCR confirmed that Ucn 2 mRNA was present from the duodenum to the rectum (Fig. 2B). Semi-quantitative RT-PCR from all regions of the GI tract revealed some degree of variability in Ucn 2 mRNA expression between individual rats under basal conditions. This variability was also reflected at the peptide level, as determined by IHC. Ucn 2 mRNA levels were most consistent between individual rats in the colon. Semi-quantitative RT-PCR from the terminal ileum, as well as the proximal and distal colons revealed that the highest levels of Ucn 2 were present in the distal colon, followed by proximal colon and the terminal ileum.
Figure 2.
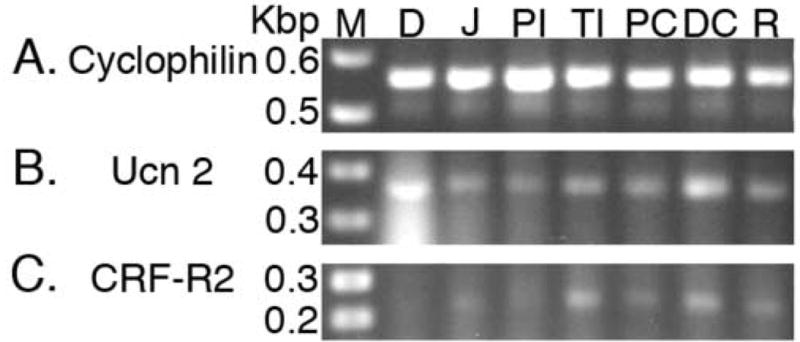
Representative PCR products from throughout the GI tract. A: cyclophilin (593 bp). B: Ucn 2 (371 bp). C: CRF-R2 (231 bp). Key: M - marker, D - duodenum, J -jejunum, PI - proximal ileum, TI - terminal ileum, PC - proximal colon, DC - distal colon, R - rectum.
In comparison, CRF-R2 expression was even more variable than Ucn 2 expression along the GI tract, and mRNA was not detected in the duodenum (Fig. 2C). mRNA levels were consistently highest in the terminal ileum, colon and rectum.
3.2 Effects of TNBS colitis: a time course study
Rats that received a TNBS enema failed to gain weight for the first half of the time course, whereas rats that received a 50% ethanol enema (vehicle control) gained weight appropriately (Fig. 3). This effect on weight gain lasted for 6 days, after which time, the rate of weight gain between the treatment groups became parallel again. However, as expected, the body weight of the rats with colitis remained significantly lower than that of the control animals for the duration of the study.
Figure 3.

TNBS effects on body weight. TNBS animals failed to gain weight for 6 days after colitis was induced, compared to vehicle control animals.
The MPO assay showed a large and significant increase in MPO activity for TNBS-treated animals over what was seen in vehicle control rats (Fig. 4). MPO activity peaked during the early phase (p < 0.001), decreased during the middle phase, and returned to vehicle control levels by the late phase of the time course.
Figure 4.

TNBS effect on MPO activity. TNBS induced a marked increase over that of the vehicle control, which peaked during the early phase. MPO activity decreased during the middle phase, and returned to vehicle control levels by the late phase. ‡ p < 0.001.
Hematoxylin and eosin-stained histological sections showed the progression and subsequent initial stage of resolution of the colitis (Fig. 5). One day after TNBS colitis was induced, mucosal ulcerations and necrosis were apparent. By the third day of colitis, there were large patches of circumferential ulceration and necrosis. There was also marked infiltration of inflammatory cells into the submucosa, as well as thickening of this layer. Mucosal healing began on the 6th day and slowly progressed for the remainder of the time course. By the 9th day, there was megacolon, a grossly evident dilation of the size of the lumen of the colon. At that time, capillary angiogenesis was also seen. At the 15th day, ulceration severity improved significantly, but mucosal healing was not complete. The colon wall was also still thickened compared to basal specimens (Fig. 5).
Figure 5.
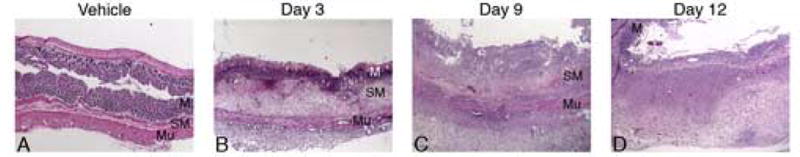
Histological changes from TNBS colitis. All sections are stained with hematoxylin and eosin and shown at 25×. A: Vehicle control, B: Early phase (day 3), C: Middle phase (day 9), D: Late phase (day 12). Compared to vehicle control tissue, TNBS-treated animals at 3 days showed marked mucosal damage and submucosal edema with infiltration of inflammatory cells. At 9 days, significant fibrosis is seen. 12 days after TNBS treatment, some recovering mucosa is seen, but there continues to be large amounts of fibrotic tissue. Key: M – mucosa, SM – submucosa, Mu – muscularis. For reproduction in color on the Web and in print.
3.3 Effects of TNBS colitis on Ucn 2 and CRF-R2 immuno-reactivity in the colon
Next, we ascertained how TNBS colitis affected tissue histology and whether it induced Ucn 2-IR and CRF-R2-IR in novel sites in the distal colon. In the early phase of TNBS-induced inflammation (day 3), mucosal ulceration and necrosis predominated. Histologically, in the surviving regions of colonic mucosa (days 3-15), normal columnar luminal absorptive cells appeared to be replaced by cuboidal cells, consistent with less mature, more rapidly dividing cells (shown in Fig. 6B, top panels). Edema distended the lamina propria and the submucosa. Ucn 2-IR was induced in individual lamina propria inflammatory cells, as well as in the support cells of that layer (Fig 6B, top left panel). Interestingly, Ucn 2-IR in all the lamina propria cells appeared to be enhanced by TNBS-induced inflammation. Macrophages were the predominant Ucn 2-IR cells, while neutrophils did not appear to have Ucn 2-IR. The submucosa was dramatically thickened by connective tissue infiltrated with a mix of immune cells, including macrophages, phagocytosing debris and lipid droplets (Fig. 6B, middle panels). Blood and lymphatic vessels were distended and edema grossly distorted all supporting tissue. Submucosal plexuses were unidentifiable in the damaged submucosal layer; however, Ucn 2-IR appeared to be decreased in the myenteric plexus neurons that were still identifiable (Fig. 6B, bottom left panel).
Figure 6.

Changes in Ucn 2-IR and CRF-R2-IR in TNBS colitis. A. Ucn 2-IR and CRF-R2-IR under basal conditions at 400× magnification. B. Ucn 2-IR and CRF-R2-IR in TNBS colitis at 3 days at 600× magnification. The expression pattern in untreated animals is similar to that of vehicle control tissue, with clear Ucn 2-IR in the epithelial cells, the submucosal plexuses (not shown), and myenteric plexuses. Occasional lamina propria cells and infiltrated immune cells show Ucn 2-IR as well. CRF-R2-IR is seen predominantly in the neuronal plexuses, with scattered macrophages showing CRF-R2-IR as well. In TNBS colitis tissue, Ucn 2-IR in intrinsic colonic cells are unchanged, while large numbers of infiltrated immune cells show Ucn 2-IR. Both Ucn 2-IR and CRF-R2-IR in myenteric plexuses appear decreased in TNBS colitis, compared to basal tissue. Key: C – crypt, MP – myenteric plexus. Arrowheads indicate infiltrated immune cells. For reproduction in color on the Web and in print.
Surprisingly, CRF-R2-IR appeared to be decreased in the neurons of the myenteric plexus after TNBS-induced inflammation (Fig. 6A compared with Fig. 6B, bottom right panels). CRFR2-IR was detectable in scattered macrophages, most noticeably in the submucosa (Fig. 6B, middle right panel), but not in other identifiable immune cell types, namely neutrophils. After day 3, the number of infiltrated inflammatory cells decreased, and there was significant fibrosis throughout the submucosal and muscularis layers. Fibroblasts were prominent and showed Ucn 2-IR from the 6th day to the 15th day.
3.4 Effects of TNBS colitis on Ucn 2 and CRF-R2 mRNA in the colon
Semi-quantitative RT-PCR revealed that TNBS caused a significant increase in Ucn 2 mRNA compared to vehicle controls (Fig. 7A). An initial peak was seen during the early phase (p = 0.04), before mRNA levels returned to vehicle control levels during the middle phase of the time course. A second peak was seen during the late phase (p < 0.01).
Figure 7.

Relative quantity of mRNA during TNBS colitis. A: Ucn2 mRNA. B: CRF-R2 mRNA. Ucn 2 expression initially peaks during the early phase, and returns to vehicle control levels during the middle phase. A second peak, equaling the initial peak, is seen in the late phase. In contrast, CRF-R2 expression is decreased during the early phase, but is otherwise unchanged from control levels. ‡ p ≤ 0.04, § p = 0.05.
CRF-R2 mRNA levels fell by 2.5-fold below those of controls during the early phase of colitis (p = 0.05), but returned to vehicle control levels for the remainder of the time course (Fig. 7B). Qualitatively, the RT-PCR and IHC results are in agreement.
3.5 Effects of TNBS colitis on cytokine mRNA in the colon
Alteration of pro-inflammatory cytokines is an integral part of an inflammatory response. Th1-type pro-inflammatory cytokines such as TNF-α and IL-6 are normally altered in Crohn's disease. We followed the changes in expression of these cytokines during the time course of colitis. Semi-quantitative RT-PCR revealed that TNBS caused TNF-α expression to be significantly elevated (Fig. 8A) above vehicle control levels during the middle and late phases (p = 0.02 and p < 0.01, respectively). IL-6 expression was elevated throughout the time course (p < 0.01, p < 0.01 and p=0.05 for early, middle, and late phases, Fig. 8B).
Figure 8.

Relative quantity of TNF-α and IL-6 during TNBS colitis. A: TNF-α. B: IL-6. TNF-α is significantly elevated over vehicle control levels during the middle and late phases, while IL-6 is significantly elevated throughout the course of TNBS colitis. ‡ p ≤ 0.02, § p = 0.05.
4. Discussion
Although initially characterized in the central nervous system, the expression of urocortins and their receptors has been described in many peripheral organs, including the GI tract. Their expression has been linked to regulation of inflammation, and may represent a powerful therapeutic target in inflammatory bowel disease. Increased Ucn 1 expression has been found to correlate with active gastritis, and patients who responded to treatment for gastritis had even higher levels of expression [1]. In the colon, CRF-R2, the only known receptor for Ucn 2 and Ucn 3, has been found to regulate visceral pain and colonic afferent signaling [8]. Finally, Ucn 1 and Ucn 2 have been found to induce macrophage apoptosis via CRF-R2 [18]. Therefore, we sought to characterize basal Ucn 2 and CRF-R2 expression throughout the GI tract and under inflammatory conditions in the colon.
We found Ucn 2 expression throughout the GI tract, by both RT-PCR and immunohistochemistry. This is in agreement with studies that have found CRF-R2, its receptor, in the upper GI tract [3], and the colon [2], and also with our results that found consistent CRF-R2 expression in the colon, primarily in the neuronal plexuses and more infrequently in inflammatory cells. Overall, Ucn 2 expression was most consistent in the mucosal epithelium and in the neuronal plexuses, although there was variation between segments of the tract. The variability of expression, both in quantity and in cell-type, along the GI tract suggests a manner by which Ucn 2 may have different effects in different GI segments. Based on functional studies of CRF-R2, it may be hypothesized that the localization of Ucn 2 in the neuronal plexuses may function in regulating both GI motility [7], as well as visceral pain [8]. Ucn 2 localized to the epithelium may function in controlling mucosal permeability, as the peripheral CRF signaling pathways have been shown to mediate mucosal permeability [11].
Furthermore, the variability of Ucn 2 mRNA and peptide levels observed between different individuals under basal conditions suggests that a threshold basal expression may be required to respond to an inflammatory challenge. This notion is supported by the findings in patients with H. pylori infection [1]. When treated, these patients fall into two categories: responders and non-responders, with responders exhibiting a further increase in their Ucn levels as inflammation resolves and non-responders having no further change in their Ucn levels.
After TNBS colitis was induced, we found that Ucn 2 mRNA expression became markedly elevated above vehicle control levels. The initial peak was during the early phase (days 1 & 3), and corresponded to the peak in MPO activity. During the middle phase (days 6 & 9), Ucn 2 expression returned to vehicle control levels. Interestingly, during the late phase (days 12 & 15), Ucn 2 expression increased again, equaling the peak seen in the early phase. Immunohistochemistry further revealed that Ucn 2-IR was specifically increased in the infiltrated macrophages of the lamina propria and the submucosa, 3 days after colitis was induced. On days 6-15, Ucn 2-IR was seen clearly in numerous fibroblasts, perhaps leading to the increasing Ucn 2 mRNA expression found by RT-PCR.
In striking contrast to its ligand, CRF-R2 mRNA expression showed a marked decrease during the early phase that was synchronous with the early Ucn 2 peak. For the remainder of the course, CRF-R2 expression remained at vehicle control levels. The concurrent decrease in CRF-R2 while Ucn 2 expression was elevated during the early phase may represent a compensatory decrease in receptor in response to the increase in ligand expression, or vice versa. This mechanism could be used to modulate the inflammatory process. It may also be possible that all of the actions of Ucn 2 are not mediated via CRF-R2 and that there is another unidentified receptor for Ucns.
From this study alone, it is not possible to determine if the elevation in Ucn 2 expression is part of the inflammatory reaction itself, or whether it is part of the anti-inflammatory response to the colitis. However, the increasing Ucn 2 expression during the late phase, concurrent with decreasing MPO activity during that time, suggests that Ucn 2 may play a role in resolving inflammation.
Our study of selected cytokine expression showed that TNF-α expression became elevated in response to TNBS, and remained elevated throughout the time course studied. IL-6 expression, in contrast, became elevated but returned to control levels during the late phase. The elevated TNF-α expression during the late phase, despite control levels of MPO activity, demonstrates the limitations of the MPO system in detecting inflammation beyond what is mediated by neutrophils. Disproving our initial hypothesis that the selected time course would show the resolution of acute inflammation, the TNF-α expression suggests that the inflammatory process is not completely captured during our selected time course. Elevation in Ucn 2 expression during the late phase may be directly or indirectly related to persistently elevated TNF-α expression, but most likely represents only one aspect of the multi-factorial regulation of cytokine production.
A further study that may clarify the role of Ucn 2 in colonic inflammation would be to deliver exogenous Ucn 2 peptide agonist and determine how it alters the progression of TNBS colitis. Alternatively, colon-specific knockout of Ucn 2 expression, using RNA interference, might also elucidate the role of this neuropeptide in this tissue.
In summary, we have demonstrated that Ucn 2-IR is detectable throughout the GI tract, and that the cell types that express it are variable. Expression in mucosal epithelium and neuronal plexuses is quite consistent, and agrees with other data implicating urocortins in inflammatory regulation. Inducing an immune colitis leads to an increase in Ucn 2 mRNA that initially peaks during the early phase, correlating with highest MPO activity, and again during the late phase, when MPO activity is at control levels. Ucn 2-IR does not change in intrinsic colonic tissue, with the exception of the neurons in the myenteric plexus, but infiltrating immune cells show strong Ucn 2-IR, possibly as part of an innate anti-inflammatory response.
Acknowledgments
This study was supported in part by the National Institutes of Health NIH 5 T32 DK07573 grant and by a UCSF REAC grant. We thank Dr. Melanie Adams for her help in the pathological analysis of the H&E-stained slides. We thank Pamela Derish for her critical reading and editing of this manuscript.
Footnotes
Publisher's Disclaimer: This is a PDF file of an unedited manuscript that has been accepted for publication. As a service to our customers we are providing this early version of the manuscript. The manuscript will undergo copyediting, typesetting, and review of the resulting proof before it is published in its final citable form. Please note that during the production process errors may be discovered which could affect the content, and all legal disclaimers that apply to the journal pertain.
References
- 1.Chatzaki E, Charalampopoulos I, Leontidis C, Mouzas IA, Tzardi M, Tsatsanis C, et al. Urocortin in human gastric mucosa: relationship to inflammatory activity. J Clin Endocrinol Metab. 2003;88:478–83. doi: 10.1210/jc.2002-020853. [DOI] [PubMed] [Google Scholar]
- 2.Chatzaki E, Crowe PD, Wang L, Million M, Tache Y, Grigoriadis DE. CRF receptor type 1 and 2 expression and anatomical distribution in the rat colon. J Neurochem. 2004;90:309–16. doi: 10.1111/j.1471-4159.2004.02490.x. [DOI] [PubMed] [Google Scholar]
- 3.Chatzaki E, Murphy BJ, Wang L, Million M, Ohning GV, Crowe PD, et al. Differential profile of CRF receptor distribution in the rat stomach and duodenum assessed by newly developed CRF receptor antibodies. J Neurochem. 2004;88:1–11. doi: 10.1046/j.1471-4159.2003.02078.x. [DOI] [PubMed] [Google Scholar]
- 4.Gonzalez-Rey E, Fernandez-Martin A, Chorny A, Delgado M. Therapeutic effect of urocortin and adrenomedullin in a murine model of Crohn's disease. Gut. 2006 doi: 10.1136/gut.2005.084525. [DOI] [PMC free article] [PubMed] [Google Scholar]
- 5.Hsu SY, Hsueh AJ. Human stresscopin and stresscopin-related peptide are selective ligands for the type 2 corticotropin-releasing hormone receptor. Nat Med. 2001;7:605–11. doi: 10.1038/87936. [DOI] [PubMed] [Google Scholar]
- 6.Martinez V, Wang L, Million M, Rivier J, Tache Y. Urocortins and the regulation of gastrointestinal motor function and visceral pain. Peptides. 2004;25:1733–44. doi: 10.1016/j.peptides.2004.05.025. [DOI] [PubMed] [Google Scholar]
- 7.Million M, Maillot C, Saunders P, Rivier J, Vale W, Tache Y. Human urocortin II, a new CRF-related peptide, displays selective CRF(2)-mediated action on gastric transit in rats. Am J Physiol Gastrointest Liver Physiol. 2002;282:G34–40. doi: 10.1152/ajpgi.00283.2001. [DOI] [PubMed] [Google Scholar]
- 8.Million M, Wang L, Wang Y, Adelson DW, Yuan PQ, Maillot C, et al. CRF2 receptor activation prevents colorectal distension induced visceral pain and spinal ERK1/2 phosphorylation in rats. Gut. 2006;55:172–81. doi: 10.1136/gut.2004.051391. [DOI] [PMC free article] [PubMed] [Google Scholar]
- 9.Morin SM, Ling N, Liu XJ, Kahl SD, Gehlert DR. Differential distribution of urocortin- and corticotropin-releasing factor-like immunoreactivities in the rat brain. Neuroscience. 1999;92:281–91. doi: 10.1016/s0306-4522(98)00732-5. [DOI] [PubMed] [Google Scholar]
- 10.Perrin MH, Vale WW. Corticotropin releasing factor receptors and their ligand family. Ann N Y Acad Sci. 1999;885:312–28. doi: 10.1111/j.1749-6632.1999.tb08687.x. [DOI] [PubMed] [Google Scholar]
- 11.Santos J, Saunders PR, Hanssen NP, Yang PC, Yates D, Groot JA, et al. Corticotropin-releasing hormone mimics stress-induced colonic epithelial pathophysiology in the rat. The American journal of physiology. 1999;277:G391–9. doi: 10.1152/ajpgi.1999.277.2.G391. [DOI] [PubMed] [Google Scholar]
- 12.Saruta M, Takahashi K, Suzuki T, Fukuda T, Torii A, Sasano H. Urocortin 3/stresscopin in human colon: possible modulators of gastrointestinal function during stressful conditions. Peptides. 2005;26:1196–206. doi: 10.1016/j.peptides.2005.01.014. [DOI] [PubMed] [Google Scholar]
- 13.Saruta M, Takahashi K, Suzuki T, Torii A, Kawakami M, Sasano H. Urocortin 1 in colonic mucosa in patients with ulcerative colitis. J Clin Endocrinol Metab. 2004;89:5352–61. doi: 10.1210/jc.2004-0195. [DOI] [PubMed] [Google Scholar]
- 14.Strober W, Fuss IJ, Blumberg RS. The immunology of mucosal models of inflammation. Annu Rev Immunol. 2002;20:495–549. doi: 10.1146/annurev.immunol.20.100301.064816. [DOI] [PubMed] [Google Scholar]
- 15.Suzuki K, Ota H, Sasagawa S, Sakatani T, Fujikura T. Assay method for myeloperoxidase in human polymorphonuclear leukocytes. Anal Biochem. 1983;132:345–52. doi: 10.1016/0003-2697(83)90019-2. [DOI] [PubMed] [Google Scholar]
- 16.Takahashi K, Totsune K, Sone M, Murakami O, Satoh F, Arihara Z, et al. Regional distribution of urocortin-like immunoreactivity and expression of urocortin mRNA in the human brain. Peptides. 1998;19:643–7. doi: 10.1016/s0196-9781(98)00012-6. [DOI] [PubMed] [Google Scholar]
- 17.Tao J, Li S. Urocortin: a cardiac protective peptide? Biochem Biophys Res Commun. 2005;332:923–6. doi: 10.1016/j.bbrc.2005.04.076. [DOI] [PubMed] [Google Scholar]
- 18.Tsatsanis C, Androulidaki A, Dermitzaki E, Charalampopoulos I, Spiess J, Gravanis A, et al. Urocortin 1 and Urocortin 2 induce macrophage apoptosis via CRFR2. FEBS Lett. 2005;579:4259–64. doi: 10.1016/j.febslet.2005.06.057. [DOI] [PubMed] [Google Scholar]
- 19.Vaughan J, Donaldson C, Bittencourt J, Perrin MH, Lewis K, Sutton S, et al. Urocortin, a mammalian neuropeptide related to fish urotensin I and to corticotropin-releasing factor. Nature. 1995;378:287–92. doi: 10.1038/378287a0. [DOI] [PubMed] [Google Scholar]
- 20.Yamauchi N, Otagiri A, Nemoto T, Sekino A, Oono H, Kato I, et al. Distribution of urocortin 2 in various tissues of the rat. J Neuroendocrinol. 2005;17:656–63. doi: 10.1111/j.1365-2826.2005.01354.x. [DOI] [PubMed] [Google Scholar]