Abstract
Objective
Reflectance measured in the ear canal offers a noninvasive method to monitor the acoustic properties of the middle ear, and few systematic measurements exist on the effects of various middle-ear disorders on the reflectance. This work utilizes a human cadaver-ear preparation and a mathematical middle-ear model to both measure and predict how power reflectance ℛ is affected by the middle-ear disorders of static middle-ear pressures, middle-ear fluid, fixed stapes, disarticulated incudo-stapedial joint, and tympanic-membrane perforations.
Design
ℛ was calculated from ear-canal pressure measurements made on human-cadaver ears in the normal condition and five states: (1) positive and negative pressure in the middle-ear cavity, (2) fluid-filled middle ear, (3) stapes fixed with dental cement, (4) incudo-stapedial joint disarticulated, and (5) tympanic-membrane perforations. The middle-ear model of Kringlebotn (1988) was modified to represent the middle-ear disorders. Model predictions are compared to measurements.
Results
For a given disorder, the general trends of the measurements and model were similar. The changes from normal in ℛ, induced by the simulated disorder, generally depend on frequency and the extent of the disorder (except for the disarticulation). Systematic changes in middle-ear static pressure (up to ± 300 daPa) resulted in systematic increases in ℛ. These affects were most pronounced for frequencies up to 1000 to 2000 Hz. Above about 2000 Hz there were some asymmetries in behavior between negative and positive pressures. Results with fluid in the middle-ear air space were highly dependent on the percentage of the air space that was filled. Changes in ℛ were minimal when a smaller fraction of the air space was filled with fluid, and as the air space was filled with more saline, ℛ increased at most frequencies. Fixation of the stapes generally resulted in a relatively small low-frequency increase in ℛ. Disarticulation of the incus with the stapes led to a consistent low-frequency decreases in ℛ with a distinctive minimum below 1000 Hz. Perforations of the tympanic membrane resulted in a decrease in ℛ for frequencies up to about 2000 Hz; at these lower frequencies, smaller perforations led to larger changes from normal as compared to larger perforations.
Conclusions
These preliminary measurements help assess the utility of power reflectance as a diagnostic tool for middle-ear disorders. In particular, the measurements document (1) the frequency ranges for which the changes are largest and (2) the extent of the changes from normal for a spectrum of middle-ear disorders.
Keywords: middle ear, reflectance, cadaver measurements, transmittance
1. Introduction
Noninvasive ear-canal-based reflectance measures have been proposed as a diagnostic method to differentiate between normal ears and ears with specific middle-ear disorders (e.g., Stinson, 1990; Keefe et al., 1992, 1993; Voss and Allen, 1994; Feeney et al., 2003; Allen et al., 2005; Shahnaz, 2008). Reflectance is directly related to a number of quantities, including impedance, admittance, pressure reflectance, power reflectance1, and transmittance, and collectively we will refer to this suite of quantities as “reflectance measures”. All of these reflectance measures, including their magnitudes and angles where appropriate, can be computed from a pressure measurement made in the ear canal along with the Thévenin equivalent of the sound source used to make the pressure measurement (Allen, 1986). The power reflectance is often the reported quantity, and it can be interpreted as the ratio between the acoustic power that is reflected at the tympanic membrane to the acoustic power that entered the ear canal. [See Merchant et al. (2010) and Allen et al. (2005) for reviews of how these reflectance measures are related and calculated.] Some work has also focused on “tympanometric reflectance measures” which refer to the same reflectance measures described here but also include pressurization of the ear canal (e.g., Margolis et al., 1999; Keefe and Simmons, 2003; Sanford and Feeney, 2008).
To date, reflectance measurements have been used to characterize several features of human middle-ear function, including (1) normal middle-ear function in adults (e.g., Stinson, 1990; Keefe et al., 1993; Voss and Allen, 1994; Mar-golis et al., 1999; Farmer-Fedor and Rabbitt, 2002; Shahnaz and Bork, 2006), (2) developmental changes (e.g., Keefe et al., 1993; Keefe and Levi, 1996; Keefe et al., 2000; Feeney and Sanford, 2004; Shahnaz, 2008; Sanford and Feeney, 2008; Werner et al., 2010; Merchant et al., 2010), (3) the effects of middle-ear fluid and other conductive disorders (e.g., Keefe and Levi, 1996; Margolis et al., 1999; Piskorski et al., 1999; Keefe and Simmons, 2003; Keefe et al., 2003b,a; Feeney et al., 2003; Allen et al., 2005; Hunter et al., 2008; Shahnaz et al., 2009; Feeney et al., 2009; Sanford et al., 2009; Beers et al., 2009; Hunter et al., 2010), and (4) the acoustic reflex (e.g., Feeney and Keefe, 1999, 2001; Feeney et al., 2004; Feeney and Sanford, 2005). Nonetheless, there are relatively few reports about how reflectance measures are affected by specific middle-ear disorders. Feeney et al. (2003) report measurements on ears with otitis media with effusion (N=4), otosclerosis (N=2), ossicular discontinuity (N=1), hypermobile tympanic membrane (N=2), and tympanic membrane perforations (N=2). Allen et al. (2005) analyzed measurements on one ear with otitis media with effusion, one subject with bilateral otosclerosis (2 ears), and one ear with a tympanic membrane perforation. Shahnaz et al. (2009) shows systematic increases in power reflectance with otosclerotic ears (N=28) as compared to normal ears, for frequencies below 1000 Hz. Feeney et al. (2009) report measurements of power reflectance on five cadaver ears, each with a disarticulated stapes, demonstrating that the disarticulation produces a low-frequency notch (or minimum) in power reflectance.
The results suggest that in many cases there are apparent differences between the reflectance of the pathologic ears when compared with the reflectance from large populations of normal ears. However, with such few measurements on pathologic ears available, specific effects of various middle-ear disorders on the ear-canal reflectance are not well understood. The goal of this work is to characterize systematically how five specific middle-ear disorders alter the power reflectance relative to the normal condition: (1) positive and negative static pressure, (2) middle-ear fluid, (3) fixation of the stapes footplate, (4) disarticulation of the incudo-stapedial joint, and (5) tympanic-membrane perforations.
Part of the challenge for quantifying how reflectance measures are affected by various middle-ear disorders comes from the facts that (1) individual subjects have a broad range of normal reflectance measurements and (2) subjects with particular middle-ear disorders often have multiple problems at once (e.g., fluid and negative middle-ear pressure or a perforation concomitant with a disarticulated ossicular chain). Here, we employ a human-cadaver-ear preparation to study changes in reflectance measures between the ear in a normal state and the same ear with a single specific modification that mimics one of the disorders listed above. This technique offers an important complement to measurements made within clinical populations in that here intra-subject variability is avoided during comparisons between measurements on ears in different states. With the cadaver-ear preparation, the difference between the normal and the altered state of the ear is the only variable under study. The use of cadaver ears and their similarities and differences from live ears is described elsewhere (e.g., Voss et al., 2008a).
In this work, we focus primarily on the specific measure of power reflectance ℛ, which is defined and described in detail elsewhere, including Allen et al. (2005) and Merchant et al. (2010). Briefly, the power reflectance ℛ is calculated directly from the pressure reflectance R, where
| (1) |
The power reflectance is a real number between 0 and 1, with ℛ(f) = 0 representing all power transmitted to the ear and with ℛ = 1 representing all power reflected at the tympanic membrane back into the ear canal. Inherent in this interpretation is the assumption that there are no losses along the ear-canal wall; recent measurements demonstrate that this assumption holds (Voss et al., 2008a).
Allen et al. (2005) define the measure transmittance level T as
| (2) |
Allen et al. (2005) argue that T is a useful quantity because its dB scale and measure of transmitted power relates more directly to the audiogram, as compared with ℛ, potentially making T a helpful representation for the clinical assessment of middle-ear function. When ℛ is near 1, T is near −20 dB and small changes are difficult to detect in ℛ but have larger effects on T; in contrast, when ℛ is near 0, T is near 0 dB and small changes are more apparent in ℛ. Thus, these two measures, which are nonlinear transformations of each other, may be useful in complementary ways. For example, if one is interested in changes in ℛ where the normal values are typically closer to 1 (e.g., lowest frequencies), then T might make changes more apparent; likewise, if one is interested in changes at frequencies where less power is reflected (e.g., middle frequencies), then ℛ might be a better representation. In the work presented here, we primarily plot ℛ in order to present all of our data in a reasonable number of figures; however, in some summary plots we also include graphs of transmittance level T in order for the reader to compare the two representations.
2. Methods
2.1. Overview
This work provides measurements on cadaver ears that describe how power reflectance is affected by five manipulations of the middle ear, with each manipulation representing an abnormal middle-ear state: (1) positive and negative static pressure, (2) fluid, (3) fixation of the stapes footplate, (4) disarticulation of the incudo-stapedial joint and/or of the incudo-malleolar joint, and (5) tympanic-membrane perforations.
2.2. Subjects
All measurements, except those with the tympanic-membrane perforations, were made on eight cadaver ears obtained through the nonprofit group Life Legacy (LL); specifically the right and left ears of three subjects (LL11, LL13, LL14, ages 42, 88, 65 respectively) and the right ears of subjects LL10 and LL12 (ages 64 and 49 respectively). The ears included the complete outer ear, middle ear, and inner ear. The donors had no known history of ear disease, and each ear appeared normal when examined with an otologic operating microscope. Acoustical and mechanical measurements on eleven ears with tympanic-membrane perforations were reported previously (Voss et al., 2001a); here, ℛ from these ears were calculated from the previously reported impedance. One of the eleven ears is highlighted here, and all ears show the same general behavior.
2.3. Cadaver ear preparation
The ears were shipped on dry ice and kept frozen until the day before measurements were made, at which time they were refrigerated in saline. When present, the pinna and concha were removed to allow access to the entire length of the ear canal. The Eustachian tube was replaced by a tygon tube (0.8 mm inner diameter, length 30 cm) to allow access to introduce pressure or fluid into the middle-ear cavity. A second tube was a steel tube (1.3 mm inner diameter, length 2 cm) inserted into the superior portion of the mastoid to act as a vent to prevent a pressure build up when fluid was introduced; this second tube was sealed off using acoustic clay when fluid was not introduced into the cavity. The exterior of the temporal bone was coated with dental cement and / or epoxy in order to eliminate small acoustic leaks between the middle-ear cavity and the outside environment. During preparation and measurements, the tympanic membrane and middle ear were moistened periodically with saline, which was suctioned away before measurements were made. An ER-10c transducer was placed in the ear canal, and a 14A foam tip was allowed to expand to ensure a tight seal. For each measurement on a given ear, this transducer was positioned in the same location, with the lateral edge of the foam plug flush with the entrance to the ear canal. Before and during each set of ear manipulations, several measurements in the normal state were made to ensure the ear was stable.
2.4. Ear Manipulations
2.4.1. Positive and Negative Pressure
Measurements were made with the middle-ear static pressure ranging from −300 to + 300 daPa. Pressure was introduced to the middle ear and measured using a system that included a 60 cc calibrated syringe, a manometer to measure the pressure (Dwyer 477 digital manometer), and a 0.5 L plastic bottle. Three separate tygon tubes were sealed through the bottle top with silicon. One tygon tube connected the bottle to the manometer. The second tygon tube connected the bottle to the 60 cc calibrated syringe, which was adjusted to change the pressure; the syringe was coupled to a metal plate, and a screw device was devised to compress or extend the syringe so that it remained at a constant location under both positive and negative pressures. The third tygon tube coupled the bottle to the tygon tube that replaced the Eustachian tube. Thus, displacement of the syringe’s plunger either increased or decreased the pressure of the air in the closed system that included the middle-ear cavity. When the system was unable to hold a pressure, the entire ear was placed in saline, and when the syringe was pushed or pulled bubbles indicated the location(s) of air leak(s), which were then filled with either dental cement or epoxy. This process was repeated until the ear was able to maintain the desired pressures; in a few cases air leaks prevented measurements at the maximum pressures.
2.4.2. Fluid
Measurements were made with saline (Sigma Dulbecco’s phosphate buffered saline) in the middle-ear cavity. The same tubing used to connect the pressure system to the middle ear via the Eustachian tube was attached to an empty 2 cc syringe with no plunger attached to it. A second calibrated syringe filled with saline was then used to insert saline at 0.5 cc increments into the empty syringe. The plunger was then introduced into the 2 cc syringe attached to the ear and the fluid was pushed into the middle ear. The two syringe system was used to ensure that measurement of the amount of fluid being inserted was as accurate as possible, so that too much or too little fluid did not get accidentally pushed into the middle-ear cavity. The acoustic clay was removed from the tubing in the mastoid to ensure that there would be no pressure build up within the middle-ear cavity. Saline was inserted in 0.5 cc increments until the middle-ear cavity was estimated to be full when saline exited through the tubing in the mastoid. During these measurements and manipulations, the ears were oriented in a position judged to be similar to a head being held upright. The air and saline outlet in the mastoid was always placed through a hole drilled into the mastoid cavity from its most superior location within the squamous part of the temporal bone. We choose this location in order to not disrupt the tympanic cavity; it is possible that when the saline exited through the vent air bubbles could exist within the attic of the tympanic cavity. Across the four ears from two cadaver donors on which fluid-filled cavity measurements were made, the maximum volumes of saline that were added before fluid exited the vent tube were 7cc and 4 cc in the right and left ears of donor 13, respectively, and 1 cc and 2cc in the right and left ears of donor 14, respectively. These volumes are generally consistent with the range of total volume of the middle-ear air space determined by Molvaer et al. (1978) of 2 to 20 cc; it is likely that none of the ears were fully fluid filled throughout the entire mastoid space, as we did not look for air bubbles or determine if the mastoid was completely filled (Ravicz et al., 2004). The goal here was to determine the effect of differing amounts of fluid on ℛ, and not to assure that the cavity was completely filled with no air bubbles.
2.4.3. Stapes fixation
The stapes footplate was fixed with dental cement. To access the stapes, the tube attached to the Eustachian tube was removed and the entry to the middle-ear air space was enlarged via drilling toward the tympanic membrane as much as possible without affecting it. Dental cement was placed on top of and around the footplate in five of the eight ears; in the remaining three cases, the view of the footplate was insufficient to fix it with cement. In each case, the area around the footplate was gently suctioned to remove fluid, small amounts of dental cement were placed around the annular ligament, and more dental cement was placed on the footplate. The cement hardened for at least 10 minutes before measurements took place, and the hardness of the cement was confirmed by gently poking the cement and determining that it had cured. The Eustachian tube access hole was closed with a portion of a cover slip cut to fit the opening and secured using more dental cement.
2.4.4. Disarticulation
Measurements were made on all eight ears with the incudo-stapedial joint disarticulated and in one ear with the incudo-malleolar joint disarticulated. (The middle-ear anatomy allowed access to the incudo-malleolar joint in only one case.) As with the methods for fixation, entry into the middle-ear cavity was via the Eustachian tube opening. After each disarticulation, the middle-ear cavity was closed with a cover slip, as described for the fixation case above, and measurements were made.
2.5. Measurement System
Measurements were made with an Etymotic ER-10c probe using software and hardware developed by Mimosa Acoustics (HearID v4.4.100). The system provides a systematic method for determination of the probe’s Thévenin equivalent, which was measured prior to each experiment on a given preparation. The Thévenin equivalent and the ear-canal pressure were measured on both of the two channels within the ER-10c probe; all measurements were similar for both channels and measurements are reported from channel A in all cases. The ear-canal pressure measurement was in response to a wideband chirp stimulus at 70 dB SPL, and the average of 235 measurements is reported (FFT length of 2048, a sampling rate of 48 kHz, and a frequency resolution of about 25 Hz). Measurements of the ear-canal pressure were combined with the probe’s Théevenin equivalent to calculate the power reflectance and transmittance within the ear canal, as described elsewhere (e.g., Merchant et al., 2010); these calculations were done within the software package Matlab (version 7.6). Data where |R| > 1, corresponding to negative real parts of the impedance, are not plotted. This situation most often occurs at the lower frequencies where |R| approaches one (typically below 500 Hz) and may result from inaccuracies in the measured sound pressure, errors in the Thévenin equivalent of the transducer, or changes in the Thévenin equivalent that can potentially occur with moisture, debris, or differences between the cross sectional area of the ear canal as compared to the calibration cavities (e.g., Huang et al., 2000).
2.6. Stability and variability within measurements
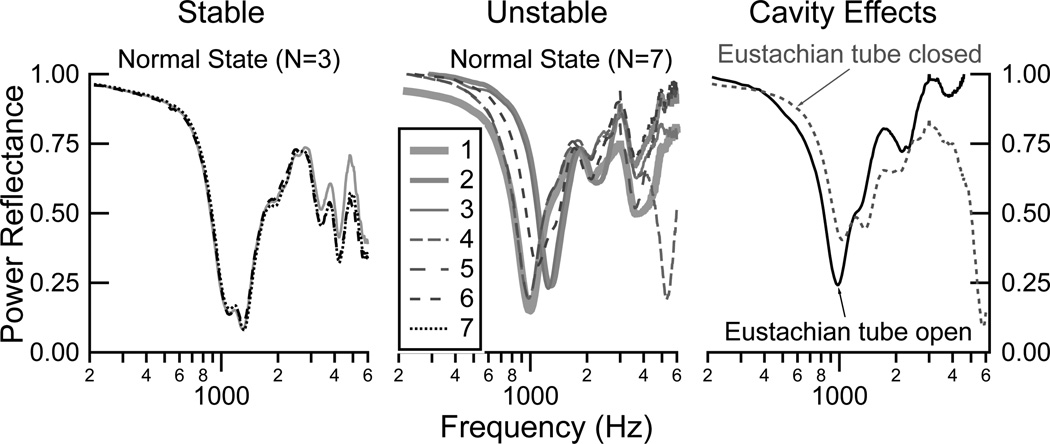
The stability of the cadaver-ear preparations for measurements has been discussed extensively elsewhere (e.g., Voss et al., 2000, 2008a). Here, we acknowledge that it is essential to ensure that the measurements on a given preparation are stable and repeatable over the experiment. The ear must remain moist via routine application of saline throughout the experiment, and while this approach usually leads to stable preparations, some ears show “drying-out effects” over such small time intervals that the preparations must be deemed unstable. To ensure stability here, measurements were made in the “normal” state during several phases of the experiments; when large changes over short periods of time were observed, and soaking the ear in saline did not reduce the variability, the preparation was abandoned (2 of 10 ears). As an example, Fig. 1 (left) shows three measurements taken in the normal condition and spaced three to five minutes apart; here all measurements are similar and the ear was thus stable. In contrast, Fig. 1 (center) shows seven measurements taken three to five minutes apart in the normal state; here it is evident that the preparation is unstable. When a preparation was unstable the ear was soaked in saline for several minutes to hours; in some cases the preparation returned to a stable state and in other cases it continued unstable and was then abandoned. Another source of variability within the measurements results from the state of the middle-ear cavity. Fig. 1 (right) shows two measurements taken a few minutes apart with the entrance to the middle ear at the Eustachian both open and sealed with a coverslip. It is clear that small modifications in the middle-ear cavity can have noticeable affects on the ear-canal based measurements, which is consistent with the work of Stepp and Voss (2005); here there are especially large differences between open and closed Eustachian tube for frequencies above about 3000 Hz. Thus, on a given preparation, small changes that occur in the measurements within the normal state may partially arise from modifications such as small amounts of saline remaining in the middle-ear air space or additional drilling to gain better access to middle-ear structures.
Figure 1.
Power reflectance ℛ measurements demonstrating examples of stability and changes within a preparation. LEFT: Three measurements with the ear in the normal condition, taken three to five minutes apart, demonstrating stability of the preparation. CENTER: Seven measurements with the ear in the normal condition, taken three to five minutes apart, demonstrating an unstable preparation. RIGHT: Two measurements taken in succession on an ear in the normal state but with the Eustachian tube (ET) open in one measurement and closed in the other measurement.
2.7. Statistical analysis
Comparisons between normal and manipulated states were made using a paired t-test with the Matlab function “ttest” (Matlab version 7.12.0.635). This function was used to perform a paired t-test of the hypothesis that paired measurements (one normal and one in a given manipulated state) came from distributions with equal means. The test output includes a confidence interval for the true mean of the difference between the states and a p-value indicating the probability of observing this difference by chance given that the distributions had equal means. No corrections were made for multiple comparisons across frequency.
3. Results
3.1. Measurements in the normal state
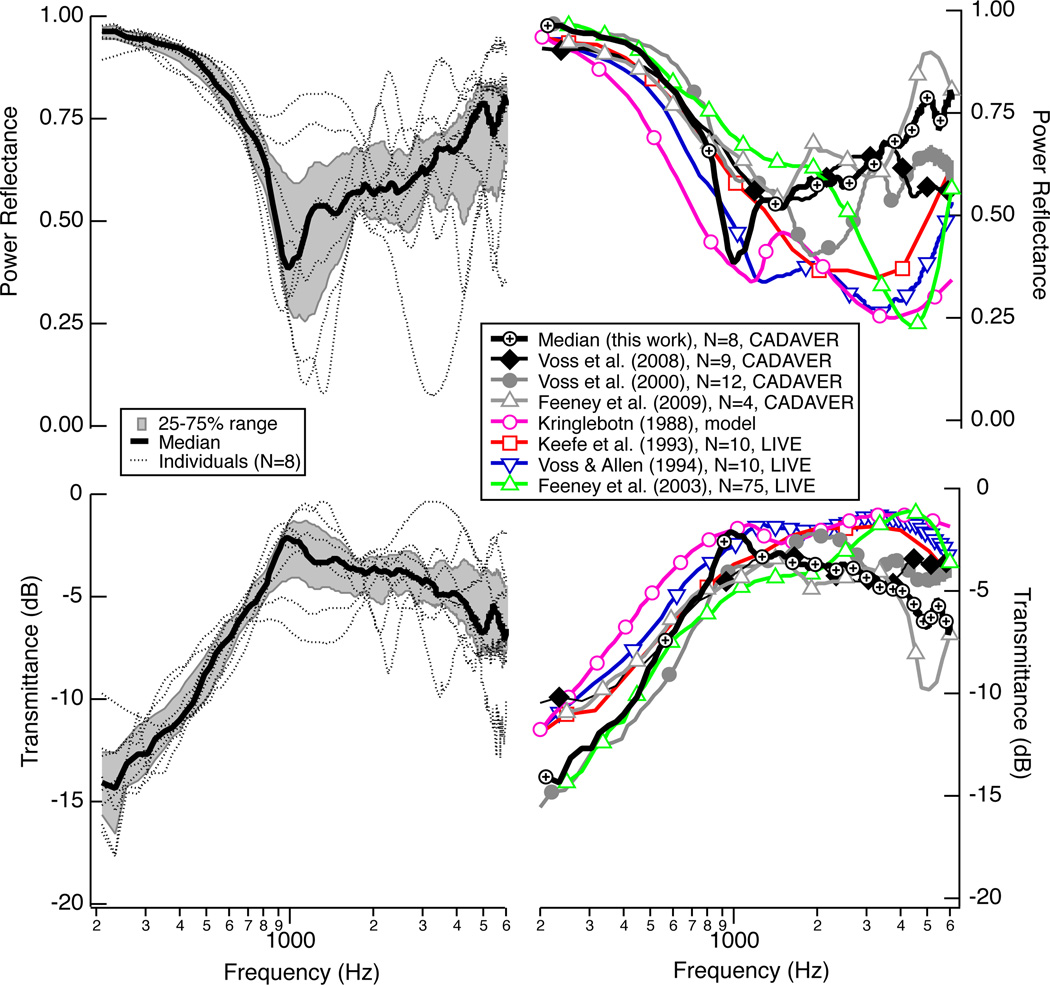
Figure 2 (left) summarizes the power reflectance ℛ and transmittance level T measured on each of the eight cadaver ears in their normal state before any middle-ear manipulations were made. ℛ is near one at the lowest frequency (200 Hz) and decreases systematically as frequency increases toward 1000 Hz; T increases with frequency from 200 to 1000 Hz. The individual measurements either have a flat ℛ (and T) for a frequency band near 1000 Hz, or they show a local minimum for ℛ (maximum for T) near 1000 Hz, and then ℛ generally increases (T decreases) slowly as frequency increases to 6000 Hz. Some individual measurements show local maximum and minimum during these transitions, and others do not. The median ℛ and T from this study population are compared with other population summaries in Fig. 2 (right); the measurements made here are generally similar to other measurements, and possible differences between cadaver and live ears are discussed in more detail by Merchant et al. (2010). Briefly, it is proposed that the larger ℛ in the cadaver populations for frequencies above 2000 Hz might result from a population of older ears, as Feeney and Sanford (2004) showed that in the 2000 to 4000 Hz range, ℛ is generally higher in older ears than in younger ears.
Figure 2.
LEFT: Power reflectance ℛ (upper) and transmittance T (lower) measurement made on eight cadaver ears in the normal state as part of this work. Within this population of eight ears are three sets of left and right ears from the same donor and two right ears from two different donors. Plotted here in thin dotted black lines is the initial normal measurement made at the beginning of each experiment. Plotted here as a thick black line is the median of these eight normal measurements, with the 25 percent to 75 percent range shaded gray. RIGHT Comparisons of the medians from the left (this work) with additional published results. For the Kringlebotn (1988) model, ℛ and T are calculated at the tympanic membrane.
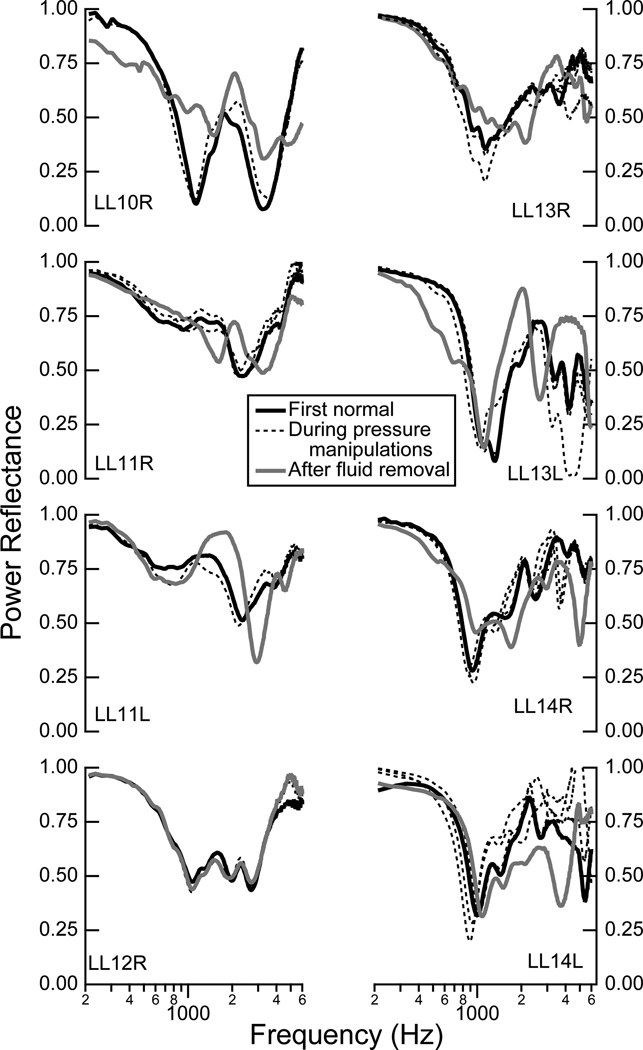
Measurements in the “normal state” were made throughout the experimental sessions; specifically, after the introduction of positive pressure, negative pressure, and fluid to the middle-ear cavity, the ear was returned to its normal state of ambient pressure or no fluid, and a measurement was made. These series of measurements in the normal state are plotted for each ear in Fig. 3. For a given ear, the general shape of ℛ remains similar in the normal state across most of the manipulations. The biggest changes occur after the removal of fluid; it is possible that not all fluid was always removed and the acoustics of the middle-ear air space could have been altered. In subsequent plots where comparisons between states are made, the normal measurement made closest in time to a manipulation is used to compute changes from normal.
Figure 3.
Comparisons of the power reflectance ℛ made in the normal state at different points during the experiment for each individual ear: before any manipulations (solid black), during positive and negative pressure manipulations (dashed black), and after fluid was added and removed (solid gray). Alpha-numeric identifiers for individual ears are indicated within each plot (e.g., LL10R corresponds to the right ear R from life legacy (LL) donor number 10).
3.2. Effects of middle-ear static pressure
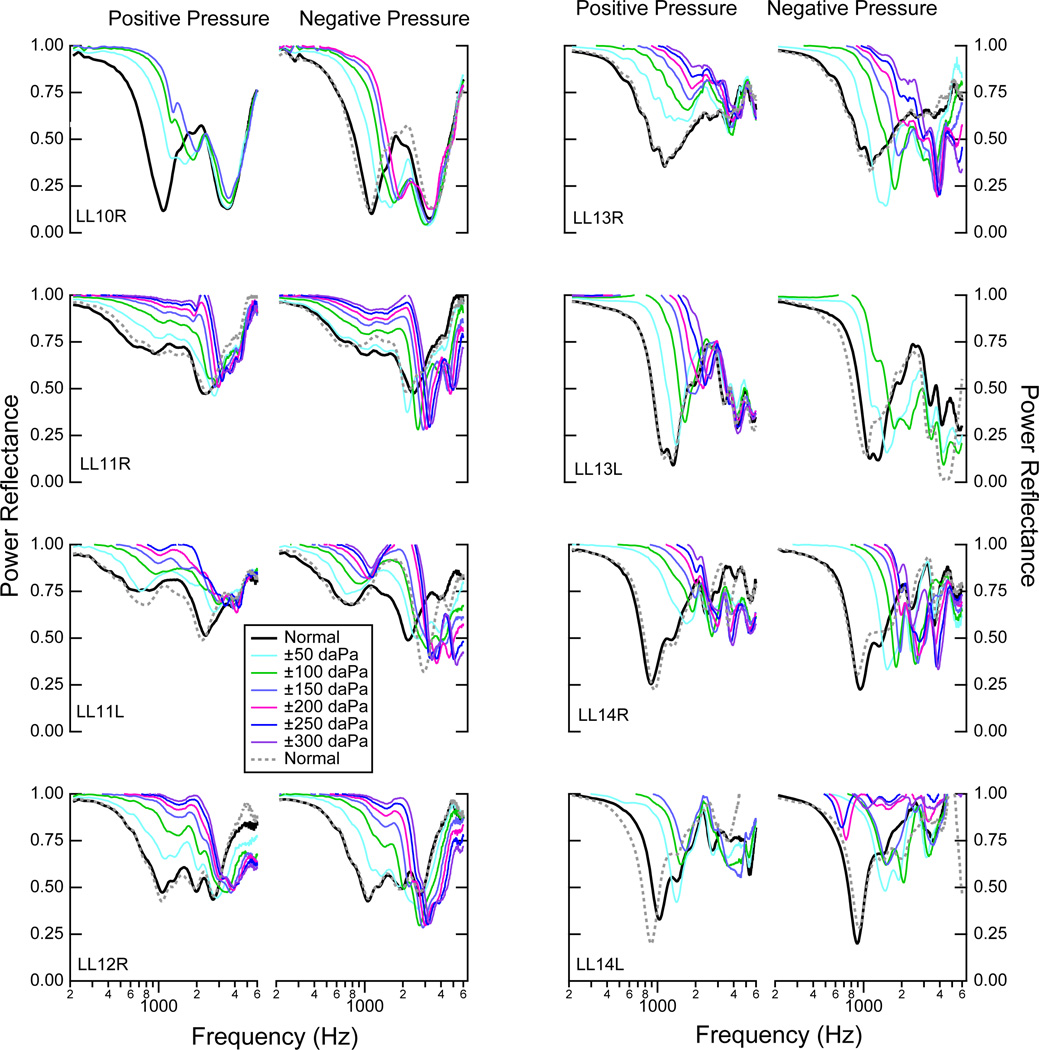
Figure 4 shows ℛ measured in each of the eight ears for positive and negative static pressures ranging from −300 to +300 daPa. As the static pressure goes from zero to ±300 daPa, the low-frequency ℛ increases and remains relatively flat across a frequency range up to some frequency fo, where fo depends on both the ear and the magnitude of the static pressure increase. In all ears, for both negative and positive pressures, fo systematically increases with increases in pressure deviations from zero. Beginning at fo, as frequency increases, there is a frequency band in which the ℛ decreases toward the ℛ measurement in the normal condition. At higher frequencies, above where ℛ approaches its values in the normal condition, the behavior of ℛ is not consistent across all ears. For the positive pressures ℛ generally mirrors the normal measurement at the higher frequencies (six of eight ears), while for the negative pressures ℛ is generally lower than the normal measurements at these higher frequencies (six of eight ears). Thus, there are asymmetries between the responses with the negative and positive pressures for the higher frequencies.
Figure 4.
Power reflectance ℛ measurements from eight ears for both positive static pressure (left columns) and negative static pressure (right columns), for pressures ranging from −300 to 300 dPa at increments of 50 dPa, as indicated by the legend. The initial normal measurement is represented by the solid black line, while the normal measurement made after the series of either positive or negative pressure manipulations is plotted as a dotted gray line, showing the extent to which the ear returned to the normal state after the pressure manipulations. In some cases there are not measurements for all of the static pressure range because acoustic leaks prevented the middle-ear cavity from maintaining the static pressures further from zero.
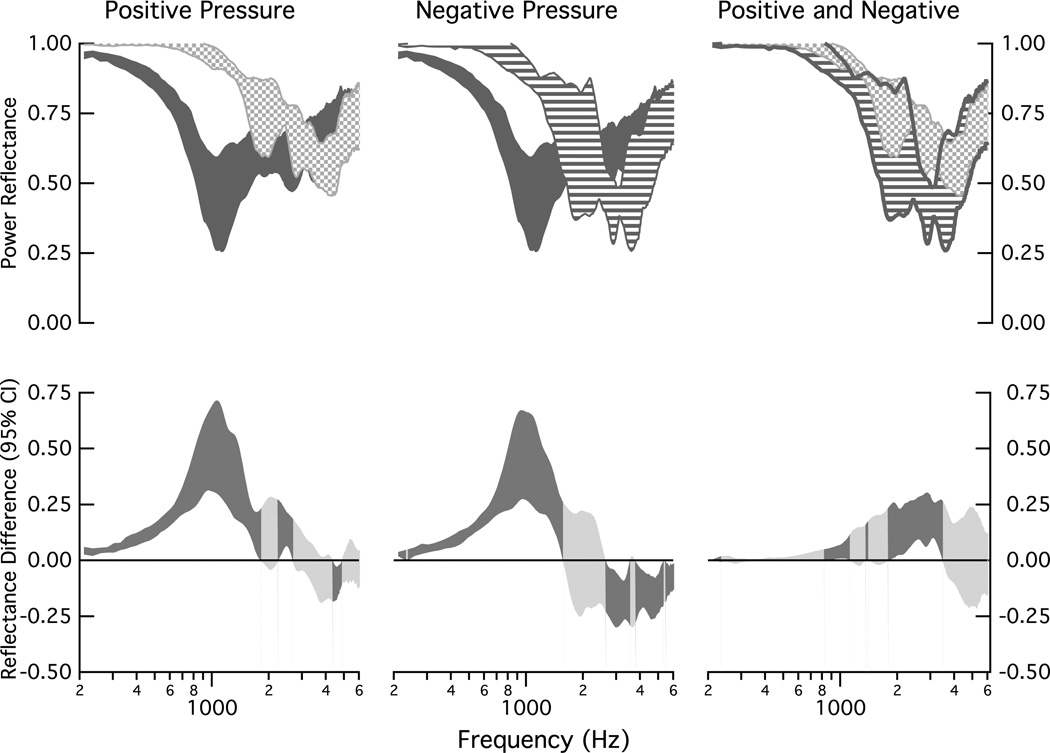
Figure 5 compares changes in ℛ across the population of ears at the middle-ear pressures of ± 150 daPa. The largest changes from normal occur at frequencies below about 850 Hz (upper left and center plots). The upper-right plot compares the changes for the positive and negative pressures; the changes are similar for frequencies below 1000 Hz and above about 3500 Hz; at the mid-frequencies, the negative pressure tends to have a lower value of ℛ than the positive pressure. The shaded regions of the lower plots in Fig. 5 show the 95% confidence intervals computed for the mean of the difference between the measurements that define the upper plots. At frequencies below about 1500 Hz (negative pressure) and 1800 Hz (positive pressure), the static pressures result in a significantly higher ℛ than normal pressure (p < 0.05), as indicated by the positive value of the confidence interval for the mean and the darker shading of the confidence interval. For a band around 2000 Hz, there are not significant changes in ℛ for these pressures and normal pressure, as indicated by a confidence interval that includes zero and is shaded the lighter gray. Above 2000 Hz, ℛ for the positive pressure is the same as that for the normal pressure at most frequencies (light shading). In contrast, above about 2600 Hz, ℛ for the negative pressure is lower than that for normal pressure at most frequencies (dark shading and confidence interval for mean negative). The right-lower plot compares the difference between the positive and negative pressures on ℛ; there are two multi-frequency bands where ℛ is significantly smaller for the negative pressure than the positive pressure: (1) 850 Hz to 1100 Hz and (2) 1800 Hz to 3500 Hz.
Figure 5.
Comparisons of population measurements of power reflectance ℛ under normal conditions and under middle-ear static pressures of ±150 daPa. Upper: All shaded regions represent the 25 to 75% range of data collected on the eight ears. The dark gray indicates the range for the ears in the normal condition, the speckled area indicates the range for +150 daPa (left and right plots), and the striped area indicates the range for the −150 daPa (center and right plots). Lower: Ninety-five percent confidence intervals computed for the mean of the difference between the eight matched measurements that defined each of the upper plots; dark shaded areas indicate regions where the mean difference differs from zero (ρ < 0.05) and lighter shaded areas indicate no difference from zero (ρ ≥ 0.05).
3.3. Effects of fluid
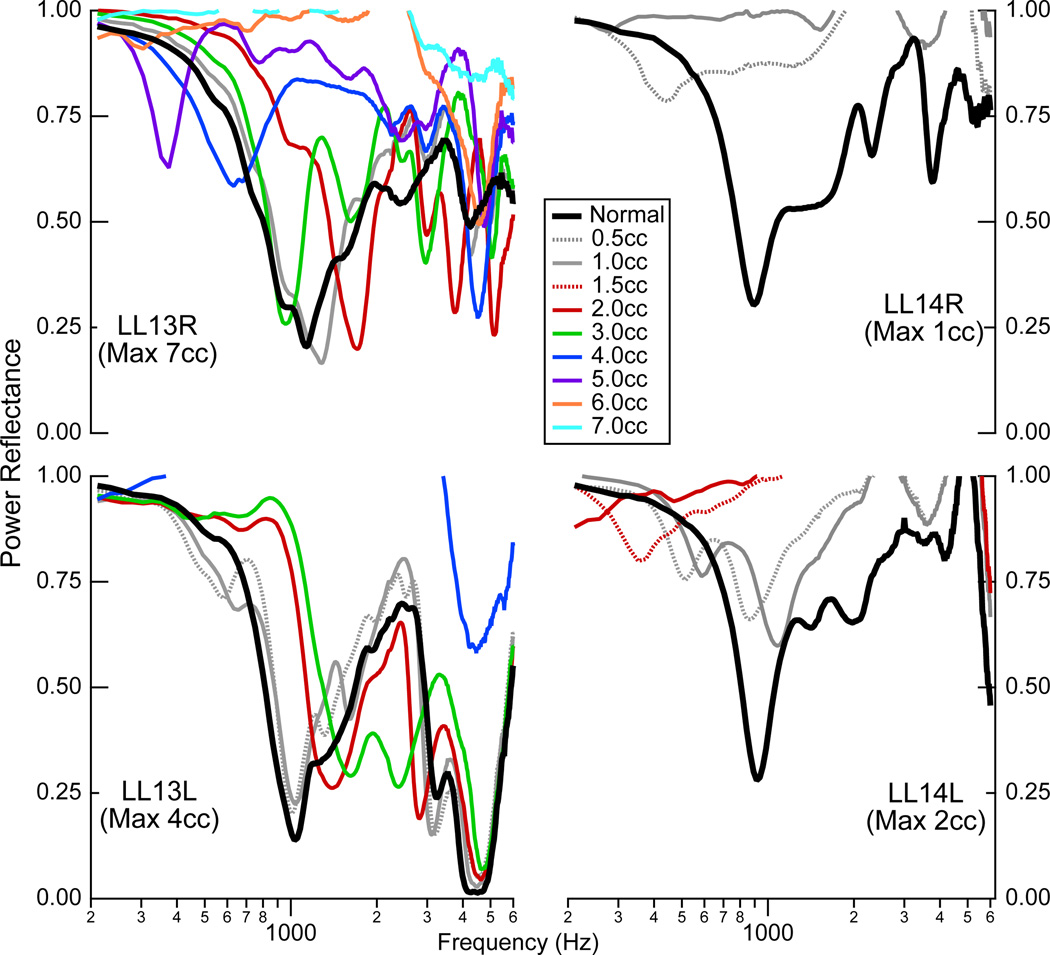
Measurements were made on four ears with fluid (saline) introduced into the middle-ear cavity (Fig. 6). The total amount of fluid inserted into this cavity varied from 1.0 cc to 7.0 cc, and measurements were made for every 0.5 cc increment of saline. The large variation across ears resulted from differently sized middle-ear cavities; in each case the cavity was filled until it appeared full, as indicated by saline leaking out of the vent tube in the mastoid cavity. The four ears came from two cadaver donors, and the middle-ear cavities from donor LL13 held substantially more fluid than those from LL14 (see the legend of Fig. 6 for amounts).
Figure 6.
Power reflectance on four ears with calibrated amounts of saline in the middle ear. Measurements were made in the normal state, and then with increasing amounts of saline added in 0.5 cc increments; in some cases, measurements are only plotted for 1cc increments in order to increase visibility within the graph. Measurements stopped when the middle-ear cavity appeared full of saline, with saline leaking out of the vent tube in the mastoid cavity.
The effects of fluid on ℛ are neither simple nor systematic. A small amount of fluid relative to the volume of the middle-ear cavity appears to have minimal effects on ℛ. This is seen in the measurements on the two ears from donor LL13, where measurements with up to 1 or 1.5 cc of saline in the cavity are similar to the normal measurement. For the effect of fluid on ℛ with a middle-range of fluid filling the cavity, consider the two ears from LL13 with fluid levels of 2 to 3 cc. Here, the ℛ measurements have patterns similar to those with static pressure in the middle ear: ℛ increases from normal and is relatively flat at the lower frequencies and ℛ is closer to normal at the higher frequencies. As the fluid fills the cavity more, perhaps above some threshold that might be about 3 cc in the two ears from LL13 and above 0.5 in the two ears from LL14, ℛ shows a different pattern with two consistent features: (1) there seems to be a low frequency notch in two of the ears (LL13 ℛ and LL14L) and (2) ℛ remains close to 1 over a broader frequency range.
3.4. Effects of fixation and disarticualtion
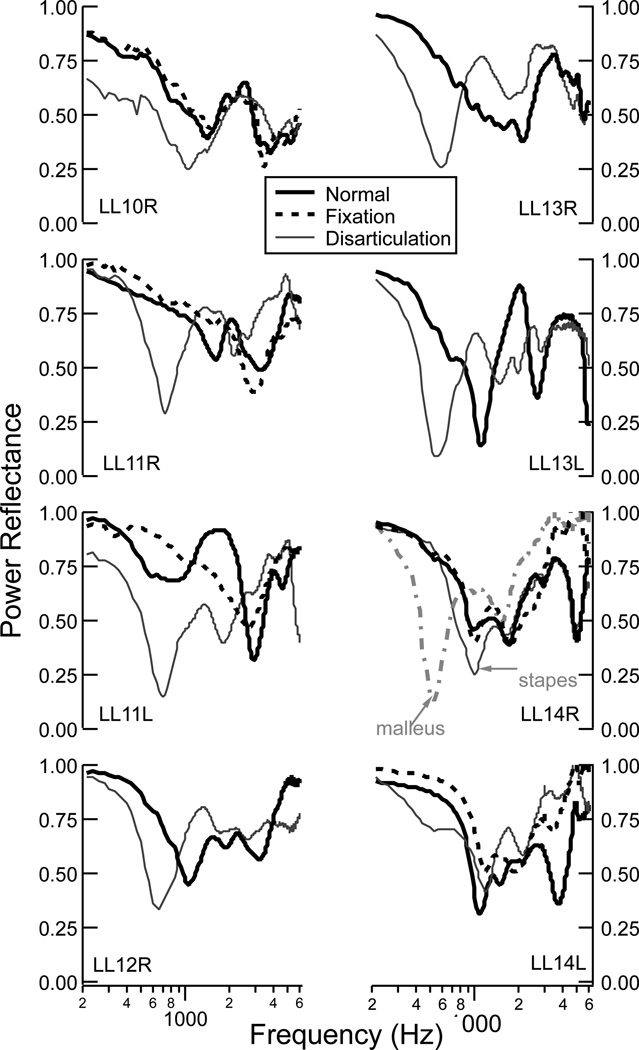
Figure 7 shows ℛ from ears that had the stapes fixed with dental cement and the ossicles disarticulated. For the five cases where the stapes footplate was visible, dental cement was first applied to fix the stapes (LL10R, LL11 left and right, and LL14 left and right), the ear sat for 10 minutes for the cement to harden, and measurements were made. In three of the five ears (LL11R, LL11L, and LL14L), fixation of the stapes led to small increases in ℛ, primarily at the lower frequencies below about 2000 Hz. In the other two ears (LL10R and LL14R), the lower frequencies were minimally affected by the stapes fixation, with some effects at the higher frequencies (> 4000 Hz) for one ear (LL14R).
Figure 7.
Measurements of ℛ for eight ears in the normal state and for the states of stapes fixation and ossicular disarticulation. Five of the eight ears provided adequate visibility to fix the stapes (dashed black line for LL10R, LL11R, LL11L, LL14R, and LL14L). The incudostapedial joint (solid gray line) was disarticulated on all eight ears, and the incudo-malleolar joint (dashed gray line) was disarticulated on one ear (LL14R).
The incudo-stapedial joint was disarticulated in all eight ears, and in one ear (LL14R) the incudo-malleolar joint was also disarticulated after the incudo-stapedial joint. In general, disarticulation of the incudo-stapedial joint led to a low-frequency reduction in ℛ. Additionally, the disarticulation had a sharp minima in ℛ at a frequency below 1000 Hz. Disarticulation of the incudo-malleolar joint showed a similar effect to the incudo-stapedial joint; within the same ear, the incudo-malleolar joint had a sharper minimum in ℛ that occured at a lower frequency than with the incudo-stapedial join disarticulation.
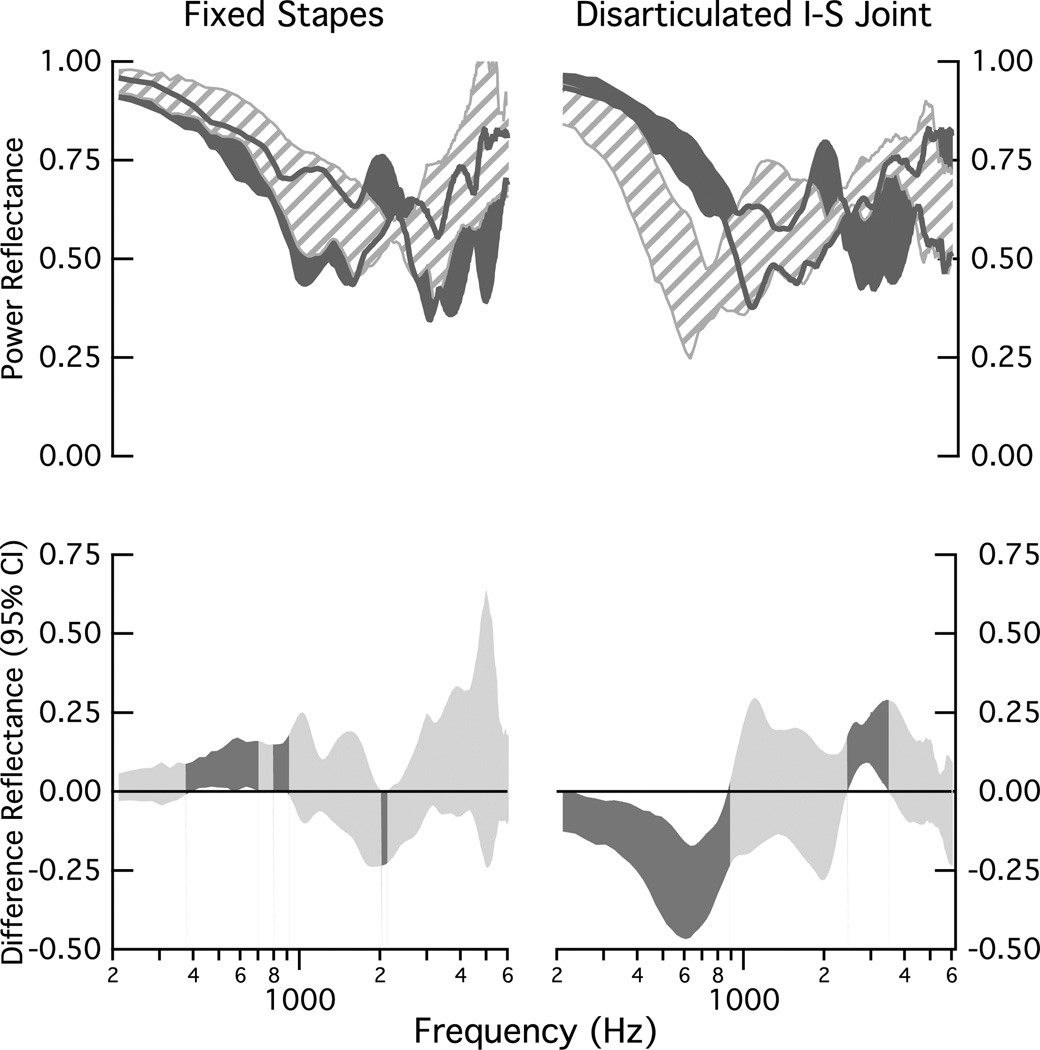
Figure 8 compares changes in ℛ across the population of ears for the fixed stapes (left column) and the disarticulated incudo-stapedial joint (right column). For the fixed stapes, the changes are modest. At lower frequencies, there are two significant frequency bands encompassing the frequencies 400 to 700 Hz and 800 to 900 Hz for which ℛ increases with fixation. There is one mid-frequency band of 2000 to 2100 Hz for which ℛ decreases with fixation (lower-left plot). For the disarticulated case, the significant differences from normal occur in the two frequency bands of (1) below 900 Hz and from 2500 to 3500 Hz; within the lower frequency band ℛ decreases with disarticulation, and within the mid-frequency band ℛ increases with disarticulation.
Figure 8.
Comparisons of population measurements of power reflectance ℛ under normal conditions and with stapes fixation (left) and incus-stapes (I-S) disarticulation (right) manipulations. Upper: All shaded regions represent the 25 to 75% range of data collected on the eight ears. The dark gray indicates the range for the ears in the normal condition and the striped area indicates the range for the manipulation. The dark gray lines indicate the edges of the shaded region for the normal ears. Lower: Ninety-five percent confidence intervals computed for the mean of the difference between the eight matched measurements that define the upper plots; dark shaded areas indicate regions where the mean difference differs from zero (ρ < 0.05) and lighter shaded areas indicate no difference from zero (ρ ≥ 0.05).
3.5. Effects of tympanic-membrane perforations
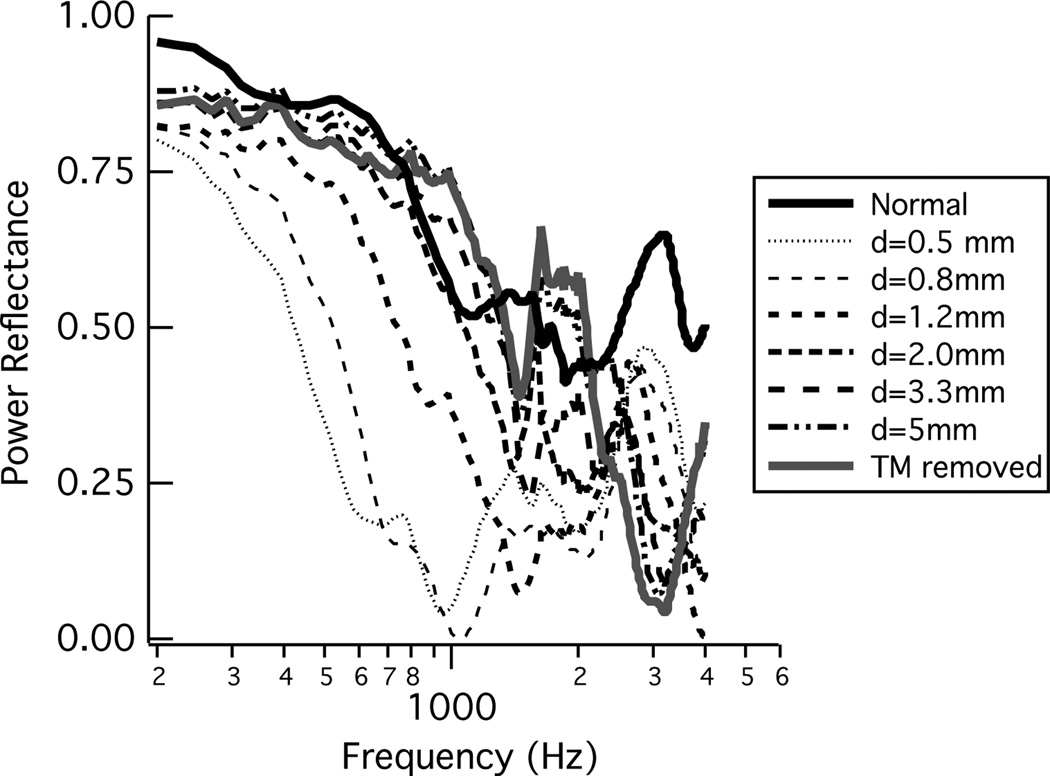
Voss et al. (2001a,b) report acoustic ear-canal based measurements from 11 cadaver ears with perforations made in the tympanic membrane (TM). All eleven ears showed similar responses, and one ear was used as an “example ear” throughout these two articles. Here, the results from the example ear, Ear 24L, are analyzed and plotted in terms of ℛ (Fig. 9). The biggest changes in ℛ from normal are with the smallest perforations, where ℛ decreases at all frequencies and most substantially at frequencies below about 2000 Hz. As the perforation size increases, the low-frequency ℛ systematically increases toward the normative value for ℛ. At frequencies less than about 1000 Hz the ℛ always remains a bit lower than the normative value, and while the responses above about 1000 Hz are less systematic, ℛ is generally below its normative value there too.
Figure 9.
Power reflectance ℛ from an ear with a systematic series of increasing-sized tympanic-membrane perforations. ℛ was calculated from measurements of acoustic impedance on ear 24L from Voss et al. (2001a,b).
4. Discussion
4.1. Summary of Results
The cadaver-ear preparation allowed for a systematic study of how power reflectance ℛ is affected by well-controlled manipulations that mimic middle-ear disorders. A strength of this approach is that the measurements in the pathological condition can be compared to measurements in the normal condition on the same ear. A brief summary of the measured changes for each of the conditions under study is listed here, along with a qualitative comparison to any similar measurements available in the literature.
4.1.1. Middle-ear static pressure
For frequencies below about 2000 Hz, systematic increases in both negative and positive middle-ear static pressure (up to ± 300 daPa) resulted in systematic increases in ℛ, and the effects were similar for negative and positive middle-ear pressures. At frequencies above about 2000 Hz, the effect of the static pressure change from zero differed for negative and positive pressures. The difference in ℛ between positive and normal pressure was not significant at most frequencies above 2000 Hz, while the difference between negative and normal pressure was significantly below zero for most frequencies above 2000 Hz.
These results have some inconsistencies with the reflectance measurements from Beers et al. (2009), where measurements of ℛ where made on children (5–7 years) with negative middle-ear pressures. Beers et al. (2009) reported means of ℛ values that were greater for negative middle-ear pressure than normal ears for most frequencies from 250 to 6300 Hz. The results presented here here are consistent with the Beers et al. (2009) results only for frequencies below 2000 Hz; above 2000 Hz the measurements here show ℛ decreased relative to normal. Additionally, Beers et al. (2009) showed that ℛ values were not statistically different between mild negative middle ear pressure and severe negative middle ear pressure at any frequency tested, whereas the results presented here show systematic changes as static pressures increase away from zero. One possible explanation for this latter finding may be that the distinction of mild and severe middle-ear pressures made by Beers et al. (2009) had much less resolution than the measurements made here.
The ℛ results presented here are consistent with the work of Murakami et al. (1997), where umbo displacements decreased with both positive and negative middle-ear pressures for frequencies below about 2000 Hz, but showed an asymmetry above 2000 Hz with increases in umbo displacement for negative middle-ear pressures and displacements close to those at ambient pressure for positive middle-ear pressures. The umbo-displacement measurements of Gan et al. (2006) also decreased at frequencies below about 2000 Hz, but their higher frequency measurements don’t show the increase in umbo velocity above 2000 Hz with negative middle-ear pressures. Figure 12(c) of Gan et al. (2006) provides a direct comparison of the positive and negative pressure data from both their work and that of Murakami et al. (1997), which both demonstrate symmetrical results for umbo displacement at 1000 Hz with positive and negative pressures on human cadaveric preparations.
Figure 12.
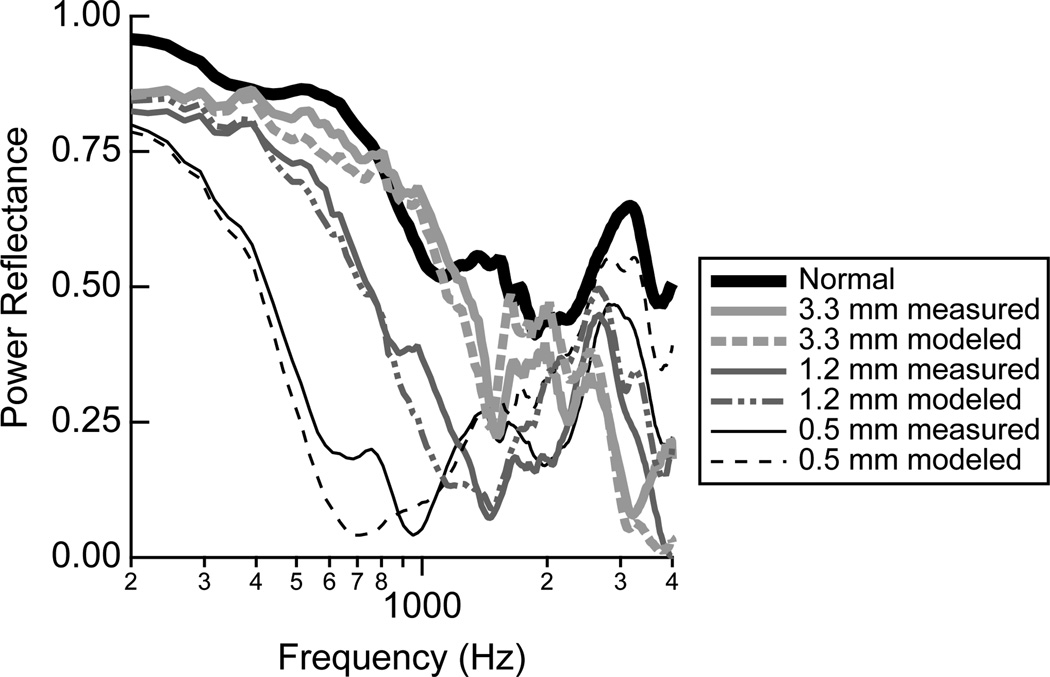
The power reflectance ℛ for both the individual measurements and the model predictions with a tympanic-membrane perforation. The measurements and model from Voss et al. (2001a,b) were used to calculate ℛ; shown here are the calculations from one example ear, Bone24L.
Similar features of our results can also be seen in the reflectance tympanom-etry measurements on normal ears made by both Keefe and Levi (1996) and Margolis et al. (1999); however, these reflectance measurements pressurized the ear canal in line with tympanometric measurements while here we pressurized the middle-ear air space in line with middle-ear disease. Thus, direct comparison of the two types of measurements and their asymmetries between negative and positive pressures is not feasible. We note that while it is well known that tympanometric measurements show asymmetries between their responses at positive and negative ear-canal static pressures at lower frequencies (Margolis and Smith, 1977), this situation differs from the measurements discussed here; Sun (2011) provides a discussion on how changes in ear-canal static pressure are both similar to and different from changes in middle-ear static pressure.
4.1.2. Middle-ear fluid
Measurements made on ears with fluid in the middle-ear air space depended on the percentage of the air space that was filled. Changes in ℛ were minimal when a smaller fraction (less than about 50%) of the air space was filled with fluid, and as the air space was filled more and more, ℛ increased at most frequencies. For some measurements where the cavity was nearly fully filled, a sharp minima in ℛ occurred at a lower frequency around 200 to 500 Hz. These measurements are consistent with measurements on live-subject ears with otitis media from Piskorski et al. (1999)[N=1], Feeney et al. (2003)[N=4] and Allen et al. (2005)[N=1], all of which have a power reflectance near 1 for frequencies up to at least 2000 Hz, although these live-ear measurements do not show any sharp minima at the lower frequencies. The ℛ measurements are also consistent with umbo-motion measurements from both Ravicz et al. (2004) and Gan et al. (2006); Figure 13 of Gan et al. (2006) summarizes these results in terms of umbo displacement and shows that for cavities filled at about 50% the umbo motion is primarily reduced at frequencies above about 1000 Hz, and as the cavity becomes nearly fully filled the umbo displacement is reduced across all frequencies. The sharp minima and rapid fluctuations with frequency in some of our ℛ measurements are not apparent in the mean results reported by Gan et al. (2006), but are apparent in some of the measurements from Ravicz et al. (2004); one explanation is that some of these rapid changes with frequency might result from air bubbles present with the fluid in the cavity, as Ravicz et al. (2004) was sometimes able to modify similar fluctuations by the removal of air. At the same time, the presence of small air bubbles in our ears likely do not affect the overall behavior of the ℛ measurements; the umbo-motion measurements of both Ravicz et al. (2004) and Gan et al. (2006) are similar and Gan et al. (2006) did not take measures to remove air and did not fill their ears with as much fluid as that used here or by Ravicz et al. (2004).
Figure 13.
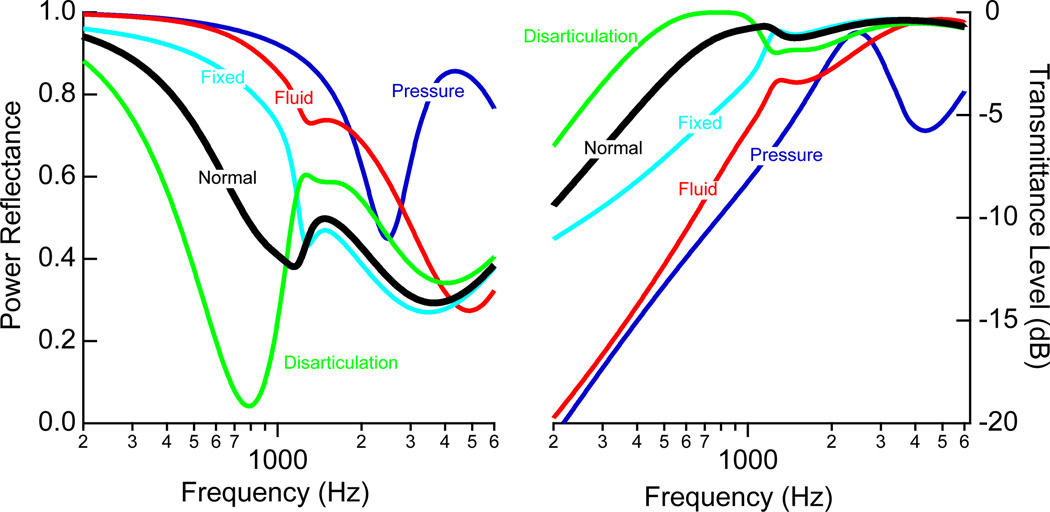
Summary of the model predictions for power reflectance ℛ (left) and transmittance level T (right). The predictions correspond to the cases of: 0.1C for static pressure, 0.05C for middle-ear fluid, and 0.001C for stapes fixation. Tympanic-membrane perforations are not included here because both ℛ and T are heavily dependent on perforation size (see Fig. 12).
4.1.3. Stapes Fixation
Fixation of the stapes resulted in a small (compared with fluid and pressure) low-frequency increase in ℛ in four of the five ears; in one ear, the low-frequencies were barely affected by the fixation (LL14R). In three of the five ears, the response was similar to normal above about 2000–3000 Hz, and in two of the ears the fixation increased ℛ at the higher frequencies. The decreased low-frequency response in ℛ measured in this work is consistent with the otosclerotic ears presented by Allen et al. (2005) (N=2) and Shahnaz et al. (2009) (N=28); in those cases the measurements are compared to means of normal populations while here the measurements are compared to measurements on the ears themselves in the normal state.
4.1.4. Stapes Disarticulation
Disarticulation of the stapes led to a consistent low-frequency decrease in ℛ, with a distinctive minimum below 1000 Hz. These results are consistent with similar measurements on five cadaver-ear preparations reported by Feeney et al. (2009).
4.1.5. Tympanic-membrane Perforations
Perforations of the tympanic membrane led to a decrease in ℛ for frequencies up to about 2000 Hz. The smaller perforations led to larger changes from normal, so that as perforation size increased, for frequencies below about 1000 Hz, ℛ approached the responses for the normal ear. As discussed further below, these measurements don’t mean that sound is transmitted to the cochlea equally for the normal and larger tympanic-membrane perforation cases, but instead that sound energy is absorbed by the middle ear similarly in both cases. For frequencies above about 1000 Hz, ℛ does not approach that for a normal ear as perforation size increases; in general ℛ is smaller than normal for the perforated ear. There is one measurement of ℛ in the literature with a perforated tympanic membrane (Allen et al., 2005); the trends in the measurement are similar to that presented here, but the middle-ear air space volume, which has a major impact on ℛ, is not known (Voss et al., 2001a,b).
4.2. Model
Systematic changes from normal occurred in the power reflectance for all of the tested conditions. In this section, we compare these changes on the cadaver-ear preparation to those predicted by a lumped-element circuit model. We note that our goal is to understand the trends in the changes and not to model exact changes for an individual ear, as the model we start with is for an average normal ear and not for the specific ears measured within this work. Our goal is for this model to improve understanding of the mechanisms that lead to modification of ℛ by specific disorders.
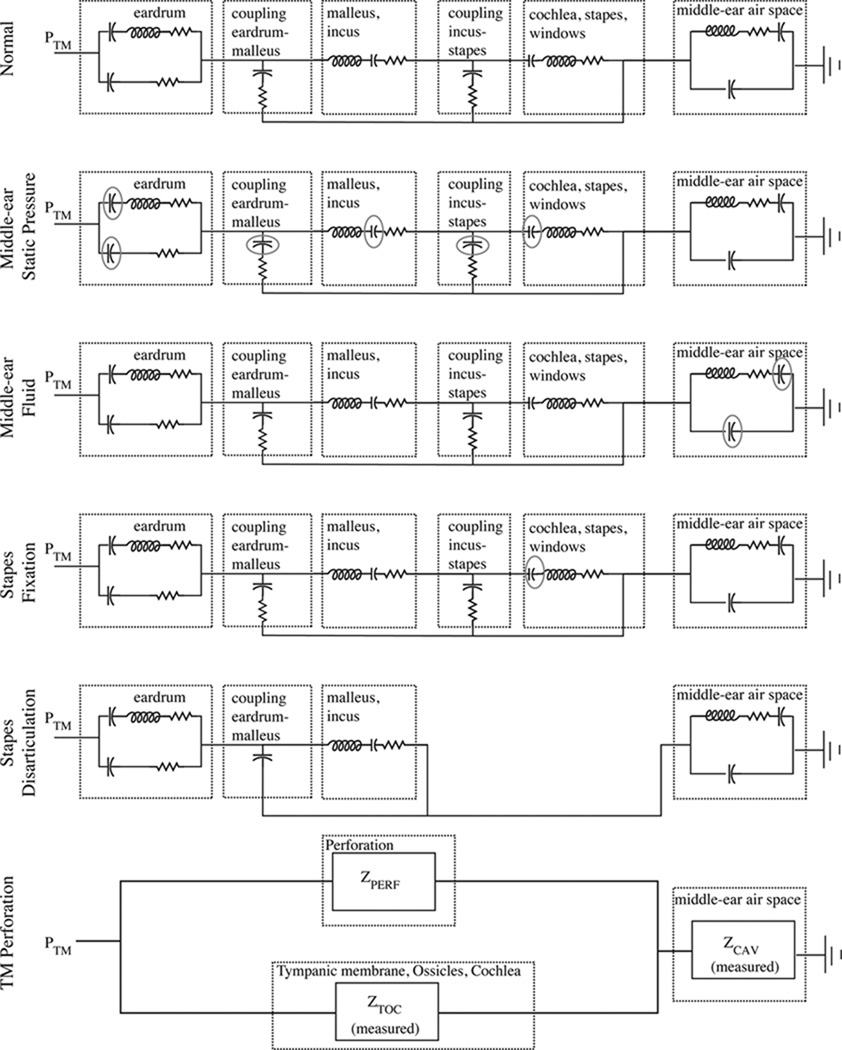
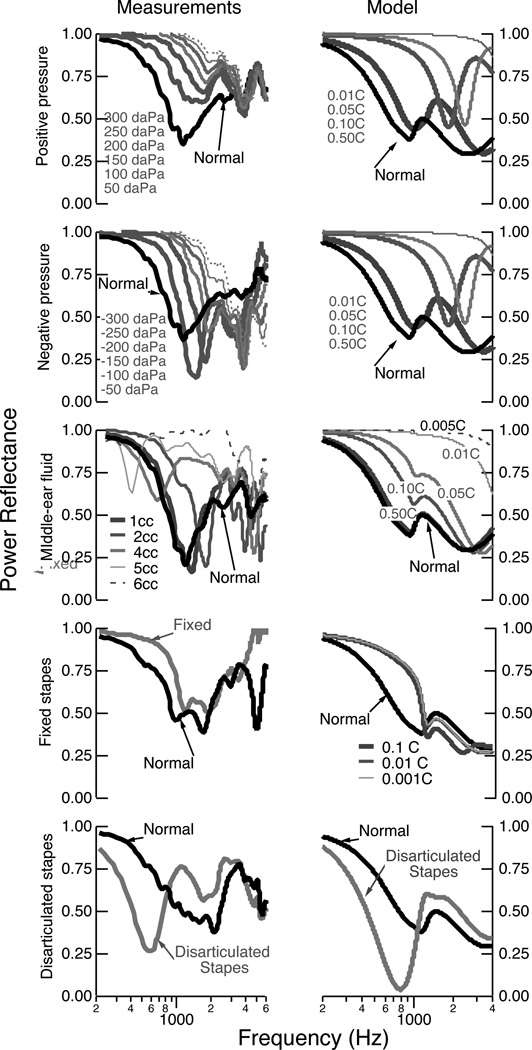
Figure 10 shows the lumped-element model for the average normal ear (top) and for each of the disordered conditions that were implemented on the cadaver-ear preparation. The top panel is the lumped-element model of the average normal ear developed by Kringlebotn (1988), and the parameter values for each element can be found in that work2. We have used the component values for the middle-ear air space first proposed by Kringlebotn (1988), but we note that more recent work has demonstrated substantial variability in these values across normal ears (Voss et al., 2000; Stepp and Voss, 2005); ideally we would have incorporated ear-specific measurements of the middle-ear air space impedance into our model predictions, but unfortunately these measurements were not made. Some differences between our model predictions and measurements across different ears, particularly locations and amplitudes of the maxima and minima, are likely a result of the varying anatomies of the middle-ear air spaces. ℛ was calculated from the input impedance of the lumped-element models at the tympanic membrane. Calculations for the normal and the disordered conditions are shown in Figs. 11 and 12, where we have qualitatively compared the model prediction for an average ear to an example of measurements from one ear. We note, measurements from all ears are in the results section.
Figure 10.
Electric-circuit analog models that represents structures of the middle ear (Kringle-botn, 1988). Outlined sections illustrate the functional representations of the model, and the exact model-element values are described in Kringlebotn (1988). Modifications from Kringle-botn’s model for the normal ear are described within the text. PTM is the pressure at the tympanic membrane, and the power reflectance ℛ and transmittance T are calculated from the input impedance at the tympanic membrane. The acoustic quantities of sound pressure and volume velocity are analogous to the electric quantities of voltage and current. Acoustic losses are represented as resistors, compliances as capacitors, and masses as inductors.
Figure 11.
The power reflectance ℛ for the individual measurements (left column) and the model predictions (right column). For the measurements, one ear was selected to act as an example comparison (see earlier plots for all results). The upper two rows compare the measurements with positive and negative middle-ear pressure; here the model provides calculations with all compliances indicated by a circle in Fig. 10 adjusted by the factors of 0.01, 0.05, 0.10, and 0.50. The middle row compares the measurements and model for middle-ear fluid; the model modifies the volume of the middle-ear air space by changing the compliance of the middle-ear air space by factors of 0.005, 0.01, 0.05, 0.10, and 0.50, effectively changing the “normal” middle-ear air space volumes of the mastoid at 5.6 cm3 and the tympanic cavity at 0.57 cm3 to volumes multiplied by these same factors. The fourth row shows the effects of decreasing the compliance of the annular ligament by factors of 0.1, 0.01, and 0.001. The fifth row shows the effect of the disarticulated stapes.
The normal model was modified to represent each of the disordered conditions. Working from the top downward in Figs. 10 and 11, we describe the model alterations and compare the model predictions to the measurements. Middle-ear static pressure affects the middle-ear system by reducing the compliance of the middle-ear structures including the tympanic membrane. The elements that represent these middle-ear compliances are circled within the circuit model for static pressures in Fig. 10. The upper two rows of Fig. 11 compare the measurements and model predictions for middle-ear static pressure. In general, the measurements and model show similar trends, with increasing static pressure (measurements) and corresponding decreasing compliances (model), leading to the same systematic trends in the results. We note that while the model does not differentiate between positive and negative pressures, the measurements here do show differences between positive and negative pressures, possibly a result of some of the compliances within the middle ear reacting differently to the positive versus negative pressures and leading to different behaviors in the 2000–3500 Hz range.
The complicated effects of middle-ear fluid on middle-ear function are studied and reviewed thoroughly by Ravicz et al. (2004). Briefly, middle-ear fluid can affect the middle ear in at least two general ways: the reduction of the middle-ear air space and the mechanical loading of the fluid on the ossicles and tympanic membrane. Ravicz et al. (2004) use measurements on a cadaver-ear preparation to draw several important conclusions related to middle-ear function with fluid, including: (1) the effects of the viscosity of the fluid are either nonexistent or so small that they were not measurable (leading our experimental design to employ only saline), (2) for low frequencies (less than 800 Hz), changes in umbo velocity result from a decrease in the volume of the middle-ear air space and not from mechanical loading of the tympanic membrane, and (3) for higher frequencies (at and above 2000 Hz), the primary mechanism for reduction in umbo velocity with fluid is the loading of the tympanic membrane and not the volume of air in the cavity. Here, we have modified the model of the normal ear to account for changes in the middle-ear cavity volume via changes in the compliances that represent this volume (appropriate compliances are circled in the third row of Fig. 10); we do not have a way to alter the model to account for increased loading of the tympanic membrane and ossicles, and thus this model is only appropriate for the lower frequencies at and below about 800 Hz. The third row of Fig. 11 compares the measurements to the model calculations; the general trend of increases in ℛ for the lower frequencies are present in the model, yet the fine structure of local maxima and minima at the lower frequencies are absent in the model. As frequency increases above 1000 Hz, the model becomes less appropriate and the measurements and model are not comparable, as the fluid loading mechanisms are absent in the model.
To study stapes fixation, the model was adjusted to reduce the compliance of the annular ligament (circled in the fourth row of Fig. 10); as this compliance decreases, the impedance at the oval window increases toward infinity, essentially becoming an open circuit at that point. Since fixation occurs in varying degrees, we alter the compliance instead of simply making it an open circuit. The fourth row of Fig. 11 compares an example measurement with the model predictions for a fixed stapes. The trends are similar in that the fixation increases the low-frequency ℛ for both the measurements and the model. The model further suggests that when the annular-ligament’s impedance approaches infinity (modified compliance by a factor of 0.001), the changes in ℛ from normal reach a limit; the interpretation is that there are multiple compliances in the middle-ear system that affect ℛ so that even when the stapes is effectively immobile there is still movement within the middle-ear system. Thus, this model offers a limit for how much one might expect ℛ to change as a result of total stapes fixation. The changes are most prominent below 1000 to 2000 Hz, where the annular ligament is known to affect the middle-ear input impedance more than at higher frequencies (e.g., Murakami et al., 1998; Büki et al., 1996; Merchant et al., 1996; Lynch et al., 1982).
Incus-stapes disarticulation was modeled by connecting the malleus and incus directly to the middle-ear air space and bypassing the connection to the cochlea, stapes and windows (fifth row of Fig. 10). The model predictions (fifth row of Fig. 11) are similar to the measurements with a substantial low-frequency reduction and minima in ℛ. This behavior is a result of a middle ear that is no longer connected to the cochlea but is instead dangling within the middle-ear air space. Thus, even though the ℛ plots naively suggest that sound is absorbed and not reflected, the sound is actually dissipated within the middle-ear cavity and is not transferred to the cochlea, thus reducing hearing sensitivity.
Extensive measurements and corresponding models of sound transmission with tympanic-membrane perforations were reported by Voss et al. (2001a,b). These measurements and models are used here to demonstrate the effects of perforations on ℛ, which was not addressed in the previous work. These results differ slightly from the work presented for the other middle-ear disorders in that the middle-ear air space was modeled for each ear based on ear-specific measurements of the impedance of the middle-ear air space. The model for the ear with a tympanic membrane is shown in the lowest row of Fig. 10. Briefly, the impedance of the perforation (ZPERF), which depends on the thickness of the tympanic membrane and the diameter of the perforation, acts as a shunt for volume velocity to flow directly from the ear canal to the middle-ear air space. The prior work demonstrated that the major mechanism for changes in sound transmission with most perforations (except very large ones) is the loss of pressure difference across the tympanic membrane and not the physical change in the tympanic membrane, thus leaving the eardrum portion of this model intact. Additionally, the component values from Kringlebotn (1988) are not used within the model for the tympanic membrane perforation, but instead measurements made on each individual ear form this section of the model, here referred to as ZTOC (Voss et al., 2001b). Figure 12 compares the measurements and models for ℛ and T. The model here is heavily based on measurements on the particular ear, and thus the model and measurements match well; ℛ is reduced from normal with a perforation, and the largest changes result from the smallest perforations for which the middle-ear cavity absorbs more of the sound energy.
4.3. Clinical implications
The measurements and models presented here provide additional data for determining how and when reflectance measurements can be useful in assessing middle-ear function. One challenge in this area is that there is substantial variability in reflectance measures among normal ears. As a result, it seems likely that while ℛ and T might provide clinicians additional information, they may not always be useful in isolation of other traditional audiologic measures. Figure 13 compares the model predictions for all of the disorders under study, so as to provide a summary for how the pathologies collectively affect ℛ and T. While there are clear trends for each of the pathological conditions and the model has explained how ℛ and T change from normal, it is possible that in some ears the changes from an average normal might not be extensive enough to determine the nature of the middle-ear pathology.
Figure 5 suggests that measurements of ℛ on ears with ± 150 daPa of middle-ear pressure are distinguishable from normal ears, and the most useful frequency range for the comparison is up to about 1500 Hz. At the same time, static pressure or fluid in the middle-ear air space both result in similar ℛ patterns, where the magnitudes of the changes from normal depend on the magnitude of pressure or amount of fluid involved (e.g., Figs. 4 and 6). Thus, it seems unlikely that the measures of ℛ by themselves would be able to distinguish middle-ear static pressure from middle-ear fluid; in this case, measurements of either tympanometry or ℛ made with ear-canal pressures held at tympanometric values might be helpful in determining the state of the middle ear (Margolis et al., 1999).
The measurements and models both show systematic but small changes in the case of stapes fixation, consistent with the work of Shahnaz et al. (2009). ℛ increases for frequencies up to 1000 Hz, but in most cases the measurements with stapes fixation overlap substantially with the normal measurements (Fig. 8); thus, with large numbers of ears it may be able to distinguish means of ℛ that differ in a statistically significant manner, yet detecting stapes fixation on an individual ear by comparing it to mean measurements of ℛ will not always work. Shahnaz et al. (2009) concludes that the use of reflectance measures can improve the detection of otosclerotic ears, but only when reflectance measures were used in conjunction with multifrequency tympanometry were they able to detect all 28 otosclerotic ears within their population.
The change in ℛ from normal to a disarticulated stapes has perhaps the most consistent affect across the ears shown here and those reported by Feeney et al. (2009), where ℛ shows a well-defined minimum at a frequency below 1000 Hz. It might be that reflectance measures are well suited to confirm ossicular discontinuities.
The effect of a tympanic-membrane perforation is highly dependent upon both the size of the perforation and the volume of the mastoid space. It seems that perforations might be best detected via tympanometry, which in the presence of a perforation would provide an estimate of ear-canal volume that would exceed the volume expected only for the ear canal.
Acknowledgments
We thank Dooshaye Moonshiram for helping to collect some of the data presented here. John Rosowski and two anonymous Ear and Hearing reviewers provided thoughtful and helpful comments on the manuscript. This work was supported by grant NIH 1 R15 DC007615-01 from the NIDCD, National Institutes of Health. Preliminary accounts of this work have been presented in parts by Voss et al. (2008b) and Voss et al. (2010).
Abbreviations
- ℛ
Power reflectance
- T
Transmittance
Footnotes
Publisher's Disclaimer: This is a PDF file of an unedited manuscript that has been accepted for publication. As a service to our customers we are providing this early version of the manuscript. The manuscript will undergo copyediting, typesetting, and review of the resulting proof before it is published in its final citable form. Please note that during the production process errors may be discovered which could affect the content, and all legal disclaimers that apply to the journal pertain.
Power reflectance is equivalent to the commonly reported energy reflectance; we prefer the term power over energy because power refers to energy per unit time, which is the measured quantity in the steady-state environment of an averaged pressure response in the ear canal.
Here, we have moved the middle-ear air space components within the model topology so that they connect the cochlear, stapes, windows box and ground. This topology does not change the model, as the middle-ear air space is in series with the rest of the ear and the same pressure (or voltage) is set up across the middle-ear air space component. This alternative way of presenting the model is more intuitive to us because the pressure within the middle-ear air space is referenced to ground.
Contributor Information
Susan E. Voss, Email: svoss@smith.edu, Picker Engineering Program, Ford Hall Smith College, Northampton, MA, USA, phone: 413 585-7008.
Gabrielle R. Merchant, Smith College, Northampton, MA, USA
Nicholas J. Horton, Email: nhorton@smith.edu, Department of Mathematics and Statistics Smith College, Northampton, MA, USA.
References
- Allen JB. Measurement of eardrum acoustic impedance. In: Allen JB, Hall JL, Hubbard A, Neely ST, Tubis A, editors. Peripheral Auditory Mechanisms. Springer-Verlag; pp. 44–51. [Google Scholar]
- Allen JB, Jeng PS, Levitt H. Evaluation of human middle ear function via an acoustic power assessment. Journal of Rehabilitation Research and Development. 2005;42:63–78. doi: 10.1682/jrrd.2005.04.0064. [DOI] [PubMed] [Google Scholar]
- Beers AN, Shahnaz N, Westerberg BD, Kozak FK. Wideband reflectance in normal caucasian and chinese school-aged children and in children with otitis media with effusion. Ear Hear. 2009;31:221–233. doi: 10.1097/AUD.0b013e3181c00eae. [DOI] [PubMed] [Google Scholar]
- Büki B, Avan P, Lemaire JJ, Dordain M, Chazal J, Ribari O. Otoacoustic emissions: a new tool for monitoring intracranial pressure changes through spates displacements. Hear. Res. 1996;94:125–139. doi: 10.1016/0378-5955(96)00015-9. [DOI] [PubMed] [Google Scholar]
- Farmer-Fedor BL, Rabbitt RD. Acoustic intensity, impedance and reflection coefficient in the human ear canal. J. Acoust. Soc. Am. 2002;112:600–620. doi: 10.1121/1.1494445. [DOI] [PubMed] [Google Scholar]
- Feeney MP, Grant IL, Marryott LP. Wideband energy reflectance measurements in adults with middle-ear disorders. Journal of Speech, Language, and Hearing Research. 2003;46:901–911. doi: 10.1044/1092-4388(2003/070). [DOI] [PubMed] [Google Scholar]
- Feeney MP, Grant IL, Mills DM. Wideband energy reflectance measurements of ossicular chain discontinuity and repair in human temporal bone. Ear Hear. 2009;30:391–400. doi: 10.1097/AUD.0b013e3181a283ed. [DOI] [PubMed] [Google Scholar]
- Feeney MP, Keefe DH. Acoustic reflex detection using wideband acoustic reflectance, admittance, and power measurements. Journal of Speech, Language, and Hearing Research. 1999;42:1029–1041. doi: 10.1044/jslhr.4205.1029. [DOI] [PubMed] [Google Scholar]
- Feeney MP, Keefe DH. Estimating the acoustic reflex threshold from wideband measures of reflectance, admittance, and power. Ear Hear. 2001;22:316–332. doi: 10.1097/00003446-200108000-00006. [DOI] [PubMed] [Google Scholar]
- Feeney MP, Keefe DH, Sanford CA. Wideband reflectance measures of the ipsilateral acoustic stapedius reflex threshold. Ear Hear. 2004;25:421–430. doi: 10.1097/01.aud.0000145110.60657.73. [DOI] [PubMed] [Google Scholar]
- Feeney MP, Sanford CA. Age effects in the human middle ear: Wideband acoustical measures. J. Acoust. Soc. Am. 2004;116:3546. doi: 10.1121/1.1808221. 3558. [DOI] [PubMed] [Google Scholar]
- Feeney MP, Sanford CA. Detection of the acoustic stapedius reflex in infants using wideband energy reflectance and admittance. J Am Acad Audiol. 2005;16:278–290. doi: 10.3766/jaaa.16.5.3. [DOI] [PubMed] [Google Scholar]
- Gan R, Dai C, Wood M. Laser interferometry measurements of middle ear fluid and pressure effects on sound transmission. J. Acoust. Soc. Am. 2006;120:3799–3810. doi: 10.1121/1.2372454. [DOI] [PubMed] [Google Scholar]
- Huang GT, Rosowski JJ, Puria S, Peake WT. A noninvasive method for estimating acoustic admittance at the tympanic membrane. J. Acoust. Soc. Am. 2000;108:1128–1146. doi: 10.1121/1.1287024. [DOI] [PubMed] [Google Scholar]
- Hunter LL, Feeney MP, Miller JAL, Jeng PS, Bohning S. Wideband refletance in newborns: Normative regions and relationship to hearing-screening results. Ear Hear. 2010;31:599–610. doi: 10.1097/AUD.0b013e3181e40ca7. [DOI] [PMC free article] [PubMed] [Google Scholar]
- Hunter LL, Tubaugh L, Jackson A, Propes S. Wideband middle ear power measurements in infants and children. J Am Acad Audiol. 2008;19:309–324. doi: 10.3766/jaaa.19.4.4. [DOI] [PubMed] [Google Scholar]
- Keefe DH, Bulen JC, Arehart KH, Burns EM. Ear-canal impedance and reflection coefficient in human infants and adults. J. Acoust. Soc. Am. 1993;94(5):2617–2638. doi: 10.1121/1.407347. [DOI] [PubMed] [Google Scholar]
- Keefe DH, Folsom RC, Gorga MP, Vohr BR, Bulen JC, Norton S. Identification of neonatal hearing impairment: Ear-canal measurements of acoustic admittance and reflectance in neonates. Ear Hear. 2000;21:443–461. doi: 10.1097/00003446-200010000-00009. [DOI] [PubMed] [Google Scholar]
- Keefe DH, Gorga MP, Neely ST, Zhao F, Vohr BR. Ear-canal acoustic admittance and reflectance measurements in human neonates. II. Predictions of middle-ear dysfunction and sensorineural hearing loss. J. Acoust. Soc. Am. 2003a;113:407–422. doi: 10.1121/1.1523388. [DOI] [PubMed] [Google Scholar]
- Keefe DH, Levi EC. Maturation of the middle and external ears: Acoustic power-based responses and reflectance tympanometry. Ear Hear. 1996;17:361–373. doi: 10.1097/00003446-199610000-00002. [DOI] [PubMed] [Google Scholar]
- Keefe DH, Ling R, Bulen JC. Method to measure acoustic impedance and reflection coefficient. J. Acoust. Soc. Am. 1992;91(1):470–485. doi: 10.1121/1.402733. [DOI] [PubMed] [Google Scholar]
- Keefe DH, Simmons JL. Energy transmittance predicts conductive hearing loss in older children and adults. J. Acoust. Soc. Am. 2003;114:3217–3238. doi: 10.1121/1.1625931. [DOI] [PubMed] [Google Scholar]
- Keefe DH, Zhao F, Neely ST, Gorga MP, Vohr BR. Ear-canal acoustic admittance and reflectance effects in human neonates. I. Predictions of otoacoustic emission and auditory brainstem responses. J. Acoust. Soc. Am. 2003b;113:389–406. doi: 10.1121/1.1523387. [DOI] [PubMed] [Google Scholar]
- Kringlebotn M. Network model for the human middle ear. Scand. Audiol. 1988;17:75–85. doi: 10.3109/01050398809070695. [DOI] [PubMed] [Google Scholar]
- Lynch TJ, Nedzelnitsky V, Peake WT. Input impedance of the cochlea in cat. J. Acoust. Soc. Am. 1982;72(1):108–130. doi: 10.1121/1.387995. [DOI] [PubMed] [Google Scholar]
- Margolis R, Smith P. Tympanometric asymmetry. J. Speech and Hearing Research. 1977;20:437–446. doi: 10.1044/jshr.2003.437. [DOI] [PubMed] [Google Scholar]
- Margolis RH, Saly GL, Keefe DH. Wideband reflectance tympanometry in normal adults. J. Acoust. Soc. Am. 1999;106:265–280. doi: 10.1121/1.427055. [DOI] [PubMed] [Google Scholar]
- Merchant GR, Voss SE, Horton NJ. Normative reflectance and transmittance measurements on healthy newborn and one-month old infants. Ear and Hearing. 2010 doi: 10.1097/AUD.0b013e3181e68e68. In Press. [DOI] [PubMed] [Google Scholar]
- Merchant SN, Ravicz ME, Rosowski JJ. Acoustic input impedance of the stapes and cochlea in human temporal bones. Hear. Res. 1996;97:30–45. [PubMed] [Google Scholar]
- Molvaer O, Vallersnes F, Kringlebotn M. The size of the middle ear and the mastoid air cell. Acta Oto-Laryng. 1978;85:24–32. doi: 10.3109/00016487809121419. [DOI] [PubMed] [Google Scholar]
- Murakami S, Gyo K, Goode RL. Effect of middle ear pressure change on middle ear mechanics. Acta Oto-Laryng. 1997;117:390–395. doi: 10.3109/00016489709113411. [DOI] [PubMed] [Google Scholar]
- Murakami S, Gyo K, Goode RL. Effect of increased inner ear pressure on middle ear mechanics. Otolaryngol Head Neck Surg. 1998;118:703–708. doi: 10.1177/019459989811800528. [DOI] [PubMed] [Google Scholar]
- Piskorski P, Keefe DH, Simmons JL, Gorga MP. Prediction of conductive hearing loss based on acoustic ear-canal response using a multi-variate clinical decision theory. J. Acoust. Soc. Am. 1999;105:1749–1764. doi: 10.1121/1.426713. [DOI] [PubMed] [Google Scholar]
- Ravicz M, Rosowski J, Merchant S. Mechanisms of hearing loss resulting from middle-ear fluid. Hear. Res. 2004;195:103–130. doi: 10.1016/j.heares.2004.05.010. [DOI] [PubMed] [Google Scholar]
- Sanford C, Feeney M. Effects of maturation on tympanometric wideband acoustic transfer functions in human infants. J. Acoust. Soc. Am. 2008;124:21062122. doi: 10.1121/1.2967864. [DOI] [PMC free article] [PubMed] [Google Scholar]
- Sanford C, KEefe DH, Liu YW, McCreery RW, Lewis DE, Gorga MP. Sound-conduction effects on distortion-product otoacoustic emission screening outcomes in newborn infants: Test performance of wideband acoustic transfer functions and 1-khz tympanometry. Ear Hear. 2009;30:635–652. doi: 10.1097/AUD.0b013e3181b61cdc. [DOI] [PMC free article] [PubMed] [Google Scholar]
- Shahnaz N. Wideband reflectance in neonatal intensive care units. J Am Acad Audiol. 2008;19:419429. doi: 10.3766/jaaa.19.5.4. [DOI] [PubMed] [Google Scholar]
- Shahnaz N, Bork K. Wideband reflectance norms for caucasian and Chinese young adults. Ear Hear. 2006:774–788. doi: 10.1097/01.aud.0000240568.00816.4a. [DOI] [PubMed] [Google Scholar]
- Shahnaz N, Bork K, Polka L, Longridge N, Bell D, Westerberg D. Energy reflectance and tympanometry in normal and otosclerotic ears. Ear Hear. 2009;30:219–233. doi: 10.1097/AUD.0b013e3181976a14. [DOI] [PubMed] [Google Scholar]
- Stepp CE, Voss SE. Acoustics of the human middle-ear air space. J. Acoust. Soc. Am. 2005;118:861–871. doi: 10.1121/1.1974730. [DOI] [PubMed] [Google Scholar]
- Stinson MR. Revision of estimates of acoustic energy reflectance at the human eardrum. J. Acoust. Soc. Am. 1990;88(4):1773–1778. doi: 10.1121/1.400198. [DOI] [PubMed] [Google Scholar]
- Sun X-M. Ear-canal pressure variations versus negative middle-ear pressure: Comparison using distortion product otoacoustic emission measurement in humans. 2011 doi: 10.1097/AUD.0b013e3182280326. Forthcoming. [DOI] [PubMed] [Google Scholar]
- Voss S, Horton N, Woodbury R, Sheffield K. Sources of variability in reflectance measurements on normal cadaver ears. Ear Hear. 2008a;29:651–655. doi: 10.1097/AUD.0b013e318174f07c. [DOI] [PubMed] [Google Scholar]
- Voss SE, Allen JB. Measurement of acoustic impedance and reflectance in the human ear canal. J. Acoust. Soc. Am. 1994;95:372–384. doi: 10.1121/1.408329. [DOI] [PubMed] [Google Scholar]
- Voss SE, Merchant GR, Horton NJ. Effects of middle-ear pathologies on energy reflectance measurements; Abstracts of the American Auditory Society Annual Meeting; 2008b. p. 33. [Google Scholar]
- Voss SE, Merchant GR, Horton NJ. Effects of middle-ear disorders on ear-canal reflectance measures in human cadaver ears. 2010:1867. doi: 10.1097/AUD.0b013e31823235b5. Abstracts of the Acoustical Society of America Vol 127; No. 3, Pt. 2 of 2 (3aEA2) [DOI] [PMC free article] [PubMed] [Google Scholar]
- Voss SE, Rosowski JJ, Merchant SN, Peake WT. Acoustic responses of the human middle ear. Hear. Res. 2000;150:43–69. doi: 10.1016/s0378-5955(00)00177-5. [DOI] [PubMed] [Google Scholar]
- Voss SE, Rosowski JJ, Merchant SN, Peake WT. Middle-ear function with tympanic-membrane perforations. I. Measurements and mechanisms. J. Acoust. Soc. Am. 2001a;110:1432–1444. doi: 10.1121/1.1394195. [DOI] [PubMed] [Google Scholar]
- Voss SE, Rosowski JJ, Merchant SN, Peake WT. Middle-ear function with tympanic-membrane perforations. II. A simple model. J. Acoust. Soc. Am. 2001b;110:1445–1452. doi: 10.1121/1.1394196. [DOI] [PubMed] [Google Scholar]
- Werner LA, Levi EC, Keefe DH. Ear-canal wideband acoustic transfer functions of adults and two- to nine-month-old infants. Ear Hear. 2010;31:587–598. doi: 10.1097/AUD.0b013e3181e0381d. [DOI] [PMC free article] [PubMed] [Google Scholar]


