

Abstract
The novel polysaccharide (NPS) PolyGlycopleX (PGX) has been shown to reduce glycemia. Pharmacological treatment with sitagliptin, a dipeptidyl peptidase 4 (DPP4) inhibitor, also reduces glycemia by increasing glucagon-like peptide-1 (GLP-1). Our objective was to determine if using NPS in combination with sitagliptin reduces hyperglycemia in Zucker diabetic fatty (ZDF) rats more so than either treatment alone. Male ZDF rats were randomized to: 1) cellulose/vehicle [control (C)]; 2) NPS (5% wt:wt)/vehicle (NPS); 3) cellulose/sitagliptin [10 mg/(kg · d) (S)]; or 4) NPS (5%) + S [10 mg/(kg · d) (NPS+S)]. Glucose tolerance, adiposity, satiety hormones, and mechanisms related to DPP4 activity and hepatic and pancreatic histology were examined. A clinically relevant reduction in hyperglycemia occurred in the rats treated with NPS+S (P = 0.001) compared with NPS and S alone. Blood glucose, measured weekly in fed and feed-deprived rats and during an oral glucose tolerance test, was lower in the NPS+S group compared with all other groups (all P = 0.001). At wk 6, glycated hemoglobin was lower in the NPS+S group than in the C and S (P = 0.001) and NPS (P = 0.06) groups. PGX (P = 0.001) and S (P = 0.014) contributed to increased lean mass. Active GLP-1 was increased by S (P = 0.001) and GIP was increased by NPS (P = 0.001). Plasma DPP4 activity was lower in the NPS+S and S groups than in the NPS and C groups (P = 0.007). Insulin secretion and β-cell mass was increased with NPS (P < 0.05). NPS alone reduced LDL cholesterol and hepatic steatosis (P < 0.01). Independently, NPS and S improve several metabolic outcomes in ZDF rats, but combined, their ability to markedly reduce glycemia suggests they may be a promising dietary/pharmacological co-therapy for type 2 diabetes management.
Introduction
The health and economic toll of obesity continues to rise, seemingly unabated, worldwide (1). There are currently an estimated 1.5 billion overweight and obese individuals globally (2). The NIH has recommended that combined lifestyle and pharmacological therapy be used for all obese individuals or overweight individuals with at least one co-morbidity (3). There are currently a limited number of dietary and pharmacological co-therapies that have been sufficiently evaluated to move this recommendation forward.
Sitagliptin (S)11 is an oral antidiabetic medication that blocks dipeptidyl peptidase 4 (DPP4), the enzyme responsible for the rapid degradation of active glucagon-like peptide-1 (GLP-1) (4). In addition to exerting potent insulinotropic activity, GLP-1 also reduces food intake, suppresses glucagon secretion, slows gastric emptying, and stimulates β-cell regeneration (5). DPP4 inhibitors are orally active and can inhibit >90% of plasma DPP4 activity over a 24-h period (6). Inhibition of DPP4 improves insulin sensitivity and results in reduced blood glucose concentrations (7,8). S specifically has been approved by the FDA, Health Canada, and the European Commission as a single therapy for the treatment of diabetes and it can be effectively combined with metformin or glitazone (9,10).
Dietary fibers have numerous health benefits, including lowering plasma cholesterol levels, reducing hyperglycemia, enhancing the secretion of satiety hormones, and improving bowel function (11). Some dietary fibers enhance the secretion of GLP-1 and another anorexigenic gut hormone, peptide YY (PYY) (12–16). We have previously shown that the highly viscous functional fiber, PolyGlycopleX (PGX) (α-D-glucurono-α-D-manno-β-D-manno-β-D-gluco α-L-gulurono-β-D mannurono, β-D-gluco-β-D-mannan; InovoBiologic) novel polysaccharide (NPS) reduces hyperglycemia and increases GLP-1 secretion in obese Zucker diabetic fatty (ZDF) rats (17). We have also demonstrated that NPS increases the anorexigenic hormone PYY in healthy humans (18) and it decreases hunger and promotes satiety in obese humans undergoing a low-energy diet regime (19). Whether or not combining the glycemia-lowering actions of NPS with the known GLP-1–protective and hypoglycemic actions of sitagliptin improves glucose tolerance in rats is not known.
Our objective was to determine the effects of the combined treatment of NPS with S on glucose tolerance in obese ZDF rats. Secondary outcomes were measured to gain insight into the mechanisms of NPS and S actions and included body composition, satiety hormone secretion, pancreatic islet and liver histology, and DPP4 activity.
Methods
Rats and treatments
Ethical approval for the experimental protocol was granted by the Eurofins Institutional Animal Use and Care Committee and all procedures conformed to the Guide for Care and Use of Laboratory Animals. Forty-four male ZDF/Crl-Leprfa/fa rats (ZDF) were obtained from Charles River at 9 wk of age and individually housed in a temperature- (18–22°C) and humidity-controlled (44–68%) room with a 12-h-light/-dark cycle. Water and feed were provided ad libitum. Male ZDF rats were selected as representing a good model of obesity with comorbid type 2 diabetes and reduced insulin sensitivity (20,21). Following 4 d of acclimation, rats were randomly assigned to 1 of 4 groups: 1) control [cellulose fiber/vehicle (C)]; 2) NPS [5% wt : wt/vehicle (NPS)]; 3) cellulose/S [10 mg/(kg · d) via oral gavage (S)]; or 4) NPS (5%) + S [10 mg/(kg · d) (NPS+S)]. There were n = 11 rats/group. The NPS was PGX (InovoBiologic). NPS was shipped to Research Diets for incorporation into a high-fat rodent diet (D12451) at 5% wt : wt (Supplemental Table 1). Cellulose was selected as the insoluble reference fiber that is considered to be inert (22). S phosphate monohydrate (JANUVIA, Merck and Co) was obtained by prescription at a pharmacy in Dayton, NJ and prepared in water and given daily by gavage (10 mg/kg) in the morning.
Continuous study measures
Body weight was measured once each week. Food intake, accounting for spillage, was measured 3 times/wk. Blood glucose was measured weekly using a Bayer Ascensia Elite Glucometer (Bayer Health Care). The blood was collected via tail nick following S administration: one sample when food was present for the previous 24 h and one sample was collected on another day when food was not available overnight (16 h feed deprived).
Oral glucose tolerance tests
Three days before the end of the study and following 16 h of feed deprivation, a baseline blood sample was collected. S was administered prior to the baseline blood draw. A 1-g/kg dose of glucose was given via oral gavage and subsequent blood samples collected via tail nick at 10, 20, 30, 60, and 120 min. Blood glucose concentrations were immediately determined with a glucometer. A second and separate oral glucose tolerance test (OGTT) was performed for satiety hormone analysis on the final day of the study. Following overnight feed deprivation and morning S administration, a baseline blood sample was collected. Glucose (2 g/kg) was given via gavage and subsequent blood samples taken at 15, 30, 60, and 90 min via tail nick. Blood was collected with the addition of diprotinin-A (0.034 g/L blood; MP Biomedicals), Sigma protease inhibitor (1 g/L blood; Sigma Aldrich), and Roche Pefabloc (1 g/L of blood; Roche). Plasma was stored at −80°C until later analysis. To assess the increment in insulin secretion triggered by an increment in plasma glucose (termed the insulinogenic index), we calculated insulin response for the early and total secretory phases as follows: the ratio of insulin AUC:glucose AUC from 0 to 15 min of the OGTT (InsAUC15 : GluAUC20) (correlates with early-phase insulin release during the OGTT) and the ratio of insulin AUC : glucose AUC from 0 to 120 min of the OGTT (InsAUC120 : GluAUC120) (correlates with second-phase and total insulin release during the OGTT). In a human validation study (23), InsAUC30 : GluAUC30 was highly correlated with first-phase insulin secretion. In rodents, however, peak insulin secretion occurs between 10 and 20 min (24) and insulin secretion at 15 min was therefore used for calculations. The composite insulin sensitivity index (CISI), which takes into account glucose excursion and AUC, was also calculated as previously described (17). Higher scores represent improved insulin sensitivity.
Lipid determination, plasma DPP4 activity, and clinical chemistry
At the termination of the study, a blood sample was collected via retro-orbital bleed under isoflurane anesthesia. Serum was analyzed for lipid concentrations (total, LDL, HDL cholesterol, and TG) using an analyzer (Polymer Technology Systems CardioChek). DPP4 activity in plasma was measured according to Kirino et al. (25). A clinical chemistry panel was analyzed in plasma, including blood urea nitrogen, glucose, electrolytes, creatinine, alkaline phosphatase, aspartate aminotransfer-ase, alanine aminotransferase (AST), and bilirubin (direct + indirect).
Tissue collection and necropsy
At the termination of the study, following overnight feed deprivation and regular S treatment in the morning, rats were overanesthetized with isoflurane and a blood sample was collected via cardiac puncture. A section of the distal ileum, one kidney, and one liver lobe were snap-frozen for later DPP4 mRNA analysis. The pancreas and one liver lobe were fixed in 10% neutral buffered formalin for later processing. One liver lobe was snap-frozen for determination of lipid content with Sudan Black staining. The pancreas was transferred to 70% ethanol after 24 h. Tissues were processed and embedded in paraffin. The liver was sectioned (5 μm) and stained with hematoxylin and eosin or immunohistochemically stained with a mouse antibody against rat insulin (1:300, Cell Signaling Technology) according to previous work (26). The histopathology scoring was: 0, within normal limits; 1, minimal; 2, mild; 3, moderate; 4, marked; and 5, severe.
Biochemical analysis
A Rat Gut Hormone Multiplex kit (Millipore) was used to measure insulin, active GLP-1, active amylin, active ghrelin, leptin, total PYY, and total GIP according to our previous work (27,28). Glycated hemoglobin (HbA1c) was measured in blood using a clinical analyzer (Bayer DCA 2000).
Statistical analysis
All data are presented as mean ± SEM. A 2-way ANOVA was used to determine the main effects of diet (NPS vs. cellulose) and drug (S vs. vehicle) and their interaction. When a significant interaction effect was identified, a 1-way ANOVA with Tukey’s multiple comparison post hoc test was used to identify differences between groups. For parameters where repeated measurements were taken over time (i.e., body weight, glucose, HbA1c, and satiety hormones), a 2-way repeated-measure ANOVA was performed with between-subject factor (treatment of 4 levels) and within-subject factor (time). Noninterval data (e.g., histology scores) were analyzed by Kruskal Wallis test and Dunn’s multiple comparison test. Significance was set at P < 0.05.
Results
NPS and S effects on food intake and body weight
Both NPS (P = 0.001) and S (P = 0.001) contributed to changes in food intake (Table 1). Rats fed NPS had 20% lower food intake than those fed cellulose and rats given S had 11% lower food intake than vehicle. Body weight increased with time (P = 0.001) (Supplemental Fig. 1). Diet affected final body weight (P = 0.027) and weight gain (P = 0.011), with rats fed NPS having greater overall weight gain and higher final body weight (Table 1). Lean mass was influenced by NPS (P = 0.001) and S (P = 0.014), with greater lean mass in rats treated with NPS compared with those treated with cellulose and in rats treated with S compared with vehicle. Fat mass (expressed as grams or percentage of body fat) and bone mineral density did not significantly differ between groups.
TABLE 1.
Energy intake and body composition of obese ZDF rats treated with NPS, S, both, or neither for 6 wk1
| Treatment | C | NPS | S | NPS+S | Two-way ANOVA P values
|
||
|---|---|---|---|---|---|---|---|
| Diet | Drug | Diet × drug | |||||
| Food intake, g/d | 26 ± 0.5 | 20 ± 0.6 | 23 ± 0.7 | 18 ± 0.5 | 0.001 | 0.001 | 0.23 |
| Final body weight, g | 405 ± 17.4 | 431 ± 9.60 | 411 ± 16.1 | 441 ± 5.32 | 0.027 | 0.52 | 0.88 |
| Total weight change, g | 106 ± 13.8 | 128 ± 7.10 | 111 ± 12.5 | 139 ± 4.21 | 0.011 | 0.36 | 0.78 |
| Fat mass, g | 218 ± 13.3 | 228 ± 9.1 | 213 ± 9.81 | 224 ± 7.83 | 0.29 | 0.67 | 0.97 |
| Lean mass, g | 113 ± 3.5 | 130 ± 3.84 | 123 ± 5.40 | 142 ± 4.02 | 0.001 | 0.014 | 0.92 |
| Percent fat, % | 53.5 ± 1.14 | 52.7 ± 1.28 | 51.8 ± 0.92 | 50.8 ± 1.39 | 0.48 | 0.15 | 0.94 |
| Bone mineral density, g/cm3 | 0.167 ± 0.001 | 0.168 ± 0.002 | 0.169 ± 0.003 | 0.169 ± 0.003 | 0.83 | 0.54 | 0.70 |
Values are means ± SEM, n = 8–11.
C, control; NPS, novel polysaccharide; NPS+S; novel polysaccharide and sitagliptin; S, sitagliptin; ZDF, Zucker diabetic fatty.
Glycemic response
Both time (P = 0.001) and treatment (P = 0.001) and their interaction (P = 0.001) affected blood glucose concentrations measured weekly in feed-deprived rats (Fig. 1A). Rats treated with NPS+S had lower blood glucose than all other groups at 6 wk (P < 0.01) [lower than C and S at 3, 4, and 5 wk (P < 0.02) and lower than C at every week after baseline (P < 0.003)]. Given that NPS is highly viscous and affects intestinal glucose absorption when present in the lumen, we also measured blood glucose concentrations in fed rats once each week. Both time (P = 0.001) and treatment (P = 0.001) and their interaction (P = 0.001) affected blood glucose concentrations in the fed state (Fig. 1B). At 4, 5, and 6 wk, the NPS+S rats had lower blood glucose than all other groups (P < 0.002). From 2 wk onwards, rats treated with NPS+S had lower blood glucose than the C and S rats (P = 0.01). Similarly, there was an effect of time (P = 0.001) and treatment (P = 0.001) and their interaction (P = 0.001) for repeated HbA1c measurements (Fig. 1C). At 3 wk, the NPS+S rats had lower HbA1c than C rats (P = 0.01) and at 6 wk, the NPS+S group was lower than C and S groups (P = 0.001) and showed a trend to be lower than the NPS group (P = 0.06).
FIGURE 1.

HbA1c (C) and blood glucose concentrations in feed-deprived (A) and fed (B) obese ZDF rats treated with NPS, S, both, or neither for 6 wk. Values are mean ± SEM, n = 8–11. Labeled means at a time without a common letter differ, P < 0.05. C, control; HbA1c, glycated hemoglobin; NPS, novel polysaccharide; NPS+S; novel polysaccharide and sitagliptin; S, sitagliptin; ZDF, Zucker diabetic fatty.
Interactive effects on glucose and satiety hormones during OGTT
There was an effect of time (P < 0.01) for all satiety hormones at the final OGTT except ghrelin (Fig. 2). Treatment influenced insulin secretion (P = 0.038) such that the NPS group was higher than the C group (P = 0.049) (Fig. 2A). Treatment (P = 0.001) and its interaction with time (P = 0.001) affected GIP during the OGTT (Fig. 2B). At 15, 30, and 60 min, the NPS group had higher GIP than all other groups (P < 0.04). At 15 min, the S (P = 0.046) and NPS+S (P = 0.04) rats had higher active GLP-1 compared with C rats (Fig. 2C). At 30 min, the S group had higher GLP-1 than the C (P = 0.003) and NPS (P = 0.04) groups. Leptin was affected by time (P = 0.01) but not the treatments (P = 0.14) (Fig. 2D). NPS increased 0, 15, and 30 min amylin concentrations during the OGTT compared with C (P < 0.038) (Fig. 2E). The NPS+S rats also had higher amylin at 15, 30, and 60 min compared with the C and S groups (P < 0.05). Blood glucose was also measured following an oral glucose load 3 d before the end of the study (Fig. 2F). Time (P = 0.001), treatment (P = 0.001), and their interaction (P = 0.001) affected glucose, with a marked reduction occurring in the NPS+S group compared with all other groups throughout the 120-min OGTT. There was an effect of time (P = 0.001) for PYY and no significant differences in ghrelin (data not shown).
FIGURE 2.

Plasma insulin (A), GIP (B), GLP-1 (C), leptin (D), amylin (E), and blood glucose (F) of obese ZDF rats during an OGTT. Values are mean ± SEM, n = 8–11. Labeled means at a time without a common letter differ, P < 0.05. C, control; GIP, glucose-dependent insulinotropic polypeptide; GLP-1, glucagon-like peptide 1; NPS, novel polysaccharide; NPS+S; novel polysaccharide and sitagliptin; OGTT, oral glucose tolerance test; S, sitagliptin; ZDF, Zucker diabetic fatty.
The AUC during the OGTT was calculated for all satiety hormones and glucose. The AUC for insulin increased with NPS compared with cellulose (P = 0.009) (Table 2). Both diet (P = 0.003) and drug (P = 0.001) and their interaction affected the GIP AUC, with the NPS group having higher AUC than all other groups (P < 0.002). Active GLP-1 increased with S compared with vehicle (P = 0.001). Amylin, co-secreted with insulin, was affected by NPS (P = 0.001) and S (P = 0.039) such that NPS and S independently increased the AUC. The glucose AUC was reduced with NPS (P = 0.009) and S (P = 0.003). Despite a 50% reduction in glucose AUC in NPS+S compared with C and an ~32% reduction in AUC compared with NPS and S alone, the interaction between NPS and S was not significant (P = 0.7), although probably physiologically relevant.
TABLE 2.
Plasma AUC for glucose and satiety hormones of obese ZDF rats treated with NPS, S, both, or neither for 6 wk1
| C | NPS | S | NPS+S | Two-way ANOVA P values
|
|||
|---|---|---|---|---|---|---|---|
| Diet | Drug | Diet × drug | |||||
| Insulin, pmol/L × 90 min | 66.5 ± 12.7 | 184 ± 26.5 | 136 ± 34.3 | 178 ± 31.4 | 0.009 | 0.28 | 0.20 |
| GIP, pmol/L × 90 min | 2.9 ± 0.4a | 4.6 ± 0.1b | 2.5 ± 0.2a | 2.7 ± 0.2a | 0.003 | 0.001 | 0.012 |
| GLP-1, pmol/L × 90 min | 3.0 ± 0.2 | 3.6 ± 0.3 | 5.1 ± 0.6 | 4.6 ± 0.5 | 0.92 | 0.001 | 0.20 |
| PYY, pmol/L × 90 min | 2.2 ± 0.2 | 1.9 ± 0.2 | 2.3 ± 0.3 | 2.2 ± 0.2 | 0.29 | 0.300 | 0.64 |
| Ghrelin, pmol/L × 90 min | 1.8 ± 0.7 | 2.3 ± 0.5 | 1.7 ± 0.3 | 2.2 ± 0.4 | 0.28 | 0.80 | 0.96 |
| Leptin, pmol/L × 90 min | 158 ± 13.9 | 142 ± 13.3 | 149 ± 9.53 | 123 ± 8.12 | 0.07 | 0.23 | 0.63 |
| Amylin, pmol/L × 90 min | 2.9 ± 0.4 | 6.5 ± 0.7 | 4.9 ± 0.6 | 8.0 ± 1.0 | 0.001 | 0.039 | 0.71 |
| Glucose, mmol/L × 90 min | 723 ± 81.6 | 525 ± 57.2 | 500 ± 59.2 | 345 ± 59.1 | 0.009 | 0.003 | 0.73 |
| InsAUC15:GluAUC20, pmol/mmol | 154 ± 28.4 | 675 ± 123 | 330 ± 109 | 782 ± 180 | 0.001 | 0.30 | 0.80 |
| InsAUC120:GluAUC120, pmol/mmol | 127 ± 24.8 | 652 ± 129 | 294 ± 99.9 | 875 ± 175 | 0.001 | 0.15 | 0.84 |
| CISI, score | 0.64 ± 0.13 | 0.43 ± 0.06 | 0.55 ± 0.15 | 0.79 ± 0.13 | 0.95 | 0.28 | 0.07 |
Values are means ± SEM, n = 9–10.
Labeled means without a common letter differ, P < 0.05. C, control; CISI, composite insulin sensitivity index; GIP, glucose-dependent insulinotropic polypeptide; GLP-1, glucagon-like peptide 1; InsAUC15:GluAUC20, ratio of insulin AUC:glucose AUC from 0 to 15 min of the oral glucose tolerance test; InsAUC120:GluAUC120, ratio of insulin AUC:glucose AUC from 0 to 120 min of the oral glucose tolerance test; NPS, novel polysaccharide; NPS+S; novel polysaccharide and sitagliptin; PYY, peptide tyrosine tyrosine; S, sitagliptin; ZDF, Zucker diabetic fatty.
Surrogate indexes of first-phase and total insulin secretion and insulin sensitivity
Given that the β-cell responds to increments in plasma glucose concentration with an increment in plasma insulin secretion (29), we calculated the insulin response for both the early (0–15 min) and total secretory phases (0–120 min). Both the InsAUC15 : GluAUC20 and InsAUC120 : GluAUC120 ratios were increased by NPS (P = 0.001) but not S (P = 0.3) or their interaction (P = 0.9) (Table 2). The CISI scores did not significantly differ among the groups (Table 2).
Changes in DPP4 activity
DPP4 activity in the plasma was affected by NPS (P = 0.001), S (P = 0.001), and their interaction (P = 0.007) (Fig. 3). C had higher plasma DPP4 activity than all other groups (P = 0.001). In the liver, DPP4 activity was reduced by S compared with vehicle (P = 0.001) and there was no further decrease in combination with NPS.
FIGURE 3.
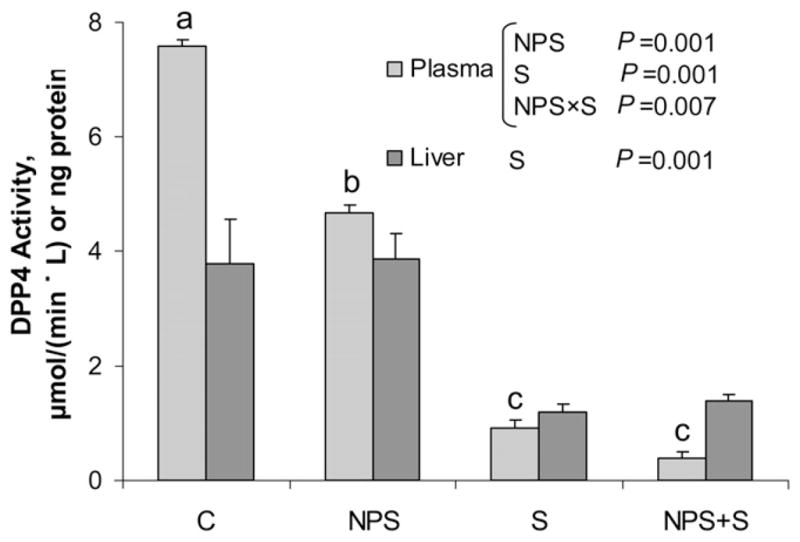
Plasma and liver DPP4 activity in obese ZDF rats treated with NPS, S, both, or neither for 6 wk. Values are mean ± SEM, n = 8–11. Labeled means without a common letter differ, P < 0.05. C, control; DPP4, dipeptidyl peptidase 4; NPS, novel polysaccharide; NPS+S; novel polysaccharide and sitagliptin; S, sitagliptin; ZDF, Zucker diabetic fatty.
Pancreatic immunohistochemistry
Pancreatic β-cell mass (Fig. 4) was altered by diet (P = 0.001). The insulin-immunoreactive area was greater with NPS (50 ± 1.9%) compared with cellulose (39 ± 2.1%). Pancreatic islet fibrosis, scored on a scale of 0 (pathology absent) to 5 (severe pathology), was reduced (P = 0.001) with NPS (1.4 ± 0.1) compared with cellulose (2.1 ± 0.1). The interaction between NPS and S was significant for islet hypertrophy (P = 0.003), wherein NPS alone had greater islet hypertrophy (3.9 ± 0.2 score) compared with NPS+S (3.1 ± 0.3 score) (P = 0.055). Islet degeneration was lower (P = 0.001) with NPS (0.96 ± 0.09 score) compared with cellulose (1.54 ± 0.11 score). Deposits of hemosiderin or mononuclear cell infiltrate did not differ between groups.
FIGURE 4.
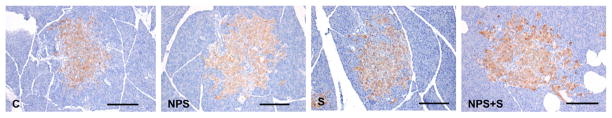
Photomicrographs of pancreas of obese ZDF rats treated with NPS, S, both, or neither for 6 wk. The bars are 200 μm. The brown-stained tissue is positive for insulin-containing cells within the pancreas. Photographs were selected as representative of the respective treatments. C, control; NPS, novel polysaccharide; NPS+S; novel polysaccharide and sitagliptin; S, sitagliptin; ZDF, Zucker diabetic fatty.
Changes in serum lipids and hepatic biomarkers
Total cholesterol was affected by diet (P = 0.001) such that rats consuming NPS had lower cholesterol than those consuming cellulose (Table 3). LDL concentrations were influenced by NPS (P = 0.001) and S (P = 0.01), wherein both NPS and S independently reduced LDL cholesterol. Concentrations of serum TG were above the detection limit of the assay for all groups except NPS+S, even following dilution, and are therefore not reliable. In the liver, hepatic steatosis was evaluated with Sudan Black staining (Table 3). There was an effect of diet for steatosis (P = 0.013), wherein rats fed NPS had lower scores than those fed cellulose. Microvesicular vacuolation scores were influenced by NPS (P = 0.033) and S (P = 0.036), with lower pathology scores independently seen for NPS and S. Serum aspartate aminotransferase concentrations were lower with NPS compared with cellulose (P = 0.001). The interaction between NPS and S (P = 0.048) affected serum AST concentrations, with C rats having higher AST than NPS (P = 0.017) but not S or NPS+S.
TABLE 3.
Serum lipid concentrations and hepatic histology in obese ZDF rats treated with NPS, S, both, or neither for 6 wk1
| C | NPS | S | NPS+S | Two-way ANOVA P values
|
|||
|---|---|---|---|---|---|---|---|
| Diet | Drug | Diet × drug | |||||
| Total cholesterol, mmol/L | 5.8 ± 0.4 | 4.3 ± 0.2 | 5.8 ± 0.4 | 3.8 ± 0.2 | 0.001 | 0.37 | 0.39 |
| LDL cholesterol, mmol/L | 4.5 ± 0.3 | 2.9 ± 0.3 | 3.3 ± 0.3 | 2.1 ± 0.1 | 0.001 | 0.010 | 0.52 |
| HDL cholesterol, mmol/L | 2.0 ± 0.1 | 2.5 ± 0.1 | 2.0 ± 0.1 | 2.2 ± 0.1 | 0.18 | 0.54 | 0.51 |
| Sudan Black staining score | 3.1 ± 0.3 | 2.5 ± 0.2 | 2.8 ± 0.4 | 1.8 ± 0.2 | 0.013 | 0.08 | 0.52 |
| Macrovesicular vacuolation score | 0.88 ± 0.13 | 0.82 ± 0.12 | 0.89 ± 0.20 | 0.91 ± 0.09 | 0.90 | 0.71 | 0.78 |
| Microvesicular vacuolation score | 3.1 ± 0.3 | 2.5 ± 0.2 | 2.6 ± 0.4 | 1.8 ± 0.2 | 0.033 | 0.036 | 0.79 |
| Aspartate aminotransferase, IU/L | 102 ± 16.2 | 60.3 ± 4.92 | 79.4 ± 5.09 | 53.4 ± 2.08 | 0.001 | 0.06 | 0.31 |
| Alanine aminotransferace, IU/L | 83.8 ± 4.1a | 52.4 ± 2.33b | 60.4 ± 5.81ab | 57.1 ± 3.64ab | 0.016 | 0.18 | 0.048 |
Values are means ± SEM, n = 8–11.
Labeled means without a common letter differ, P < 0.05. C, control; NPS, novel polysaccharide; NPS+S; novel polysaccharide and sitagliptin; S, sitagliptin; ZDF, Zucker diabetic fatty.
Discussion
As the rates of obesity and type 2 diabetes continue to rise worldwide, there is growing pressure to identify effective treatments to manage these diseases (30). For a number of decades, increased intake of viscous dietary fiber has been recommended for the management of type 2 diabetes due to its ability to slow glucose absorption from the small intestine (31,32). More recently, the pharmacological agent S, which prevents the degradation of GLP-1 by inhibiting DPP4, has been shown to reduce peak glucose concentrations during an OGTT and lower HbA1c (33). Our objective was to determine if combining a dietary treatment with effective glucose-lowering action with a pharmacological agent, S, would further improve glucose control over either treatment alone. Although we con-firm that independent administration of NPS or S is effective at lowering food intake (both), increasing lean mass (both), reducing LDL cholesterol and hepatic steatosis (NPS), and increasing active GLP-1 (S), the combined actions of NPS and S on reducing glycemia more so than either treatment alone are significant and clinically relevant.
The chief finding of this study is the marked and significant reduction in blood glucose in ZDF rats with the combined treatment of NPS+S. We measured glucose control in 4 distinct ways, including weekly measures of blood glucose in the fed and fasted states, HbA1c, and an OGTT. All measures of glucose response showed the combined therapy to be highly effective in reducing glycemia. The interaction between NPS and S during weekly blood glucose measurements showed the combined therapy to be more effective than either treatment alone at reducing glucose, particularly fed blood glucose concentrations in the final 3 wk of the study and during an acute OGTT. The therapeutic potential of these findings is highlighted in work showing that the degree of hyperglycemia is directly associated with the incidence of microvascular and macrovascular complications (34). Reductions in fed blood glucose concentrations may be particularly relevant given the recent demonstration by Cavalot et al. (35) that cardiovascular events and all-cause mortality are predicted by postprandial blood glucose. The physical properties of NPS may make it especially effective at lowering postprandial glucose concentrations.
In ZDF rats, glucose intolerance usually develops by the age of 8 wk, followed by overt hyperglycemia by age 10–12 wk (36). If human criteria for postprandial hyperglycemia are used (>11.1 mmol/L), all of our rats would be considered diabetic at baseline (0 wk in Fig. 1B). Rats in the C and S groups remained diabetic throughout the study. The NPS rats had lower postprandial glycemia after 1 and 2 wk of treatment but remained diabetic from 3 to 6 wk inclusive. Rats in the NPS+S group, however, had normoglycemia for all intervention weeks except for the very last week. This may reflect diminished treatment effectiveness at this late time point or possibly a greater stress response to the increased number of tests performed in the final week. If we consider the human diabetes criteria for fasting hyperglycemia (>7.1 mmol/L), all of the rats were normoglycemic at baseline. All groups would be classified as diabetic thereafter except for the NPS+S group that had fasting glucose levels <7.1 mmol/L. These results suggest that NPS+S was able to attenuate diabetes in the ZDF rat.
NPS is a novel functional fiber that is highly viscous and has high water-holding and gel-forming properties (37). Other viscous soluble fibers have been shown to improve postprandial glycemia and insulin response via a slowing of gastric emptying and macronutrient absorption (32). It is likely, however, that other actions of NPS alone and in combination with S contributed to the improved glucose control in this study. Both NPS and S contributed to increased lean mass. Skeletal muscle is a major site for glucose disposal in the body (38). The reasons for the increase in lean mass with both NPS and S are likely distinct. The increase in lean mass with NPS or S was achieved in the context of reduced food intake and without significant changes to fat mass. Although we are not aware of any studies that lend insight into the effects of S on lean mass, the increase in overall body weight and lean mass in NPS-treated rats could be related to the increased GIP in these rats. Several lines of evidence suggest that GIP is a key link between overnutrition and obesity, including the finding that dietary fat stimulates GIP secretion and elevated GIP is observed in obesity (5). The recent work by Ugleholdt et al. (39) using GIP receptor (GIPr) expression targeted to white adipose tissue (WAT) or pancreatic β-cells is interesting in this regard. Mice with WAT-targeted GIPr expression had significantly greater weight gain in response to a high-fat diet, which was due to an increase in lean mass rather than fat mass (39). Whether or not the elevated circulating GIP levels observed in our NPS-treated rats are linked to increased lean mass via the GIPr in WAT is not known.
There are several other possible explanations for the seemingly disparate relationship between food intake and body weight gain. It is also possible that alterations in energy expenditure and/or physical activity related to NPS consumption could explain the increase in body weight, but this remains to be measured. Perhaps more likely is that by improving the diabetic state of the rats treated with NPS+S, there was reduced energy loss via the urine due to glucosuria. This is suggested by Sturis et al. (40), who also showed reduced food intake but increased body weight in ZDF rats after 42 d of treatment with the GLP-1 analogue, liraglutide. Similar to our NPS+S-treated rats, the liraglutide-treated rats had lower body weight during the first 10 d of treatment, but with increasing duration, body weight increased despite reduced food intake. Untreated control rats would lose energy via the urine, whereas treatment with liraglutide or NPS+S could potentially reduce this loss.
As expected, active GLP-1 was increased by S (41). This increase in active GLP-1 is the result of the DPP4 inhibitory actions of the drug (42). DPP4 is expressed on the surface of various types of cells, including the kidney, liver, small intestine, and in a soluble form in plasma (25). Whether or not DPP4 activity is correlated with the severity of diabetes is controversial, but Kirino et al. (25) showed that rats fed a high-fat or a high-sucrose diet had higher DPP4 activity in plasma compared with rats fed a control diet. In our study, both NPS and S reduced plasma DPP4 activity, although the effect of S was greater in magnitude than that of NPS. The 38% reduction in plasma DPP4 activity with NPS is nearly identical to the 37% decrease in DPP4 activity observed with the soluble, but low-viscosity fiber oligofructose (27), which leads us to speculate that fermentation end-products of dietary fibers, SCFA, may contribute to the inhibitory effects of soluble fibers to DPP4 activity. While the major action of S is known to be the inhibition of DPP4 activity, recent work by Sangle et al. (43) suggests that S may also exert direct effects on intestinal L cells and act as a GLP-1 secretagogue. In a previous study, we showed that NPS treatment also acted as a GLP-1 secretagogue in the absence of increased GLP-1–immunoreactive L-cell density (17).
Insulin secretion was increased with NPS but not S, a finding reflected in the increased β-cell mass seen with NPS but not S. The long-term presence of type 2 diabetes is characterized by a 40–60% reduction in β-cell mass (44). Early in the development of insulin resistance, β-cell compensation, involving the expansion of β-cell mass and insulin biosynthesis, allows blood glucose levels to remain in the normal range (45). In type 2 diabetes, the classical characteristic of hyperglycemia likely reflects an impaired ability for β-cell compensation (45). In our study, NPS was associated with increased β-cell mass, which may explain in part the improved glucose tolerance in these rats. Indeed, the surrogate indexes of first-phase and total insulin secretion (InsAUC:GluAUC at 0–15 and 0–120 min) were significantly higher with NPS, implicating an improved β-cell function and insulin secretion. Bi et al. (29) showed that InsAUC30:GluAUC30 and InsUC120:GluAUC120 were both reduced in participants with impaired fasting glucose and type 2 diabetes compared with participants with normal glucose tolerance. Given that insulin has been shown to act directly on β-cells in vitro in an autocrine fashion to promote β-cell growth (46), it is plausible that the increased insulin secretion observed in our NPS-treated rats exerted such an effect in vivo. β-Cell expansion is also promoted by GIP (45) and may therefore indicate a role for NPS-induced GIP secretion on increasing β-cell mass in our rats. The reason that S did not produce the same magnitude of insulin response as NPS may be due to the dosage used. We selected a dose of S that is on the low end of the range used in the literature (47–50) but still inhibited ~90% of plasma DDP4 activity 24 h after a single dose (51) in order that we might determine additive effects with NPS, which were identified in other parameters such as blood glucose. Recently, doses of S as high as 300 mg/kg have been examined in ZDF rats (52), which suggests that higher doses of S could be tested in combination with NPS.
Ideally, an insulin tolerance test would also have been performed in our rats to assess insulin sensitivity. We were, however, able to determine the CISI score from the OGTT data. We did not observe any difference in the CISI score among treatments, which is in agreement with our previous work in ZDF rats treated with NPS, inulin, or control for 12 wk (17) but contrasts to the higher CISI score seen in young ZDF rats treated for just 8 wk with the NPS compared with inulin and control (26). It is possible that NPS increased insulin sensitivity early on in the course of treatment and then dissipated, but this remains to be confirmed.
Similar to previous studies, NPS alone reduced total and LDL cholesterol (17,26). S was also associated with a significant reduction in LDL cholesterol. Several mechanisms have been proposed for the influence of soluble fiber on lipid profile, including interruption of enterohepatic bile acid circulation; alterations in volume, bulk, and viscosity of luminal contents; increases in cholesterol-7-α-hydroxylase; and production of SCFA from fermentation (32). Unfortunately, we could not obtain reliable data on serum TG, but it is interesting to note that only the samples from rats treated with NPS+S were low enough following dilution to not exceed the upper limit of the assay. Hepatic steatosis, as measured with Sudan Black staining, was also significantly reduced with NPS and supports the recent finding of reduced hepatic steatosis and serum TG seen in sucrose-fed Sprague-Dawley rats treated with NPS (53). In humans, S was associated with increased LDL cholesterol in patients with type 2 diabetes following 16 wk of treatment (54), which is in contrast to the decrease we observed in our ZDF rats.
Administered separately, dietary interventions and pharmacological treatments can improve metabolic disease and reduce associated health risks. However, as the rates of obesity and type 2 diabetes rise worldwide, there is a growing need to identify effective therapies that maximize the potential benefits, which could be achieved if significant interaction effects occur between the dietary and pharmacological treatment. Our findings suggest that the combined actions of NPS and S markedly reduce glycemia consistently across both acute and long-term measures of glucose response. This novel treatment may be a promising dietary/pharmacological co-therapy for type 2 diabetes management.
Supplementary Material
Acknowledgments
The authors thank Kristine Lee (University of Calgary), Joan Wicks (Alizee), and Jamie Boulet, Leia Rispoli, Harry Maselli, and Jessica Beyenhof (Product Safety Labs) for their technical assistance with this work. PGX and PolyGlycopleX are registered trademarks of InovoBiologic Inc, Canada. All other trademarks belong to their respective owners. All authors designed research; G.J.G., L.K., R.A.R., and P.J. conducted research; R.A.R., G.J.G., and L.K. analyzed data; R.A.R. wrote the paper; and R.A.R. and S.W. had primary responsibility for final content. All authors read and approved the final manuscript.
Footnotes
Supported by InovoBiologic Inc., Calgary, Canada.
Author disclosures: R. A. Reimer receives consulting fees from InovoBiologic Inc. and received financial support for the preparation of this manuscript. G. J. Grover and L. Koetzner received funding from InovoBiologic Inc to perform this study and have no financial interest in PGX. R. J. Gahler is the owner of the Factors Group of Nutritional Companies, which retains an interest in PGX. M. R. Lyon receives consulting fees from the Factors Group of Companies and has no financial interest in PGX. P. Juneja was an employee of Canadian Centre of Functional Medicine. S. Wood receives consulting fees from InovoBiologic Inc and has no financial interest in PGX.
Supplemental Table 1 and Figure 1 are available from the “Online Supporting Material” link in the online posting of the article and from the same link in the online table of contents at http://jn.nutrition.org.
Abbreviations used: AST, alanine aminotransferase; C, control; DPP4, dipeptidyl peptidase 4; GIP, glucose-dependent insulinotropic polypeptide; GIPr, glucose-dependent insulinotropic polypeptide receptor; GLP-1, glucagon-like peptide 1; HbA1c, glycated hemoglobin; InsAUC15:GluAUC20, ratio of insulin AUC:glucose AUC from 0 to 15 min of the oral glucose tolerance test; InsAUC30:GluAUC30, ratio of insulin AUC:glucose AUC from 0 to 30 min of the oral glucose tolerance test; InsAUC120:GluAUC120, ratio of insulin AUC:glucose AUC from 0 to 120 min of the oral glucose tolerance test; NPS, novel polysaccharide; OGTT, oral glucose tolerance test; PGX, PolyGlycopleX; PYY, peptide tyrosine tyrosine; S, sitagliptin; WAT, white adipose tissue; ZDF, Zucker diabetic fatty.
Literature Cited
- 1.Fincham JE. The expanding public health threat of obesity and overweight. Int J Pharm Pract. 2011;19:214–6. doi: 10.1111/j.2042-7174.2011.00126.x. [DOI] [PubMed] [Google Scholar]
- 2.WHO. Fact sheet no 311. WHO Media Centre; 2011. Obesity and overweight. [cited 2011 Nov]. Available from: www.who.int/mediacentre/factsheets/fs311/en/index.html. [Google Scholar]
- 3.NIH. Clinical guidelines on the identification, evaluation, and treatment of overweight and obesity in adults. The evidence report. Obes Res. 1998;6(Suppl 2):S51–209. [PubMed] [Google Scholar]
- 4.Ahrén B. Dipeptidyl peptidase-4 inhibitors: clinical data and clinical implications. Diabetes Care. 2007;30:1344–50. doi: 10.2337/dc07-0233. [DOI] [PubMed] [Google Scholar]
- 5.Baggio LL, Drucker DJ. Biology of incretins: GLP-1 and GIP. Gastroenterology. 2007;132:2131–57. doi: 10.1053/j.gastro.2007.03.054. [DOI] [PubMed] [Google Scholar]
- 6.Pratley RE, Gilbert M. Targeting incretins in type 2 diabetes: role of GLP-1 receptor agonists and DPP-4 inhibitors. Rev Diabet Stud. 2008;5:73–94. doi: 10.1900/RDS.2008.5.73. [DOI] [PMC free article] [PubMed] [Google Scholar]
- 7.Ahrén B, Simonsson E, Larsson H, Landin-Olsson M, Torgeirsson H, Jansson P, Sandqvist M, Bavenholm P, Efendic S, Erikkson JW, et al. Inhibition of dipeptidyl peptidase IV improves metabolic control over a 4-week study period in type 2 diabetes. Diabetes Care. 2002;25:869–75. doi: 10.2337/diacare.25.5.869. [DOI] [PubMed] [Google Scholar]
- 8.Ahrén B. Clinical results of treating type 2 diabetic patients with sitagliptin, vildagliptin or saxagliptin–diabetes control and potential adverse events. Best Pract Res Clin Endocrinol Metab. 2009;23:487–98. doi: 10.1016/j.beem.2009.03.003. [DOI] [PubMed] [Google Scholar]
- 9.Aschner P, Kipnes MS, Lunceford JK, Sanchez M, Mickel C, Williams-Herman DE Sitagliptin Study 021 Group. Effect of the dipeptidyl peptidase-4 inhibitor sitagliptin as monotherapy on glycemic control in patients with type 2 diabetes. Diabetes Care. 2006;29:2632–7. doi: 10.2337/dc06-0703. [DOI] [PubMed] [Google Scholar]
- 10.Charbonnel B, Karasik A, Liu J, Wu M, Meininger G Sitagliptin Study 020 Group. Efficacy and safety of the dipeptidyl peptidase-4 inhibitor sitagliptin added to ongoing metformin therapy in patients with type 2 diabetes inadequately controlled with metformin alone. Diabetes Care. 2006;29:2638–43. doi: 10.2337/dc06-0706. [DOI] [PubMed] [Google Scholar]
- 11.Weickert MO, Pfeiffer AFH. Metabolic effects of dietary fiber consumption and prevention of diabetes. J Nutr. 2008;138:439–42. doi: 10.1093/jn/138.3.439. [DOI] [PubMed] [Google Scholar]
- 12.Reimer RA, McBurney MI. Dietary fiber modulates intestinal proglucagon messenger ribonucleic acid and postprandial secretion of glucagon-like peptide-1 and insulin in rats. Endocrinology. 1996;137:3948–56. doi: 10.1210/endo.137.9.8756571. [DOI] [PubMed] [Google Scholar]
- 13.Reimer RA, Thomson ABR, Rajotte R, Basu TK, Ooraikul B, McBurney MI. A physiological level of rhubarb fiber increases proglucagon gene expression and modulates intestinal glucose uptake in rats. J Nutr. 1997;127:1923–8. doi: 10.1093/jn/127.10.1923. [DOI] [PubMed] [Google Scholar]
- 14.Maurer AD, Chen Q, McPherson C, Reimer RA. Changes in satiety hormones and expression of genes involved in glucose and lipid metabolism in rats weaned onto diets high in fiber or protein reflect susceptibility to increased fat mass in adulthood. J Physiol. 2009;587:679–91. doi: 10.1113/jphysiol.2008.161844. [DOI] [PMC free article] [PubMed] [Google Scholar]
- 15.Cani PD, Neyrinck AM, Maton N, Delzenne NM. Oligofructose promotes satiety in rats fed a high-fat diet: involvement of glucagon-like peptide-1. Obes Res. 2005;13:1000–7. doi: 10.1038/oby.2005.117. [DOI] [PubMed] [Google Scholar]
- 16.Cani PD, Dewever C, Delzenne NM. Inulin-type fructans modulate gastrointestinal peptides involved in appetite regulation (glucagon-like peptide-1 and ghrelin) in rats. Br J Nutr. 2004;92:521–6. doi: 10.1079/bjn20041225. [DOI] [PubMed] [Google Scholar]
- 17.Grover GJ, Koetzner L, Wicks J, Gahler RJ, Lyon MR, Reimer RA, Wood S. Effects of the soluble fiber complex PolyGlycopleX® (PGX®) on glycemic control, insulin secretion, and GLP-1 levels in Zucker diabetic rats. Life Sci. 2011;88:392–9. doi: 10.1016/j.lfs.2010.11.014. [DOI] [PubMed] [Google Scholar]
- 18.Reimer RA, Pelletier X, Carabin IG, Lyon MR, Gahler R, Parnell JA, Wood S. Increased plasma PYY levels following supplementation with the functional fiber PolyGlycopleX® in healthy adults. Eur J Clin Nutr. 2010;64:1186–91. doi: 10.1038/ejcn.2010.141. [DOI] [PubMed] [Google Scholar]
- 19.Kacinik V, Lyon M, Purnama M, Reimer RA, Gahler R, Green TJ, Wood S. Effect of PGX®, a novel functional fibre supplement, on subjective ratings of appetite in overweight and obese women consuming a three-day structured, low calorie diet. Nutr Diabet. 2011;1:e22. doi: 10.1038/nutd.2011.18. [DOI] [PMC free article] [PubMed] [Google Scholar]
- 20.Daubioul C, Rousseau N, Demeure R, Gallez B, Taper HS, Declerck B, Delzenne NM. Dietary fructans, but not cellulose, decrease triglyceride accumulation in the liver of obese Zucker fa/fa rats. J Nutr. 2002;132:967–73. doi: 10.1093/jn/132.5.967. [DOI] [PubMed] [Google Scholar]
- 21.Lenhard JM, Croom DK, Minnick DT. Reduced serum dipeptidyl peptidase-IV after metformin and pioglitazone treatments. Biochem Biophys Res Commun. 2004;324:92–7. doi: 10.1016/j.bbrc.2004.09.021. [DOI] [PubMed] [Google Scholar]
- 22.Anderson JW, Jones AE, Riddel-Mason S. Ten different dietary fibers have significantly different effects on serum and liver lipids of cholesterol-fed rats. J Nutr. 1994;124:78–83. doi: 10.1093/jn/124.1.78. [DOI] [PubMed] [Google Scholar]
- 23.Stancáková A, Kuulasmaa T, Paananen J, Jackson AU, Bonnycastle LL, Collins FS, Boehnke M, Kuusisto J, Laakso M. Association of 18 confirmed susceptibility loci for type 2 diabetes with indices of insulin release, proinsulin conversion, and insulin sensitivity in 5,327 nondiabetic Finnish men. Diabetes. 2009;58:2129–36. doi: 10.2337/db09-0117. [DOI] [PMC free article] [PubMed] [Google Scholar]
- 24.Lewis JT, Dayanandan B, Habener JF, Kieffer T. Glucose dependent insulinotropic polypeptide confers early phase insulin release to oral glucose in rats: demonstration by a receptor antagonist. Endocrinology. 2000;141:3710–6. doi: 10.1210/endo.141.10.7750. [DOI] [PubMed] [Google Scholar]
- 25.Kirino Y, Kamimoto T, Sata Y, Kawazoe K, Minakuchi K, Nakahori Y. Increased plasma dipeptidyl peptidase IV (DPP IV) activity and decreased DPP IV activity of visceral but not subcutaneous adipose tissue in impaired glucose tolerance rats induced by high-fat or high-sucrose diet. Biol Pharm Bull. 2009;32:463–7. doi: 10.1248/bpb.32.463. [DOI] [PubMed] [Google Scholar]
- 26.Grover GJ, Koetzner L, Wicks J, Gahler R, Lyon MR, Reimer RA, Wood S. Effects of the soluble fiber complex PolyGlycopleX on glucose homeostasis and body weight in young Zucker diabetic rats. Front Pharmacol. 2011;2:47. doi: 10.3389/fphar.2011.00047. [DOI] [PMC free article] [PubMed] [Google Scholar]
- 27.Pyra KA, Saha DC, Reimer RA. Prebiotic fiber increases hepatic acetyl CoA carboxylase phosphorylation and suppresses glucose-dependent insulinotropic polypeptide secretion more effectively when used with metformin in obese rats. J Nutr. 2012;142:213–20. doi: 10.3945/jn.111.147132. [DOI] [PMC free article] [PubMed] [Google Scholar]
- 28.Eller LK, Reimer RA. A high calcium, skim milk powder diet results in a lower fat mass in male, energy-restricted, obese rats more than a low calcium, casein or soy protein diet. J Nutr. 2010;140:1234–41. doi: 10.3945/jn.109.119008. [DOI] [PubMed] [Google Scholar]
- 29.Bi Y, Zhu D, Jing Y, Hu Y, Feng W, Shen S, Tong G, Shen X, Yu T, Song D, et al. Decreased beta cell function and insulin sensitivity contributed to increasing fasting glucose in Chinese. Acta Diabetol. doi: 10.1007/s00592-010-0194-4. Epub 2010 May 15. [DOI] [PubMed] [Google Scholar]
- 30.Farag YM, Gaballa MR. Diabesity: an overview of a rising epidemic. Nephrol Dial Transplant. 2011;26:28–35. doi: 10.1093/ndt/gfq576. [DOI] [PubMed] [Google Scholar]
- 31.Vuksan V, Rogovik AL, Jovanovski E, Jenkins AL. Fiber facts: benefits and recommendations for individuals with type 2 diabetes. Curr Diabetes Rev. 2009;9:405–11. doi: 10.1007/s11892-009-0062-1. [DOI] [PubMed] [Google Scholar]
- 32.Babio N, Balanza R, Basulto J, Bullo M, Salas-Salvado J. Dietary fibre: influence on body weight, glycemic control and plasma cholesterol profile. Nutr Hosp. 2010;25:327–40. [PubMed] [Google Scholar]
- 33.Doggrell SA. Sitagliptin or exenatide once weekly for type 2 diabetes: comparison of the clinical trials. Expert Opin Pharmacother. 2011;12:2055–67. doi: 10.1517/14656566.2011.576671. [DOI] [PubMed] [Google Scholar]
- 34.Selvin E, Marinopoulos S, Berkenblit G, Rami T, Brancati FL, Powe NR, Golden SH. Meta-analysis: glycosylated hemoglobin and cardiovascular disease in diabetes mellitus. Ann Intern Med. 2004;141:421–31. doi: 10.7326/0003-4819-141-6-200409210-00007. [DOI] [PubMed] [Google Scholar]
- 35.Cavalot F, Pagliarino A, Valle M, Di Martino L, Bonomo K, Massucco P, Anfossi G, Trovati M. Postprandial blood glucose predicts cardiovascular events and all cause mortality in type 2 diabetes in a 14-year follow-up: lessons from the san luigi gonzaga diabetes study. Diabetes Care. 2011;34:2237–43. doi: 10.2337/dc10-2414. [DOI] [PMC free article] [PubMed] [Google Scholar]
- 36.Peterson RG, Shaw WN, Neel M-A, Little LA, Eichberg J. Zucker diabetic fatty rat as a model of non-insulin dependent diabetes mellitus. Ilar News. 1990;32:16–9. doi: 10.1093/ilar.32.3.13. [DOI] [PMC free article] [PubMed] [Google Scholar]
- 37.Brand-Miller JC, Atkinson FS, Gahler RJ, Kacinik V, Lyon MR, Wood S. Effects of added PGX®, a novel functional fibre, on the glycaemic index of starchy foods. Br J Nutr. 2012;108:245–8. doi: 10.1017/S0007114511005447. [DOI] [PubMed] [Google Scholar]
- 38.Irvine C, Taylor NF. Progressive resistance exercise improves glycaemic control in people with type 2 diabetes mellitus: a systematic review. Aust J Physiother. 2009;55:237–46. doi: 10.1016/s0004-9514(09)70003-0. [DOI] [PubMed] [Google Scholar]
- 39.Ugleholdt R, Pedersen J, Bassi MR, Fuchtbauer EM, Joergensen SM, Kissow HL, Nytofte N, Poulsen SS, Rosenkilde MM, Seino Y, et al. Transgenic rescue of adipocyte Glucose-dependent Insulinotropic poly-peptide receptor expression restores high fat diet induced body weight gain. J Biol Chem. 2011;286:44632–45. doi: 10.1074/jbc.M111.311779. [DOI] [PMC free article] [PubMed] [Google Scholar]
- 40.Sturis J, Gotfredsen CF, Romer J, Rolin B, Ribel U, Brand CL, Wilken M, Wasserman K, Deacon CF, Carr RD, et al. GLP-1 derivative liraglutide in rats with beta-cell deficiencies: influence of metabolic state on beta-cell mass dynamics. Br J Pharmacol. 2003;140:123–32. doi: 10.1038/sj.bjp.0705397. [DOI] [PMC free article] [PubMed] [Google Scholar]
- 41.Aaboe K, Knop FK, Vilsboll T, Deacon CF, Holst JJ, Madsbad S, Krarup T. Twelve weeks treatment with the DPP-4 inhibitor, sitagliptin, prevents degradation of peptide YY and improves glucose and non-glucose induced insulin secretion in patients with type 2 diabetes mellitus. Diabetes Obes Metab. 2010;12:323–33. doi: 10.1111/j.1463-1326.2009.01167.x. [DOI] [PubMed] [Google Scholar]
- 42.Augustyns K, Bal G, Thonus G, Belyaev A, Zhang XM, Bollaert W, Lambeir AM, Durinx C, Goossens F, Haemers A. The unique properties of dipeptidyl-peptidase IV (DPP IV/CD26) and the therapeutic potential of DPP IV inhibitors. Curr Med Chem. 1999;6:311–27. [PubMed] [Google Scholar]
- 43.Sangle GV, Lauffer LM, Grieco A, Iakoubov R, Brubaker PL. Novel biological action of the dipeptidylpeptidase-IV inhibitor, sitagliptin, as a glucagon-like peptide-1 secretagogue. Endocrinology. 2012;153:564–73. doi: 10.1210/en.2011-1732. [DOI] [PubMed] [Google Scholar]
- 44.Butler AE, Janson J, Bonner-Weir S, Ritzel R, Rizza RA, Butler PC. Beta-cell deficit and increased beta-cell apoptosis in humans with type 2 diabetes. Diabetes. 2003;52:102–10. doi: 10.2337/diabetes.52.1.102. [DOI] [PubMed] [Google Scholar]
- 45.Wang Q, Jin T. The role of insulin signaling in the development of β-cell dysfunction and diabetes. Islets. 2009;1:95–101. doi: 10.4161/isl.1.2.9263. [DOI] [PubMed] [Google Scholar]
- 46.Navarro-Tableros V, Sanchez-Soto MC, Garcia S, Hiriart M. Autocrine regulation of single pancreatic beta-cell survival. Diabetes. 2004;53:2018–23. doi: 10.2337/diabetes.53.8.2018. [DOI] [PubMed] [Google Scholar]
- 47.Chen B, Moore A, Escobedo LV, Koletsky MS, Hou D, Koletsky RJ, Ernsberger P. Sitagliptin lowers glucagon and improves glucose tolerance in prediabetic obese SHROB rats. Exp Biol Med (Maywood) 2011;236:309–14. doi: 10.1258/ebm.2010.010161. [DOI] [PubMed] [Google Scholar]
- 48.Maiztegui B, Borelli MI, Madrid VG, Del Zotto H, Raschia MA, Francini F, Massa ML, Flores LE, Rebolledo OR, Gagliardino JJ. Sitagliptin prevents the development of metabolic and hormonal disturbances, increased beta-cell apoptosis and liver steatosis induced by a fructose-rich diet in normal rats. Clin Sci (Lond) 2011;120:73–80. doi: 10.1042/CS20100372. [DOI] [PubMed] [Google Scholar]
- 49.Ferreira L, Teixeira-de-Lemos E, Pinto F, Parada B, Mega C, Vala H, Pinto R, Garrido P, Sereno J, Fernandes R, et al. Effects of sitagliptin treatment on dysmetabolism, inflammation, and oxidative stress in an animal model of type 2 diabetes (ZDF rat) Mediators Inflamm. 2010;2010:592760. doi: 10.1155/2010/592760. [DOI] [PMC free article] [PubMed] [Google Scholar]
- 50.Matveyenko AV, Dry S, Cox HI, Moshtaghian A, Gurlo T, Galasso R, Butler AE, Butler PC. Beneficial endocrine but adverse exocrine effects of sitagliptin in the human islet amyloid polypeptide transgenic rat model of type 2 diabetes: interactions with metformin. Diabetes. 2009;58:1604–15. doi: 10.2337/db09-0058. [DOI] [PMC free article] [PubMed] [Google Scholar]
- 51.Thomas L, Eckhardt M, Langkopf E, Tadayyon M, Himmelsbach F, Mark M. (R)-8-(3-amino-piperidin-1-yl)-7-but-2-ynyl-3-methyl-1-(4-methyl-quinazolin-2-ylmethyl)-3,7-dihydro-purine-2,6-dione (BI 1356), a novel xanthine-based dipeptidyl peptidase 4 inhibitor, has a superior potency and longer duration of action compared with other dipeptidyl peptidase-4 inhibitors. J Pharmacol Exp Ther. 2008;325:175–82. doi: 10.1124/jpet.107.135723. [DOI] [PubMed] [Google Scholar]
- 52.Shang Q, Liu MK, Saumoy M, Holst JJ, Salen G, Xu G. The combination of colesevelam with sitagliptin enhances glycemic control in diabetic ZDF rat model. Am J Physiol Gastrointest Liver Physiol. 2012;302:G815–23. doi: 10.1152/ajpgi.00295.2011. [DOI] [PubMed] [Google Scholar]
- 53.Reimer RA, Grover GJ, Koetzner L, Gahler R, Lyon M, Wood S. The soluble fiber complex PolyGlycopleX lowers serum triglycerides and reduces hepatic steatosis in high-sucrose-fed rats. Nutr Res. 2011;31:296–301. doi: 10.1016/j.nutres.2011.03.012. [DOI] [PubMed] [Google Scholar]
- 54.Rigby SP, Handelsman Y, Lai YL, Abby SL, Tao B, Jones MR. Effects of colesevelam, rosiglitazone, or sitagliptin on glycemic control and lipid profile in patients with type 2 diabetes mellitus inadequately controlled by metformin monotherapy. Endocr Pract. 2010;16:53–63. doi: 10.4158/EP09146.OR. [DOI] [PubMed] [Google Scholar]
Associated Data
This section collects any data citations, data availability statements, or supplementary materials included in this article.