

Abstract
Several approaches have been adopted for real-time imaging of neural activity in vivo. We tested a new cell-penetrating phosphorescent oxygen-sensitive probe, NanO2-IR, to monitor temporal and spatial dynamics of oxygen metabolism in the neocortex following peripheral sensory stimulation. Probe solution was applied to the surface of anesthetized mouse brain; optical imaging was performed using a MiCAM-02 system. Trains of whisker stimuli were delivered and associated changes in phosphorescent signal were recorded in the contralateral somatosensory (“barrel”) cortex. Sensory stimulation led to changes in oxygenation of activated areas of the barrel cortex. The oxygen imaging results were compared to those produced by the voltage-sensitive dye RH-1691. While the signals emitted by the two probes differed in shape and amplitude, they both faithfully indicated specific whisker evoked cortical activity. Thus, NanO2-IR probe can be used as a tool in visualization and realtime analysis of sensory- evoked neural activity in vivo.
Keywords: oxygen-sensitive phosphorescent probe, in vivo imaging, brain oxygenation and metabolism, neural activity, somatosensory cortex, whisker stimulation, barrel field
Introduction
Localization and real-time monitoring of neuronal activity evoked by peripheral stimulation are important steps in understanding the functional characteristics of neuronal circuits in the brain (Bahar et al., 2006; Inyushin et al., 2010; Lenkov et al, 2012; Tsytsarev et al, 2012). The barrel cortex of rodents is an excellent model to study such peripherally evoked neural activity, because each whisker on the snout is represented by discrete modules of layer IV granule cells (“barrels”) and patches of thalamocortical afferent terminals that fill them in the primary somatosensory (SI) cortex (Erzurumlu et al, 2010; Erzurumlu and Gaspar, 2012). Experimental tweaking of a single whisker evokes focal activity in its corresponding barrel in the contralateral cortex. The barrels are also arranged in curvilinear arrays that replicate the distribution of the whisker follicles on the animal’s snout. Furthermore, relatively superficial location of the barrels (about 300–400 µm depth) below the cranium makes this area highly suitable for imaging of whisker-evoked neural activity in vivo, both in anesthetized and awake, behaving preparations (Ferezou et al, 2006; Lutcke et al, 2010; O'Connor et al, 2010).
Several technical approaches have been developed and used for imaging of the mammalian brain during various forms of activity. For example, functional magnetic resonance imaging (fMRI) is used to localize active foci of the brain by detecting changes in blood flow and energy usage (Lenkov et al, 2012). Although regarded as optimal for measurement of blood flow, this technique is not widely available in research laboratories and it provides only limited information on tissue metabolism. Fluorescent imaging with voltage-sensitive dyes (VSDs) like RH-1691 directly reflects neural activity (Tsytsarev et al, 2011, 2012; Salzberg et al, 1977) and has been used in many animal studies to image changes in membrane potentials and action potentials of excitable cells. Intrinsic Optical Signal imaging (IOS) (Inyushin et al, 2001; Bahar et al, 2006; Tsytsarev et al, 2008, 2010) allows visualization of neural activity via the optical changes in brain tissue associated with differential light absorption properties of oxy- and deoxyhemoglobin. This method was used in a number of functional brain mapping studies; however, changes in measured signals are rather small (<1%) and imaging requires long signal acquisition times and averaging. Phosphorescent oxygen-sensitive probes have been applied to monitor oxygenation of live mammalian tissue (Wilson et al, 2013) and of blood vessels in the brain of anaesthetized animals (Sakadzic et al, 2010). However, these dendrimeric probes are complex, cell-impermeable and are usually administered by systemic injection (Lecoq et al, 2011). Their use in in vivo imaging is associated with high doses (leading to possible toxicity or side effects), short time window (rapid clearance from circulation), rather sophisticated equipment and high costs. A needle type sensor for monitoring O2 in regions of animal brain was described recently (Wilson et al, 2012), but this approach allows only single-point measurements.
Neural activity is associated with changes in metabolism, blood flow and energy usage by the tissue. Therefore, different metabolic markers can be used to probe and trace this activity. Glucose oxidation is the primary source of energy in the mammalian brain (Tsytsarev et al, 2011). It produces CO2, adenosine triphosphate (ATP) and lactate; the latter is consumed by neurons and astrocytes (Devor et al, 2011 and 2012; Lecoq et al, 2011 Schummers et al, 2008). Therefore, changes in tissue oxygenation and O2 consumption are important indicators of neuronal activity (Sakadzic et al 2010).
In this study we describe the use of a new phosphorescent oxygen sensitive probe, NanO2-IR, which is applied topically and real-time oxygenation of specific brain regions can be imaged. This probe is a direct analog of the cell-permeable probe NanO2 developed for sensing and imaging of O2 in live cells and tissues in vitro (Fercher et al, 2011; Papkovsky et al, 2012). NanO2-IR probe utilizes a long wavelength-excitable platinum (II) benzoporphyrin dye, better suited for imaging of live tissues. This new probe quickly stains the brain surface after topical application and short-term incubation. Subsequent imaging in anesthetized animals is carried out using standard camera-based imaging systems. Our experimental data demonstrate that NanO2-IR probe is a simple and efficient agent for optical O2 imaging and functional mapping of the barrel cortex in vivo.
Materials and Methods
In vivo imaging experiments were performed in six mice (B6, weight 25–30 g, age 2–3 months, both male and female) using a MiCAM-02 optical imaging system (SciMedia, Ltd, Figure 1). Mice were anesthetized with an intraperitoneal dose of urethane (1150 mg/kg). All animal handling was in accordance with the NIH Guide for the Care and Use of Laboratory Animals (NIH Publications No. 80–23) revised 1996 and a protocol approved by the UMB Animal Use and Care Committee. Briefly, an anesthetized animal was fixed on a stereotaxic apparatus, the skin and muscles of the dorsal part of the head were excised surgically and a 3×3 mm section of the cranium above the left parietal cortex was removed using a dental drill. The exposed dural surface was cleaned with a hemostatic sponge and then washed with sterile artificial cerebrospinal fluid (ACSF) pre-warmed to 30–35°C. During the experiment, the body temperature of the animal was kept at 37°C by a temperature-controlled heating pad. The voltage-sensitive dye, RH-1691 (Optical Imaging Inc., Israel) or the O2-sensitive probe NanO2-IR were applied to the exposed cortex at a concentration of 1.0 and 10 mg/ml, respectively, and incubated for 1 h and 30 min. After staining with the probe, the cortex was washed with ACSF for ~15 min, then covered with high-density silicone oil and sealed with a 0.1 mm thick cover glass to suppress brain pulsations originating from cardiovascular and respiratory movements. For the imaging, the CCD camera was positioned above the recording area and directed such that its optical axis was perpendicular to the cranial window. The focusing plane was set 300 µm below the dural surface. During the recording period the imaging area of the cortex was illuminated with a 630 +/−10 nm light directed via an excitation filter (Semrock FF01–632/22–25) with an average transmission of > 93% between 621 nm and 643 nm, and a dichroic mirror (650 nm single edge dichroic beam splitter; FF650-DiO1–50×70 mm MiCAM02, SciMedia).
Figure 1.
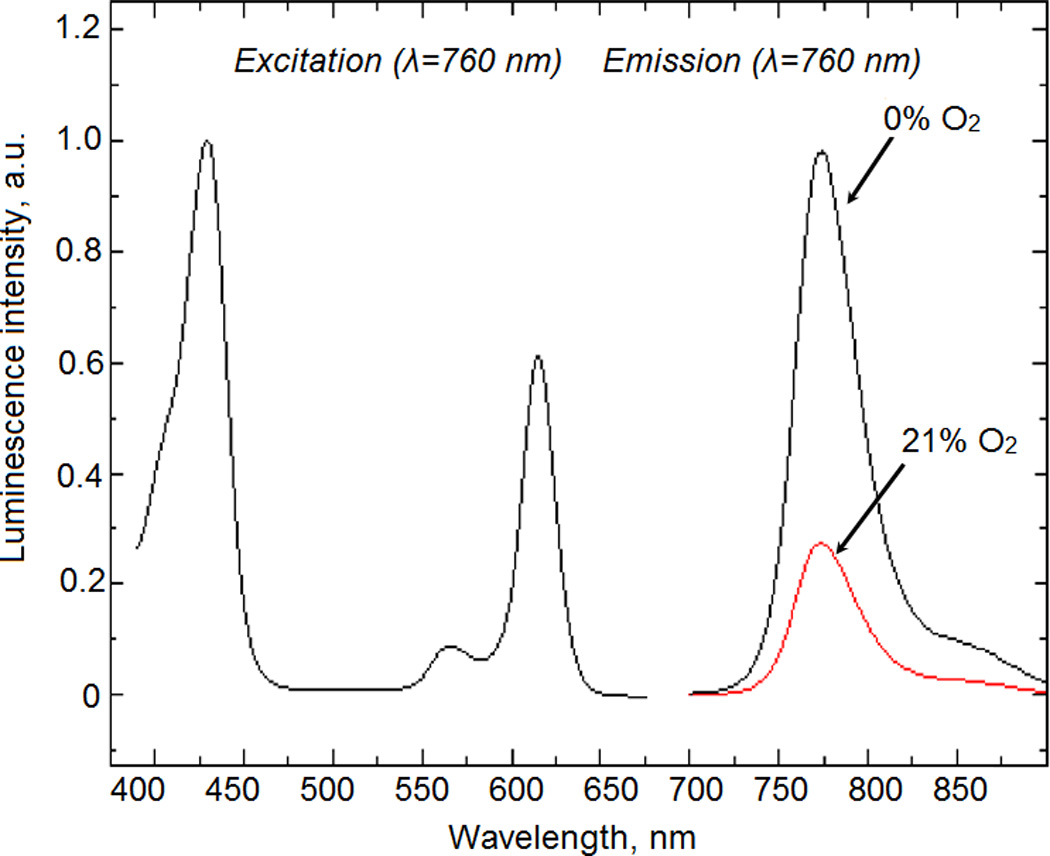
Excitation and emission spectra of the NanO2-IR probe at 37 °C. When changing from 21% to 0%, the O2 phosphorescence signal increases 3.5-fold.
At the start of each optical recording, gray-scale image of the region of interest (ROI) was obtained and saved as a graphic file. Each experiment with the RH-1691 dye consisted of 100 trials with 500 frames per trial, measured at a rate of 200 frame per second (fps) and 8 s inter-trial intervals. The experiment with NanO2-IR probe consisted of 100 trials with 50 frames per trial measured at 50 ms per frame and inter-trial interval 30 s.
The stimulation (E2 whisker deflection) was applied at the 300th frame in potentiometric experiments and at the 30th - in O2 – monitoring experiments. For the VSD imaging each stimulus pulse consisted of one 25-ms deflection, for the O2 imaging each stimulus pulse consisted of eight 50 ms deflections with 50 ms inter-pulse interval. The stimulation was different for voltage- and oxygen-sensitive dye imaging. Oxygen–sensitive dye works much slower due to local oxygenation and it is evoked by longer stimulation (Bahar et al, 2006; Tsytsarev et al, 2012). For the same reason, the frame rate for the oxygen-sensitive dye was ten times slower than for voltage-sensitive dye (Figure 3 B, C). Changes in emission intensity in the ROI were calculated using Brain Vision Analyzer (Brain Vision Inc., Tokyo, Japan) and presented as ΔF/F (%). Normally sets of two imaging experiments were conducted: one with the NanO2-IR and another with the RH-1691 probe. At the end of each experiment the animal was euthanized with an overdose of urethane.
Figure 3.
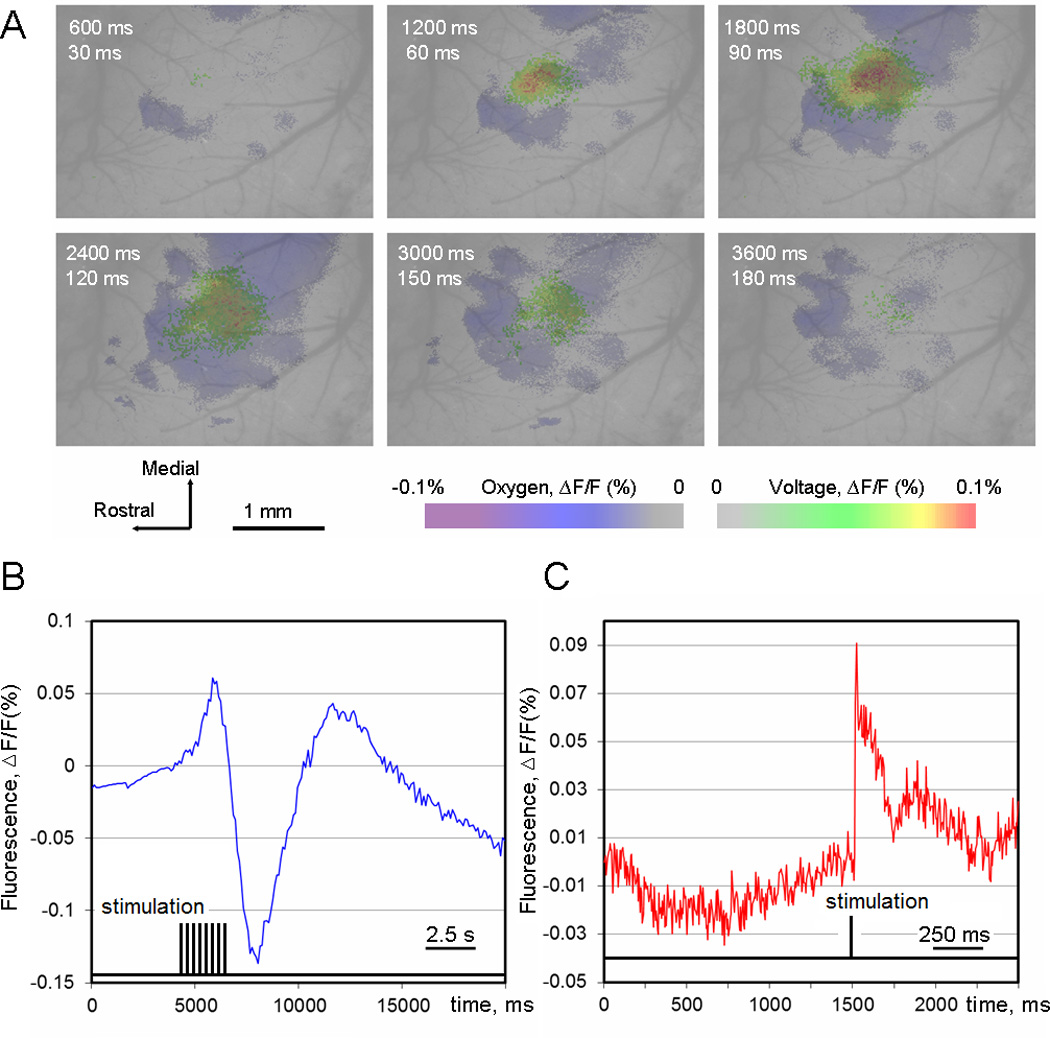
A: Superimposed pseudocolor images of the recorded regions obtained using the voltage –sensitive and O2-sensitive probes. In all cases the signal was averaged over 100 trials. The time after stimulus onset is indicated in the left top corner of each frame (top – O2-sensitive probes, bottom – VSD). Same signal scale for O2-sensitive probes and VSD. B, C: time course of the oxygen-sensitive and voltage-sensitive signals, respectively, both signals were averaged over 100 trials.
To determine the magnitude of the optical signal of the NanO2-IR probe histological analysis was carried out.
To prevent the wash out of NanO2-IR we deep-froze the whole head after euthanasia. The fresh frozen (−70 °C) head was sectioned in the coronal plane on a cryostat at −70°C. 150 µm thick sections were mounted on glass slides with TissueTekTM, coverslipped and photographically documented using a fluorescence microscope.
Results
The NanO2-IR probe is an analog of the cell-permeable O2 probe based on polymeric nanoparticles (Fercher et al, 2011) in which the phosphorescent PtPFPP dye is substituted with a long wavelength dye, platinum (II) tetra (4-fluorophenyl) tetrabenzoporphyrin (PtBP) (Borisov et al, 2008). This probe is excitable at 560–630nm (optimum at 615 nm), emits at 730–800 nm (maximum at 760 nm). It has high brightness, photostability and optimal response to O2 over the physiological range (0–21% or 0–210 mM of O2). Excitation and emission spectra of NanO2-IR are shown in Figure 2. These characteristics are well suited for in vivo imaging, ensure deep light penetration into tissue and compatibility with commercial animal imaging equipment, such as the MiCAM-02 imager.
Figure 2.
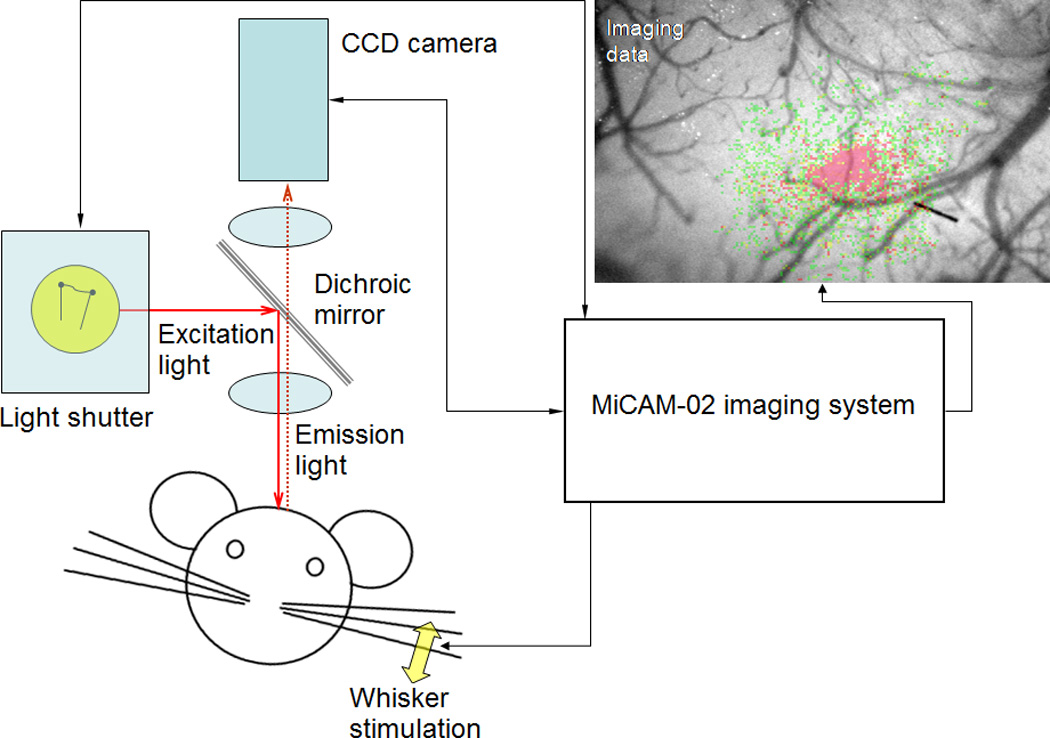
Experimental and optical setup used in in vivo imaging of O2 and VSD in mouse brain for whisker stimulation.
We found that NanO2-IR, when applied topically (40 –50 µl of 10 mg/ml solution), was able to stain live animal brain tissue rapidly and without toxic effects. The probe was retained in the tissue for at least 30 minutes, and this enabled us to perform in vivo imaging experiments. We performed staining of the mouse barrel cortex with NanO2-IR and monitored oxygenation of specific regions of the cortex over time following whisker stimulation. Similar experiments were also conducted with the voltage-sensitive dye RH-1691 (Tsytsarev et al, 2010).
For the sets of recorded images, functional pseudocolor maps of probe signals were constructed using first frame analysis (Tsytsarev et al, 2008). As a result of this, images of the activated areas of the cortex were produced in each frame both for O2 and VSD experiments. After the first frame analysis, activated areas of the brain surface were identified as pixels exhibiting a change in fluorescence (ΔF/F) greater than (for the VSD) or lower than (for the O2 sensing experiments) the half-maximal (for VSD) or half-minimal (for O2) change (Tsytsarev et al, 2009).
Such thresholding technique is commonly used in the analysis of IOS and potentiometric (RH-1691) imaging data to find intensity contours (Tsytsarev et al, 2010). We found that the cortical areas, activated by the whisker stimulation, were clearly identifiable by the O2-dependent signal. NanO2-IR and VSD probes and imaging were carried out on the same animal in two different experimental sessions. The corresponding activity patterns were in the same locations, however O2 imaging patterns produced bigger areas and more irregular shape. The overlay of the pseudocolor maps of differential signals produced by the voltage-sensitive dye and O2 imaging in the same animal are shown in Figure 3.
With regard to the time course, the O2 imaging typically produced a negative peak reaching minimum in about 3.0 – 3.5 s. After reaching its minimum, the signal in activated areas returned back to the baseline 8–10 s after the stimulus onset (Figure 4). The positive peak reached maximum in a 7 –10 s. Observations in each group (positive and negative peak) are distributed normally (Gaussian distribution) because the mean of each group was equal or nearly equal to the median. All observations are within the mean plus / minus three standard deviation interval (Figure 4, F). In some parts of the cortex the signal has a biphasic structure, and the first peak was positive or negative.
Figure 4.
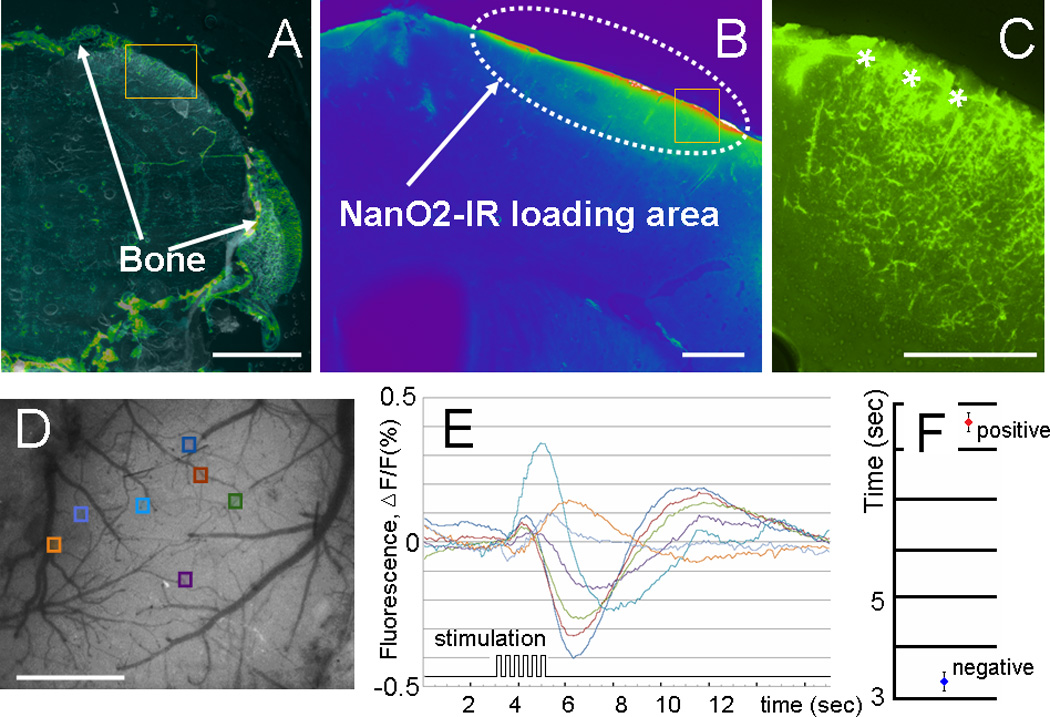
A–C: Fluorescence images of whole-head fresh frozen brain slices. The area marked by the rectangles in A is shown in higher magnification in B, the area marked by the rectangles in B is shown in higher magnification in C (dura mater is marked by asterisks). D–E: Representative ROIs in O2 imaging with seven different locations depicted in different colors (D) and corresponding time courses (E) of the recorded O2 responses from color-coded areas in E. F. The latency of the positive and negative signal of the oxygen- sensitive response. Scale bar: A, D – 1 mm, B, C – 0.1 mm.
The coronal brain slices (Figure 4) show NanO2-IR – loaded area below the cranial opening. The probe can diffuse into the dura mater and upper cortical layers, so probably it reflects the local oxygenation in the cortical tissue and the local capillary bed.
Discussion
For all experimental animals VSD and O2 optical imaging signals evoked by whisker stimulation were recorded in the areas that correspond to the left cortical barrel field. When both imaging experiments were done in the same animal we observed that activity spots had the same location (Figure 3), but the area of activated region was larger in the case of O2 imaging. This is not surprising since the VSD signals directly reflect fast changes in neural activity, while O2 imaging reflect the changes in tissue oxygenation and cerebral blood flow in adjacent blood vessels which occur more slowly. Therefore, activated areas in O2 imaging usually had a larger size and more irregular shape.
In VSD experiments the signal usually appeared immediately after the stimulus was applied and reached its peak after 20–30 ms. After reaching maximum value the signal decreased rapidly returning to the baseline 20–40 ms after stimulus onset. This temporal characteristic of whisker stimulation elicited signals is well known (Tsytsarev et al, 2010). In O2 imaging experiments, in most parts of the activated area the signal produced a negative peak 3.0 –3.5 s after stimulus onset, then generated a positive peak after 8.0 – 10.0 s and after this returned to the baseline. However, in some small areas, signal pattern was inversed: initially it showed a positive peak 3.0 –3.5 s after stimulus onset, then a smaller negative peak and return to the baseline. Some variability was observed in the time course of the signal in the different parts of the area, activated by whisker stimulation. This irregularity of the activity patterns in O2 imaging can be explained by the complexity of the cerebrovascular system. Activation of a region of the cortex can cause local oxygenation and increased blood flow in some of the blood vessels, thereby decreasing the blood flow in other neighboring vessels due to the redistribution of the local supply of blood and O2 to the tissue.
VSD imaging directly reflects activity of the neurons and glial cells (Salzberg et al, 1973). Since it is based on the transduction of the membrane potential changes into absorption or fluorescence changes, it works as an optical analog of electroencephalography (EEG) (Schummers et al, 2008), except that, unlike EEG, it is purely intracellular (Buzsaki et al, 2003).
In contrast, O2 imaging shows local oxygenation, which is a relatively slow metabolic process, but closely related to neural activity. Thus one might suggest that O2 imaging is an analog of the fMRI, and near infrared functional spectroscopy (NIRS). Further, it directly reflects changes in O2 concentration in a given brain region.
The biphasic character of the optical signal, caused by the opposite changes in oxygenation and deoxygenation has been demonstrated using near infrared spectroscopy (NIRS) (Akiyamaet al. 2006). A biphasic optical response has been observed at the stimulation site in response to local transcranial magnetic stimulation. The early response phase represents an increase in deoxygenated hemoglobin concentration, while the delayed phase represents an increase in oxyhemoglobin. Similar data have been obtained in epilepsy research (Roche-Labarbe, 2010) on the Genetic Absence Epilepsy Rats from Strasburg (GAERS). This study, based on simultaneous NIRS and EEG recordings, showed that the concentration of the oxyhemoglobin before the spike-and-wave discharges (GSWDs) starts decreasing, and then increases.
Deoxyhemoglobin concentration shows an inverse pattern in the same area. The areas of the oxygenation and deoxygenation are located very close to each other; therefore the biphasic signal can have different shapes in different regions of the cortical surface.
We think that the O2 patterns obtained in our study are very similar to the blood oxygenation level dependent signals (BOLD) produced in MRI (Lenkov et al, 2012). After reaching the maximum, the signal in the activated areas decreased and returned to baseline in a few seconds. However, these patterns are only typical and considerable variability may be observed. Since the shape of the activated area in O2 imaging looks more irregular compared to the VSD data we hypothesize that this reflects vascular irregularity of the recorded areas of the brain.
Positron –emission tomography (PET) and fMRI are established techniques for functional brain imaging, but have very high costs. The IOS imaging does not provide the required sensitivity and speed and VSD imaging has limited applicability due to significant probe toxicity (Tsytsarev et al, 2009, 2010). The NanO2-IR probe and O2 imaging are free from these limitations, providing a simple optical contrast agent with low toxicity and rapid application.
In vitro studies with phosphorescence O2 sensing and imaging also confirm that neural activity increases cellular O2 consumption (Devor et al, 2011) and changes in tissue oxygenation levels (Devor et al, 2011). Our in vivo experiments demonstrate that O2 imaging is a useful tool for monitoring changes in oxygenation of brain tissue caused by evoked neural activity, and it allows simple and reliable functional mapping of the brain in vivo. Other modifications of the NanO2-IR probe, for example analogs of the cell-penetrating ratiometric probe MM2 (Kondrashina et al, 2012) and imaging modalities (e.g. camera-based or laser-scanning FLIM) can also be developed, which can provide more accurate quantitative analysis of O2 concentration in vivo.
As a functional analog of the IOS, NanO2-IR probe provides a much greater signal/noise ratio and shorter image acquisition time. For comparative reference we used the well-established method of voltage-sensitive dye (VSD) imaging. O2 imaging, especially in combination with a voltage-sensitive dye, can be used as a tool for neurovascular coupling studies. It allows monitoring of the local oxygenation with high temporal and spatial resolution. Comparison of the voltage-sensitive dye and O2 imaging data can be valuable in experimental studies of ischemia, stroke, local epileptic seizures and other animal models of neurological diseases.
For this family of probes, toxicity effects were studied with cell and spheroid models (Dmitriev et al, 2012; Fercher et al, 2011, 2012; Zhdanov et al, 2012), and shown to become significant at probe concentrations >50 µg/ml and loading times >16h. Here we applied higher concentrations (10 mg/ml) but in a small volume and short loading times (0.5–1h) and the morphological and functional examination of brain tissue samples showed no signs of toxicity (see the results). A more detailed investigation of probe toxicity effects on brain tissue is underway, but it is outside the scope of the current study.
Combination of the two approaches allows comparison of neural activity and tissue metabolism. Further development of the O2 imaging approach and the probe described in this study can have broader applications, including clinical use.
-
!!
We tested in vivo cell-penetrating phosphorescent oxygen-sensitive probe NanO2-IR
-
!!
Phosphorescent signal was recorded in the barrel field of the somatosensory cortex
-
!!
Whisker stimulation led to changes in oxygenation in the barrel field
-
!!
The oxygenation data were compared to those produced by the voltage-sensitive dye
Acknowledgements
We thank B. Okura, T. Sakuraba and K. Tsubokura, SciMedia Co, for their help with data analysis. Supported by NIH/NINDS RO1 039050 (RSE) and the Science Foundation Ireland grant 07/IN.1/B1804 (DP).
Footnotes
Publisher's Disclaimer: This is a PDF file of an unedited manuscript that has been accepted for publication. As a service to our customers we are providing this early version of the manuscript. The manuscript will undergo copyediting, typesetting, and review of the resulting proof before it is published in its final citable form. Please note that during the production process errors may be discovered which could affect the content, and all legal disclaimers that apply to the journal pertain.
Contributor Information
Vassiliy Tsytsarev, Department of Anatomy and Neurobiology, University of Maryland School of Medicine, HSF II, 20 Penn Street, Baltimore, MD 21201-1075 Tel 410 706 7401 tsytsarev@umaryland.edu.
Hiroyuki Arakawa, Department of Anatomy and Neurobiology, University of Maryland School of Medicine, HSF II, 20 Penn Street, Baltimore, MD 21201-1075 Tel 410 706 7401 harakawa@umaryland.edu.
Sergei Borisov, Institute of Analytical Chemistry, Graz University of Technology, Stremayrgasse 9/II, Graz 8010, Austria; Tel.: +43-316-873-32512; sergey.borisov@tugraz.at.
Elena Pumbo, Center for Genetic Medicine, Children's National Medical Center, 111 Michigan Ave., N.W, Washington, D.C 20010 EPumbo@cnmcresearch.org.
Reha S. Erzurumlu, Department of Anatomy and Neurobiology, University of Maryland School of Medicine, HSF II Room S25, 20 Penn Street, Baltimore, MD 21201-1075, Tel 410 706 7401; Fax 410 706 2512 rerzu001@umaryland.edu
Dmitri B. Papkovsky, Biochemistry Department, University College Cork, Cavanagh Pharmacy Building, College Road, Cork, Ireland; Tel/Fax: +353-21-490-1698 d.papkovsky@ucc.ie
References
- 1.Akiyama T, Ohira T, Kawase T, Kato T. TMS orientation for NIRS-functional motor mapping. Brain Topogr. 2009;19(1–2):1–9. doi: 10.1007/s10548-006-0007-9. [DOI] [PubMed] [Google Scholar]
- 2.Bahar S, Suh M, Zhao M, Schwartz TH. Intrinsic optical signal imaging of neocortical seizures: the 'epileptic dip'. NeuroReport. 2006;17:499–503. doi: 10.1097/01.wnr.0000209010.78599.f5. [DOI] [PubMed] [Google Scholar]
- 3.Borisov SM, Nuss G, Klimant I. Red light-excitable oxygen sensing materials based on platinum(II) and palladium(II) benzoporphyrins. Anal Chem. 2008;80(24):9435–9442. doi: 10.1021/ac801521v. [DOI] [PubMed] [Google Scholar]
- 4.Buzsaki G, Traub RD, Pedley TA. The cellular basis of EEG activity. In: Ebersole JS, Pedley TA, editors. Current practice of clinical electroencephalography. 3rd ed. Philadelphia: Lippincott Williams and Wilkins; 2003. pp. 1–11. [Google Scholar]
- 5.Chen Y, Aguirre AD, Ruvinskaya L, Devor A, Boas DA, Fujimoto JG. Optical coherence tomography (OCT) reveals depth-resolved dynamics during functional brain activation. J Neurosci Methods. 2009;178(1):162–173. doi: 10.1016/j.jneumeth.2008.11.026. [DOI] [PMC free article] [PubMed] [Google Scholar]
- 6.Devor A, Hillman EM, Tian P, Waeber C, Teng IC, Ruvinskaya L, Shalinsky MH, Zhu H, Haslinger RH, Narayanan SN, Ulbert I, Dunn AK, Lo EH, Rosen BR, Dale AM, Kleinfeld D, Boas DA. Stimulus-induced changes in blood flow and 2-deoxyglucose uptake dissociate in ipsilateral somatosensory cortex. J Neurosci. 2008;28(53):14347–14357. doi: 10.1523/JNEUROSCI.4307-08.2008. [DOI] [PMC free article] [PubMed] [Google Scholar]
- 7.Devor A, Sakadzic S, Saisan PA, Yaseen MA, Roussakis E, Srinivasan VJ, Vinogradov SA, Rosen BR, Buxton RB, Dale AM, Boas DA. "Overshoot" of O2 is required to maintain baseline tissue oxygenation at locations distal to blood vessels. J Neurosci. 2011;21(38):13676–13681. doi: 10.1523/JNEUROSCI.1968-11.2011. 31. [DOI] [PMC free article] [PubMed] [Google Scholar]
- 8.Devor A, Sakadzic S, Srinivasan VJ, Yaseen MA, Nizar K, Saisan PA, Tian P, Dale AM. Vinogradov Frontiers in optical imaging of cerebral blood flow and metabolism. J Cereb Blood Flow Metab. 2012;32(7):1259–1276. doi: 10.1038/jcbfm.2011.195. [DOI] [PMC free article] [PubMed] [Google Scholar]
- 9.Dmitriev RI, Zhdanov AV, Jasionek G, Papkovsky DB. Assessment of cellular oxygen gradients with a panel of phosphorescent oxygen-sensitive probes. Anal Chem. 2012;84(6):2930–2938. doi: 10.1021/ac3000144. [DOI] [PubMed] [Google Scholar]
- 10.Erzurumlu RS, Gaspar P. Development and critical period plasticity of the barrel cortex. Eur J Neurosci. 2012;35(10):1540–1553. doi: 10.1111/j.1460-9568.2012.08075.x. [DOI] [PMC free article] [PubMed] [Google Scholar]
- 11.Erzurumlu RS, Murakami Y, Rijli FM. Mapping the face in the somatosensory brainstem. Nat Rev Neurosci. 2010;11(4):252–263. doi: 10.1038/nrn2804. [DOI] [PMC free article] [PubMed] [Google Scholar]
- 12.Fercher A, Borisov SM, Zhdanov AV, Klimant I, Papkovsky DB. Intracellular O2 sensing probe based on cell-penetrating phosphorescent nanoparticles. ACS Nano. 2011;5(7):5499–5508. doi: 10.1021/nn200807g. [DOI] [PubMed] [Google Scholar]
- 13.Fercher A, Zhdanov AV, Papkovsky DB. O2 Imaging in Biological Specimens. In: Papkovsky DB, Zhdanov AV, Fercher A, Dmitriev RI, Hynes J, editors. Phosphorescent Oxygen-sensitive Probes. Springer Briefs in Biochemistry and Molecular Biology; 2012. pp. 71–103. [Google Scholar]
- 14.Ferezou I, Bolea S, Petersen CC. Visualizing the cortical representation of whisker touch: voltage-sensitive dye imaging in freely moving mice. Neuron. 2006;50(4):617–629. doi: 10.1016/j.neuron.2006.03.043. [DOI] [PubMed] [Google Scholar]
- 15.Hu S, Maslov K, Tsytsarev V, Wang LV. Functional transcranial brain imaging by optical-resolution photoacoustic microscopy. J Biomed Opt. 2009;14:040503. doi: 10.1117/1.3194136. [DOI] [PMC free article] [PubMed] [Google Scholar]
- 16.Inyushin MY, Volnova AB, Lenkov DN. Use of a simplified method of optical recording to identify foci of maximal neuron activity in the somatosensory cortex of white rats. Neurosci. Behav. 2001;31:201–205. doi: 10.1023/a:1005272526284. Physiol. [DOI] [PubMed] [Google Scholar]
- 17.Inyushin MY, Sibarov DA, Volnova AB. Dynamics of membrane currents in astrocytes after the stimulation of glutamatergic synaptic transmission in rat hippocampus. Dokl Biol Sci. 2013;449(1):118–121. [Google Scholar]
- 18.Kondrashina AV, Dmitriev RI, Borisov SM, Klimant I, O'Brien I, Nolan YM, Zhdanov AV, Papkovsky DB. Correction: A Phosphorescent Nanoparticle-Based Probe for Sensing and Imaging of Intra- Cellular Oxygen in Multiple Detection Modalities. Advanced Functional Materials. 2012;22(23):4854. [Google Scholar]
- 19.Kosterin P, Kim GH, Muschol M, Obaid AL, Salzberg BM. Changes in FAD and NADH fluorescence in neurosecretory terminals are triggered by calcium entry and by ADP production. J Membr Biol. 2005;208(2):113–124. doi: 10.1007/s00232-005-0824-x. [DOI] [PubMed] [Google Scholar]
- 20.Lecoq J, Parpaleix A, Roussakis E, Ducros M, Houssen YG, Vinogradov SA, Charpak S. Simultaneous two-photon imaging of oxygen and blood flow in deep cerebral vessels. Nat Med. 2011;17(7):893–898. doi: 10.1038/nm.2394. [DOI] [PMC free article] [PubMed] [Google Scholar]
- 21.Lenkov DN, Volnova AB, Pope A, Tsytsarev V. Advantages and limitations of brain imaging methods in the research of absence epilepsy in humans and animal models. J Neurosci Methods. 2012;0270(12):00443–00448. doi: 10.1016/j.jneumeth.2012.10.018. [DOI] [PubMed] [Google Scholar]
- 22.Liao LD, Lin CT, Shih YY, Duong TQ, Lai HY, Wang PH, Wu R, Tsang S, Chang JY, Li ML, Chen YY. Transcranial imaging of functional cerebral hemodynamic changes in single blood vessels using in vivo photoacoustic microscopy. J Cereb Blood Flow Metab. 2012;32(6):938–951. doi: 10.1038/jcbfm.2012.42. [DOI] [PMC free article] [PubMed] [Google Scholar]
- 23.Liao LD, Lin CT, Shih YY, Lai HY, Zhao WT, Duong TQ, Chang JY, Chen YY, Li ML. Investigation of the cerebral hemodynamic response function in single blood vessels by functional photoacoustic microscopy. J Biomed Opt. 2010;17(6):061210. doi: 10.1117/1.JBO.17.6.061210. [DOI] [PMC free article] [PubMed] [Google Scholar]
- 24.Liao LD, Li ML, Lai HY, Shih YYI, Lo YC, Tsang S, Chao PCP, Lin CT, Jaw FS, Chen YY. Imaging brain hemodynamic changes during rat forepaw electrical stimulation using functional photoacoustic microscopy. NeuroImage. 2010;52(2):562–570. doi: 10.1016/j.neuroimage.2010.03.065. 15. [DOI] [PubMed] [Google Scholar]
- 25.Lutcke H, Murayama M, Hahn T, Margolis DJ, Astori S, Zum Alten Borgloh SM, Göbel W, Yang Y, Tang W, Kügler S, Sprengel R, Nagai T, Miyawaki A, Larkum ME, Helmchen F, Hasan MT. Optical recording of neuronal activity with a genetically-encoded calcium indicator in anesthetized and freely moving mice. Front Neural Circuits. 2010;4:9. doi: 10.3389/fncir.2010.00009. 29. [DOI] [PMC free article] [PubMed] [Google Scholar]
- 26.O'Connor DH, Peron SP, Huber D, Svoboda K. Neural activity in barrel cortex underlying vibrissa-based object localization in mice. Neuron. 2010;67(6):1048–1061. doi: 10.1016/j.neuron.2010.08.026. 23. [DOI] [PubMed] [Google Scholar]
- 27.Papkovsky DB, Zhdanov AV, Fercher A, Dmitriev RI. Phosphorescent Oxygen-Sensitive Probes, Springer Briefs. 2012 doi: 10.1021/ac3000144. [DOI] [PubMed] [Google Scholar]
- 28.Reinert KC, Dunbar RL, Gao W, Chen G, Ebner TJ. Flavoprotein autofluorescence imaging of neuronal activation in the cerebellar cortex in vivo. J Neurophysiol. 2004;92(1):199–211. doi: 10.1152/jn.01275.2003. [DOI] [PubMed] [Google Scholar]
- 29.Roche-Labarbe N, Zaaimi B, Mahmoudzadeh M, Osharina V, Wallois A, Nehlig A, Grebe R, Wallois F. NIRS-measured oxy- and deoxyhemoglobin changes associated with EEG spike-and-wave discharges in a genetic model of absence epilepsy: the GAERS. Epilepsia. 2010;51(8):1374–1384. doi: 10.1111/j.1528-1167.2010.02574.x. [DOI] [PubMed] [Google Scholar]
- 30.Sakadzic S, Roussakis E, Yaseen MA, Mandeville ET, Srinivasan VJ, Arai K, Ruvinskaya S, Devor A, Lo EH, Vinogradov SA, Boas DA. Two-photon high-resolution measurement of partial pressure of oxygen in cerebral vasculature and tissue. Nat Methods. 2010;7(9):755–759. doi: 10.1038/nmeth.1490. [DOI] [PMC free article] [PubMed] [Google Scholar]
- 31.Salzberg BM, Davila HV, Cohen LB. Optical recording of impulses in individual neurones of an invertebrate central nervous system. Nature. 1973;246(5434):508–509. doi: 10.1038/246508a0. [DOI] [PubMed] [Google Scholar]
- 32.Salzberg BM, Grinvald A, Cohen LB, Davila HV, Ross WN. Optical recording of neuronal activity in an invertebrate central nervous system: simultaneous monitoring of several neurons. J Neurophysiol. 1977;40(6):1281–1291. doi: 10.1152/jn.1977.40.6.1281. [DOI] [PubMed] [Google Scholar]
- 33.Schummers J, Yu H, Sur M. Tuned responses of astrocytes and their influence on hemodynamic signals in the visual cortex. Science. 2008;320:1638–1643. doi: 10.1126/science.1156120. [DOI] [PubMed] [Google Scholar]
- 34.Tsytsarev V, Pope D, Pumbo E, Yablonskii A, Hofmann M. Study of the cortical representation of whisker directional deflection using voltage-sensitive dye optical imaging. Neuroimage. 2010;53(1):233–238. doi: 10.1016/j.neuroimage.2010.06.022. [DOI] [PubMed] [Google Scholar]
- 35.Tsytsarev V, Fukuyama H, Pope D, Pumbo E, Kimura M. Optical imaging of interaural time difference representation in rat auditory cortex; Frontiers. Neuroengineering. 2009;2:1–7. doi: 10.3389/neuro.16.002.2009. [DOI] [PMC free article] [PubMed] [Google Scholar]
- 36.Tsytsarev V, Maslov KI, Yao J, Parameswar AR, Demchenko AV, Wang LV. In vivo imaging of epileptic activity using 2-NBDG, a fluorescent deoxyglucose analog. J Neurosci Methods. 2011;203:136–140. doi: 10.1016/j.jneumeth.2011.09.005. [DOI] [PMC free article] [PubMed] [Google Scholar]
- 37.Tsytsarev V, Hu S, Yao J, Maslov K, Barbour DL, Wang LV. Photoacoustic microscopy of microvascular responses to cortical electrical stimulation. J Biomed Opt. 2011;16:076002. doi: 10.1117/1.3594785. [DOI] [PMC free article] [PubMed] [Google Scholar]
- 38.Tsytsarev V, Premachandra K, Takeshita D, Bahar S. Imaging cortical electrical stimulation in vivo: fast intrinsic optical signal versus voltage-sensitive dyes. Opt Lett. 2008;33(9):1032–1034. doi: 10.1364/ol.33.001032. [DOI] [PubMed] [Google Scholar]
- 39.Wotzlaw C, Bernardini A, Berchner-Pfannschmidt U, Papkovsky D, Acker H, Fandrey J. Multifocal animated imaging of changes in cellular oxygen and calcium concentrations and membrane potential within the intact adult mouse carotid body ex vivo. Am J Physiol Cell Physiol. 2012;1(2):C266–C271. doi: 10.1152/ajpcell.00508.2010. [DOI] [PubMed] [Google Scholar]
- 40.Yao J, Xia J, Maslov KI, Nasiriavanaki M, Tsytsarev V, Demchenko AV, Wang LV. Noninvasive photoacoustic computed tomography of mouse brain metabolism in vivo. Neuroimage. 2012;64:257–266. doi: 10.1016/j.neuroimage.2012.08.054. [DOI] [PMC free article] [PubMed] [Google Scholar]
- 41.Wilson DF, Vinogradov SA, Schears GJ, Esipova TV, Pastuszko A. Monitoring cardiopulmonary function and progression toward shock: oxygen micro-sensor for peripheral tissue. Adv Exp Med Biol. 2012;737:221–227. doi: 10.1007/978-1-4614-1566-4_32. [DOI] [PMC free article] [PubMed] [Google Scholar]
- 42.Wilson DF, Vinogradov SA, Rozhkov V, Creed J, Rietveld I, Pastuszko A. Monitoring the dynamics of tissue oxygenation in vivo by phosphorescence quenching. Adv Exp Med Biol. 2003;540:1–5. doi: 10.1007/978-1-4757-6125-2_1. [DOI] [PubMed] [Google Scholar]
- 43.Zhdanov AV, Hynes J, Dmitriev R, Papkovsky DB. Phosphorescent Oxygensensitive Probes, Papkovsky DB, Zhdanov AV, Fercher A, Dmitriev RI, Hynes J, Springer Briefs in Biochemistry and Molecular Biology. 2012. O2 Analysis on a Fluorescence Spectrometer or Plate Reader; pp. 29–70. [Google Scholar]