Summary
Hemochromatosis is an iron overload disorder with age-dependent oxidative stress and dysfunction in a variety of tissues. Mutations in HFE are responsible for most cases with hemochromatosis. We recently demonstrated that Hfe is expressed exclusively in the basal membrane of retinal pigment epithelium (RPE). Here we used Hfe−/− mice to examine ferritin levels (an indirect readout for iron levels) and morphological changes in retina. We found increased ferritin accumulation in retina in 18-month-old but not in 2-month-old mice with considerable morphological damage compared to age-matched controls. The retinal phenotype included hypertrophy and hyperplasia of RPE. RPE cells isolated from Hfe−/− mice exhibited a hyperproliferative phenotype. We also compared the gene expression profile between wild type and Hfe−/− RPE cells by microarray analysis. These studies showed that many cell cycle-related genes were differentially regulated in Hfe−/− RPE cells. One of the genes upregulated in Hfe−/− RPE cells was Slc7a11 that codes for the ‘transporter proper’ xCT in the heterodimeric cystine/glutamate exchanger (xCT/4F2hc). This transporter plays a critical role in cellular glutathione status and cell cycle progression. We confirmed the microarrray data by monitoring xCT mRNA levels by RT-PCR and also by measuring transport function. We also found increased levels of glutathione and the transcription factor/cell cycle promoter AP1 in Hfe−/− RPE cells. Wild type mouse RPE cells and human RPE cell lines, when loaded with iron by exposure to ferric ammonium citrate, showed increased expression and activity of xCT, reproducing the biochemical phenotype observed with Hfe−/− RPE cells.
Keywords: hemochromatosis, retinal pigment epithelium, cell proliferation, cystine/glutamate exchanger, glutathione, transcription factor AP1
INTRODUCTION
Iron, though an essential nutrient, can provoke oxidative stress and cellular dysfunction when accumulated excessively in tissues. In recent years, we have been investigating the expression of various genes involved in the regulation of iron homeostasis in the retina to understand their role in retinal health and disease [1-3]. There is growing evidence that, as with other tissues, retina also is susceptible to iron-induced oxidative damage. Excess iron is found in retinas of patients with age-related macular degeneration [4, 5]. Patients with aceruloplasminemia also have retinal iron accumulation with associated macular degeneration [6]. Similarly, mice with disruption of two iron-oxidizing enzymes, ceruloplasmin and hephaestin, have excessive iron accumulation in RPE concomitant with retinopathy [7, 8]. These retinal effects of iron overload are notable given that the most common genetic disease in Caucasians is a disorder of iron metabolism known as hemochromatosis. Hemochromatosis leads to excess iron in various organs, including the liver, pancreas, kidney, heart, and brain [9-12]. This results in hepatocarcinoma/cirrhosis, diabetes, nephropathy, cardiomyopathy, and pituitary dysfunction. Most (>85%) cases of hemochromatosis are associated with mutations in HFE [Histocompatability leukocyte antigen class I-like protein involved in iron (FE) homeostasis]. The remaining mutations occur in hepcidin, hemojuvelin (HJV), ferroportin, and transferrin receptor 2 (TfR2), all of which are also important determinants of iron homeostasis.
There have been only two reports of retinal iron accumulation in hemochromatosis [13, 14]. It is widely believed that the blood-retinal barrier protects the retina from the consequences of systemic iron overload. A similar notion persisted for a number of years with respect to brain as a potential target for iron overload in hemochromatosis because of the blood-brain barrier, but there is now convincing evidence of neuropathological changes in hemochromatosis due to excessive iron accumulation in the brain [15-18]. Another reason for the lack of attention to retina as a target organ for pathological changes in hemochromatosis was that until recently when it was reported that ferroportin was expressed in the retina [19], there was no evidence for the expression of any of the hemochromatosis-related genes in this tissue. It is now known that retina expresses all five genes involved in hemochromatosis [1-3]. Hfe is expressed predominantly in the retinal pigment epithelium (RPE) where its expression is restricted exclusively to the basolateral membrane [1]. Hepcidin is expressed in RPE, Müller cells, and photoreceptor cells [2]. Expression of HJV is evident in RPE, Muller cells, photoreceptor cells, as well as in retinal ganglion cells [3]. In RPE, the expression of HJV is restricted to the apical membrane. TfR2 is expressed throughout the retina [2]. Here we used Hfe−/− mice to study the potential involvement of retina as a target organ for iron overload in hemochromatosis.
MATERIALS AND METHODS
Animals
Breeding pairs of Hfe+/− mice were obtained from the Jackson Laboratory (Bar Harbor, ME, USA). Genotyping was done to identify wild type, heterozygous (Hfe+/−), and homozygous (Hfe−/−) mice in the litters. Age-matched wild type and Hfe−/− mice were selected for comparison studies. All experimental procedures involving these animals adhered to the “Principles of Laboratory Animal Care” (National Institutes of Health publication #85-23, revised in 1985) and were approved by the Institutional Committee for Animal Use in Research and Education.
Preparation of eye sections
Mice were killed by CO2 asphyxiation followed by cervical dislocation. Eyes were enucleated and oriented in OCT so that the 10-μm-thick sections included a full length of retina approximately along the horizontal meridian, passing through the ora serrata and the optic nerve in both the temporal and nasal hemispheres. After slow freezing, the cryosections were prepared and mounted on slides (Superfrost; Fisher Scientific, Pittsburgh, PA, USA).
Electron microscopy
Eyes were enucleated and fixed for 1 h at room temperature in 2% paraformaldehyde/0.2% glutaraldehyde in 0.1 M cacodylate buffer in sucrose and post-fixed for 1 h with 1% tannic acid in 0.1 M sodium cacodylate buffer as described previously [20]. Tissues were washed in water, dehydrated using a graded series of ethanol, and infiltrated with resin (LR White; Structure Probe, Inc.). Thin sections (60 nm) of the retinal tissue were collected on nickel grids and viewed with a transmission electron microscope (JEM-1010; JEOL, Tokyo, Japan).
Immunofluorescence analysis
Cryosections of eyes were fixed in 4% paraformaldehyde for 10 min, washed with 0.01 M phosphate-buffered saline (pH 7.4), and blocked with 1x blocking agent (PowerBlock; Biogenex, San Ramon, CA, USA) for 1 h. Sections were incubated overnight at 4°C with polyclonal antibodies specific for H-ferritin (1:2000) and L-ferritin (1:2000). These antibodies were a generous gift from Dr. Paolo Arosio, University of Brescia, Brescia, Italy. Negative control sections were treated identically but in the absence of the primary antibodies. Sections were rinsed and incubated for 1 h with goat anti-rabbit IgG coupled to Alexa Fluor 555 (Molecular Probes, Carlsbad, CA, USA) at a dilution of 1:1000. Coverslips were mounted in medium with the nuclear stain 4′,6-diamidino-2-phenylindole (DAPI), and sections were examined with a wide-field epifluorescence microscope (Carl Zeiss Meditec, Oberkochen, Germany). In some cases, laser-scanning confocal microscopy was also used for analysis.
ELISA for determination of ferritin levels
Mouse ferritin ELISA kit (Kamiya Biomedical Company, Seattle, WA, USA) was used for quantification of ferritin levels in wild type and Hfe−/− mouse sera, retinas, and RPE cells. The absorbance of the final reaction mixture was measured at 450 nm. A calibration curve was used as instructed in the kit to determine the ferritin levels in these samples.
Establishment of RPE cell cultures
Age-matched (3-week-old) wild type and Hfe−/− mice were used to establish cultures of RPE [2, 3]. Purity of the cultures was verified as described previously by immunodetection of RPE65, a known marker for RPE cells [21].
Colony formation assay/Giemsa staining
This was done as described previously [22]. Wild type and Hfe−/− RPE cells were trypsinized and seeded in 6-well plates. Different cell numbers were seeded ranging from 2,000 to 16,000 cells per well in triplicates. For time course, 10,000 cells per well were seeded and then cultured for 2, 4, 8 and 12 days. Medium was changed every 2 days. Cells were washed with phosphate-buffered saline and fixed in 100% methanol for 30 min followed by staining with KaryoMax Giemsa stain for 1 h. Excess stain was washed away with water, and stained cells were dried overnight at room temperature. The contents of the wells were then dissolved in 1% SDS/0.2 N NaOH for 1 h, and the absorbance of the released dye was measured at 630 nm.
MTT assay
Cells were seeded in 96-well plates and cultured for 72 h with fresh medium supplied every 24 h. Cells were washed with phosphate-buffered saline twice followed by MTT reagent (ATCC). Treatment and lysis of the cells were done as per the manufacturer's instructions. Absorbance of the lysate was measured at 550 nm.
[3H]-Thymidine incorporation assay
Cells were plated at a density of 10,000 cells per well in 24-well plates, and grown for 24 h in serum-containing medium. Cells were then serum-starved for 48 h and then [3H]-thymidine (1 μCi per well; Amersham Biosciences, Piscataway, NJ, USA) was added to the wells and incubated for 12 h. The cells were then washed twice with 5% trichloroacetic acid, the resultant precipitate was solubilized in 0.1M NaOH, and the radioactivity was measured.
DNA microarray analysis
Genome-scale gene expression was carried out using DNA microarray as described [23]. RNA was isolated from wild type and Hfe−/− RPE cells using TRIzol (Invitrogen, Grand Island, NY, USA). cDNA probes were synthesized using the FairPlay microarray labeling kit (Stratagene, La Jolla, CA, USA). The cDNA probes were then labeled with Cy3 or Cy5 monofunctional reactive dye (GE Healthcare, Piscataway, NJ, USA). The appropriate Cy3- and Cy5-labeled probes were combined and used to probe the processed National Cancer Institute mouse oligo microarray slides (~36,000 sequences of transcripts). Fluorescence images were captured using a Genepix 4000 (Axon Instruments, Union City, CA, USA). Both image and signal intensity data were loaded into a database supported by the Center for Information Technology (CIT) of the National Institutes of Health. Cy3:Cy5 intensity ratios for each gene were calculated and subsequently normalized to ratios of overall signal intensity from the corresponding channel in each hybridization. The normalized data were then extracted from the database as text files, and analyzed using computer software JMP (SAS Institute, Cary, NC, USA).
Reverse transcriptase-PCR
RNA was isolated from wild type and Hfe−/− RPE cells and used for RT-PCR using GeneAmp RT-PCR kit (Applied Biosystems, Inc., Foster City, CA, USA). The following primers were used: xCT upstream primer 5′-AAGTGGTTCAGACGATTATCAG-3′ and downstream primer 5′-AAGAAACGTGGTAGAGGAATG-3′ yield a 393-bp product; 4F2hc upstream primer 5′-CTCCCAGGAAGATTTTAAAGACCTTCT-3′ and downstream primer 5′-TTCATTTTGGTGGCTACAATGTCAG-3′ yield a 141-bp product; c-Fos upstream primer 5′-AGCCGACTCCTTCTCCAGCA-3′ and downstream primer 5′-ATTCCGGCACTTGGCTGCAG-3′ yield a 369-bp product; c-Jun upstream primer 5′-ACTCGGACCTTCTCACGTCG-3′ and downstream primer 5′-TAGACCGGAGGCTCACTGTG-3′ yield a 331-bp product. Mouse HPRT1 primers were used as an internal control. PCR was performed using Taq polymerase kit (TaKaRa, Tokyo, Japan) for 30 cycles with a denaturing phase of 1 min at 94°C, an annealing phase of 1 min at 55°C, and an extension phase of 1 min at 72°C for all the primer sets.
Assay of system xc− transport activity
The heterodimeric amino acid transporter xCT/4F2hc is responsible for the activity of the amino acid transport system known as xc−. It is a Na+-independent system that mediates the cellular entry of cystine in exchange for intracellular glutamate under physiological conditions. However, we routinely measure the activity of this transporter by cellular uptake of [3H]-glutamate under Na+-free conditions [24, 25]. Under these conditions, xc− mediates the cellular entry of [3H]-glutamate in exchange for intracellular unlabeled glutamate. Transport activity was measured using a Na+-free uptake buffer (25 mM Hepes/Tris, 140 mM N-methyl-D-glucamine chloride, 5.4 mM KCl, 1.8 mM CaCl2, 0.8 mM MgSO4, and 5 mM glucose, pH 7.5). L-[G-3H]-glutamic acid (specific radioactivity: 43 Ci/mmol, GE Healthcare, Piscataway, NJ, USA) was used as the substrate. Uptake was initiated by the addition of 250 μl uptake buffer containing 2.5 μM glutamate spiked with 2 μCi/ml [3H]-glutamate. Cells were incubated for 15 min at 37°C, after which time, the buffer was removed, and the cells were washed twice with ice-cold uptake buffer. The cells were solubilized with 0.5 ml 1% SDS/0.2 N NaOH, and radioactivity was determined. Protein was measured using the Bio-Rad protein assay reagent. Non-carrier-mediated uptake (i.e, diffusional component) was determined by measuring the uptake of [3H]-glutamate in the presence of excess unlabeled glutamate (5 mM). The transport activity of xc− was calculated by subtracting the diffusional component from total uptake. Kinetic analysis of system xc− was performed by measuring the transport activity over a wide range of glutamate concentrations (2.5 – 1000 μM) and by analyzing the data according to the Michaelis-Menten equation describing a single saturable transport system. Kt and Vmax were calculated by non-linear regression method and then confirmed by linear regression method.
Treatment of RPE cells with ferric ammonium citrate
RPE cells were seeded in 24-well culture plates and cultured for 24 h. Fresh culture medium was then added to cells with or without ferric ammonium citrate (100 μg/ml), and the cells were cultured for an additional 72 h. Cells were then used for RNA extraction and uptake measurements.
Glutathione assay
Glutathione in wild type and Hfe−/− RPE cells was measured using Glutathione detection kit (Chemicon International, Temecula, CA, USA). Wild type and Hfe−/− RPE cells were cultured for 5 days in 75-cm2 flasks to reach confluence. The cells were then suspended using trypsin, and counted. 2×10⁶ cells from each group were suspended in 0.5 ml of lysis buffer and incubated on ice for 10 min. The suspensions were centrifuged at 12,000 ×g for 10 min and the supernatants were collected. Aliquots of supernatants (90 μl/well) were dispersed in a 96-well plate, and 10 μl of monochlorobimane solution was added to each well and mixed. The plate was incubated for 2 h at room temperature protected from light, and fluorescence was measured using a 360/465 nm filter set in a fluorometer.
Statistical analysis
Unpaired Student's t test was used to determine statistical significance. A p < 0.05 was considered statistically significant. The number of replicates in each experiment is given in respective figure legends.
RESULTS
Age-dependent morphological changes in the retina in Hfe−/− mice
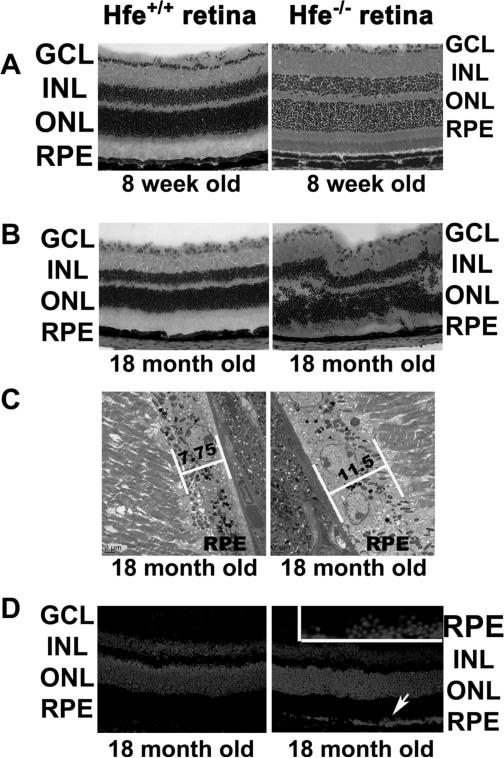
To analyze the function of Hfe in retina, retinas from Hfe−/− mice of different ages were compared with retinas from age-matched wild type mice. We found evidence of morphological changes in the retina in Hfe−/− mice at 18 months of age; such changes were not evident in 8-week-old mice (Fig. 1A & B). We also examined the retinas from wild type and Hfe−/− mice at 4 and 12 weeks of age (2 mice for each age); there was no evidence of morphological disruption in Hfe−/− mice at these ages (data not shown). The morphological changes evident in 18-month-old Hfe−/− mice include significant loss of ganglion cells, uneven distribution of nuclei in the inner nuclear layer with some of the displaced nuclei appearing in the inner plexiform layer, and uneven distribution of nuclei in the outer nuclear layer with displaced photoreceptor nuclei appearing in the outer plexiform layer as well as in the region of photoreceptor inner and outer segments (Fig. 1B). These changes observed in Hfe−/− mice at 18 months of age were highly reproducible (n = 5).
Figure 1. Morphological changes in Hfe−/− retina.
(A) Hematoxylin and eosin stained wild type and Hfe−/− retinas from 8-week-old mice. (B) Hematoxylin and eosin stained wild type and Hfe−/− retinas from 18-month-old mice. (C) Electron microscopic analysis of RPE from 18-month-old wild type and Hfe−/− retinas. (D) Nuclear stained (DAPI) retinal sections of 18-month-old wild type and Hfe−/− retinas as analyzed by laser-scanning confocal microscopy. Inset is a higher magnification of the RPE cell layer showing characteristic hyperplasia. A total of 5 mice each for wild type and Hfe−/− genotype were used for the 18-month age group with similar results. GCL, ganglion cell layer; INL, inner nuclear layer; ONL, outer nuclear layer; RPE, retinal pigment epithelium.
Excessive retinal iron accumulation in ceruloplasmin/hephaestin double-knockout mice is associated with RPE hypertrophy and hyperplasia [8]. We examined the retinas of Hfe−/− mice (18-month-old) by electron microscopy looking for evidence of changes in RPE similar to those found in the ceruloplasmin/hephaestin double-knockout mice. Retinas from age-matched wild type mice were used for comparison. Hypertrophic RPE cells were evident in most of the retina. Representative sections are shown in Fig. 1C. The average height of the RPE cell layer in wild type mouse retina was 7.75 μm; this value was increased significantly in Hfe−/− mouse retina (11.5 μm). There were also focal areas of RPE hyperplasia in Hfe−/− mouse retina as evidenced by the presence of multinucleated regions in the RPE cell layer when examined by laser-scanning confocal microscopy with the nuclear stain DAPI (Fig. 1D). These data provide evidence of RPE hypertrophy and hyperplasia in Hfe−/− mice at 18 months of age. We did not find these changes in RPE cell layer in Hfe−/− mouse retina at 6 months of age, indicating that changes in RPE/retinal morphology in this mouse model is an age-dependent phenomenon.
Ferritin levels in Hfe−/− mouse retina
The levels of cytosolic iron storage protein ferritin are regulated by intracellular iron through the iron-regulatory proteins IRP1 and IRP2 (iron-regulatory proteins 1 and 2). Increase in intracellular iron enhances translation of ferritin mRNA, resulting in increased ferritin protein levels [26, 27]. Ferritin is a 24-subunit protein complex composed of heavy (H) and light (L) chains. To determine whether the retinal morphological changes observed in 18-month-old Hfe−/− mice are accompanied by increased iron accumulation, retinas were immunolabeled with anti-H-ferritin and anti-L-ferritin (n = 4 for each age group). H- and L-ferritin staining was more intense in 18-month-old Hfe−/− mouse retinas than in age-matched wild type mouse retinas (data not shown). Both H- and L-ferritin were present in photoreceptors, including their inner segments, in the outer and inner plexiform layers, and RPE of 18-month-old Hfe−/− mouse retinas. Such changes were not observed in 8-week-old Hfe−/− mouse retinas compared to age-matched wild type mouse retinas. In addition to this age-dependent ferritin accumulation in Hfe−/− mouse retinas compared to wild type mouse retinas, the H- and L-ferritin staining was significantly greater in 18-month-old wild type mouse retinas compared to 8-week-old mouse retinas of the same genotype.
We then quantified ferritin levels by ELISA using serum samples, retinal tissues, and RPE cells prepared from 18-month-old Hfe−/− mice and age-matched wild type mice (Fig. 2). There was a significant increase in ferritin levels in Hfe−/− mice compared to control mice; the increase was evident in serum (2.4-fold; p < 0.001), retina (2.5-fold; p < 0.001), and RPE (2.0-fold; p < 0.05). IRPs also regulate the levels of TfR1, but by a mechanism different from that involved in the regulation of ferritin levels. Increased cellular iron decreases the expression of TfR1 by influencing the stability of TfR1 mRNA. To complement the findings with ferritin, we monitored the steady-state levels of TfR1 mRNA by RT-PCR in 18-month-old Hfe−/− mouse retinas and in age-matched wild type mouse retinas. The levels of TfR1 mRNA were significantly lower in Hfe−/− mouse retinas than in control mouse retinas (data not shown). Thus, the observed changes in ferritin levels and TfR1 mRNA levels in Hfe−/− mouse retinas strongly indicate that deletion of Hfe leads to excessive accumulation of iron in retina.
Figure 2. Ferritin accumulation in Hfe−/− mouse serum, retina, and RPE.
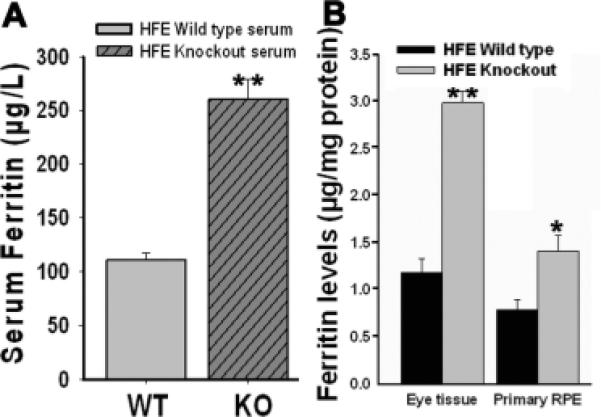
Ferritin levels were determined by ELISA. (A) Ferritin levels in sera (n = 4) obtained from 18-month-old wild type mice and age-matched Hfe−/− mice. (B) Ferritin levels in retinal tissues (n = 6) and RPE cell preparations (n = 4) obtained from 18-month-old wild type mice and age-matched Hfe−/− mice. *, p < 0.05; **, p < 0.001.
Hyperproliferation of Hfe−/− RPE cells
Since Hfe−/− retinas showed evidence of RPE hyperplasia, we isolated RPE cells from wild type and Hfe−/− mouse retinas and examined their growth and proliferation pattern. We noticed that Hfe−/− RPE cells proliferated faster and reached confluence quicker than wild type RPE cells. We also observed that Hfe−/− RPE cells stayed viable for significantly greater number of passages than the wild type RPE cells. These observations indicated that Hfe−/− RPE cells exhibit a hyperproliferative phenotype and senesce at a slower rate compared to wild type RPE cells. First, we used a colony formation assay in which we quantified cell multiplication using Giemsa staining. Fig. 3A describes the results in triplicates with two different starting cell density. Fig. 3B is a quantitative representation of the colony formation assay by measuring the optical density of the Giemsa staining after culture for 12 days with initial seeding of varying cell density (cells/dish). Fig. 3C compares the proliferation of wild type and Hfe−/− RPE cells with varying periods of culture time with an initial seeding of 16,000 cells/dish. In all cases, the proliferation rate of Hfe−/− RPE cells was significantly greater than that of wild type RPE cells (p < 0.001). This experimental approach was complemented with MTT assay (Fig. 4A) and thymidine incorporation (Fig. 4B). MTT assay monitors mitochondrial function and hence is a quantitative measure of the number of live cells. It uses the dye MTT [3-(4,5-Dimethylthiazol-2-yl)-2,5-diphenyl tetrazolium bromide], which is converted into a purple-colored product in the mitochondria of live cells. Thymidine incorporation is a measure of DNA synthesis and hence cell proliferation. In both cases, we found that Hfe−/− RPE cells proliferate at almost double the rate compared to wild type RPE cells (p < 0.001).
Figure 3. Cell proliferation in wild type and Hfe−/− RPE cells.
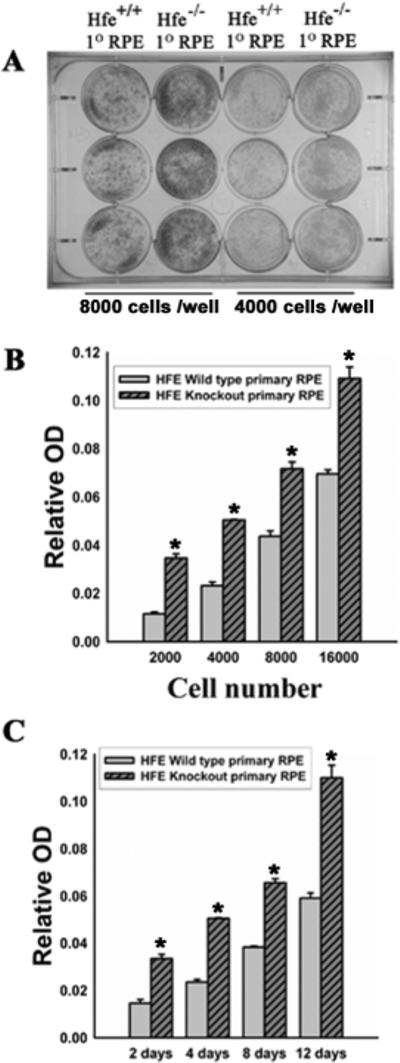
(A) Giemsa staining or colony formation assay in a 12-well plate for wild type and Hfe−/− RPE cells. 8,000 cells per well (left two columns) or 4000 cells per well (right two columns) were seeded in triplicates. The cells were cultured for 12 days, with medium change every 2 days. Cells were then fixed with methanol for 30 min followed by staining with KayroMax Giemsa for 1 h. (B) Wild type and Hfe−/− RPE cells were seeded at varying cell density in a 12-well plate and cultured for 12 days. Medium was changed every 2 days. On the 12th day, cells were fixed with methanol and than stained with KayroMax Giemsa. The contents of the wells were solubilized and the dye released was quantified. n = 6; *, p < 0.001. (C) Wild type and Hfe−/− RPE cells were seeded at a density of 10,000 cells per well and cultured for varying time periods. At the end of the indicated time period, cells were stained with Giemsa, and the dye quantified as described above. n = 6; *, p < 0.001.
Figure 4. Hyperproliferation of Hfe−/− RPE cells.
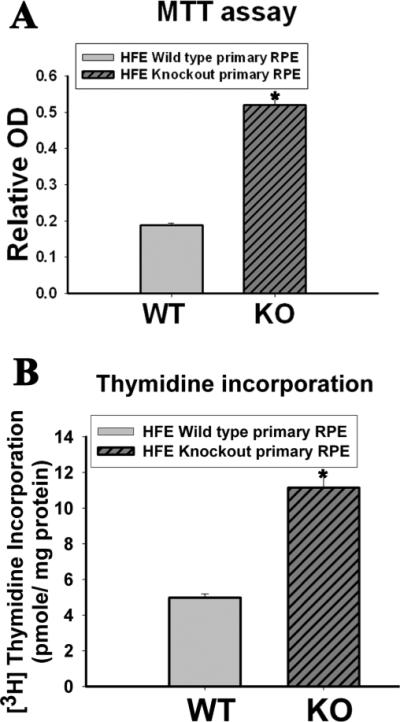
(A) MTT assay to determine hyperproliferation of Hfe−/− (KO) primary RPE cells compared to wild type (WT) cells. n = 12; *, p < 0.001. (B) [3H]-Thymidine incorporation assay with wild type and Hfe−/− RPE cells. n = 14; *, p < 0.001.
Microarray analysis of wild type versus Hfe−/− RPE cells
Microarray analysis was done using RNA from wild type and Hfe−/− RPE cells to identify the genes whose expression is affected in RPE cells by Hfe deletion. The expression of approximately ~2500 genes was found to be altered at least 2-fold in Hfe−/− cells compared to wild type cells. We focused on the genes that are relevant to cell cycle regulation (Supplemental Table I and Table II). Included in the list of genes that are upregulated in Hfe−/− RPE cells are those coding for cyclins and cell division cycle homologs which control cell cycle, centromere proteins which control kinetochore and mitotic progression, several oncogenes which are involved in cellular transformation, and thymidine kinase which promotes cell proliferation. Included among the genes that are downregulated in Hfe−/− RPE cells are those coding for proteins that negatively regulate cell proliferation (e.g., cyclin-dependent kinase inhibitors, C/ebpβ, PARP 3, Angptl4, Btg1, complement 2) as well as several tumor suppressors (e.g., Hic1, St5). We also focused on plasma membrane transporters that are differentially regulated in Hfe−/− RPE cells. Among the transporters that are upregulated in Hfe−/− RPE cells are the urea transporter Slc14a1, monocarboxylate transporter Slc16a7, zinc transporter family member Slc30a8, sodium-bicarbonate cotransporter Slc4a4, and cystine/glutamate exchanger Slc7a11. Among the transporters that are downregulated in Hfe−/− RPE cells are the divalent metal ion transporter Slc11a2, urate transporter Slc22a12, zinc transporter family members Slc39a13 and Slc39a14, and the amino acid transporter family members Slc1a5, Slc38a7, Slc43a3, and Slc6a9.
Upregulation of xCT mRNA and protein in Hfe−/− RPE cells
The precise role of many of the transporters, listed in Supplemental Table I and Table II, in cell proliferation is not known, but several recent studies have implicated the cystine/glutamate exchanger in cell cycle progression [30-33]. Modulation of cellular glutathione status underlies the stimulation of cell proliferation by this transporter [28-30]. Slc7a11 codes for the ‘transporter proper’ subunit xCT in the heterodimeric amino acid transport system xc− that mediates the cellular uptake of cystine coupled with the efflux of glutamate. The other subunit is 4F2hc that functions as a chaperone for xCT for optimal recruitment into the plasma membrane. Since cellular cysteine is the rate-limiting factor for glutathione systhesis, xc− is one of the key determinants of cellular glutathione status. Microarray data showed that the expression of Slc7a11 was upregulated ~4.5 fold times in Hfe−/− RPE cells. To confirm the microarray data, RT-PCR was done for xCT and 4F2hc with RNA from wild type and Hfe−/− RPE cells. RT-PCR confirmed the microarray data showing that xCT mRNA expression was higher in Hfe−/− RPE cells whereas the 4F2hc levels remained unchanged (Fig. 5).
Figure 5. Upregulation of xCT mRNA in Hfe−/− RPE cells.
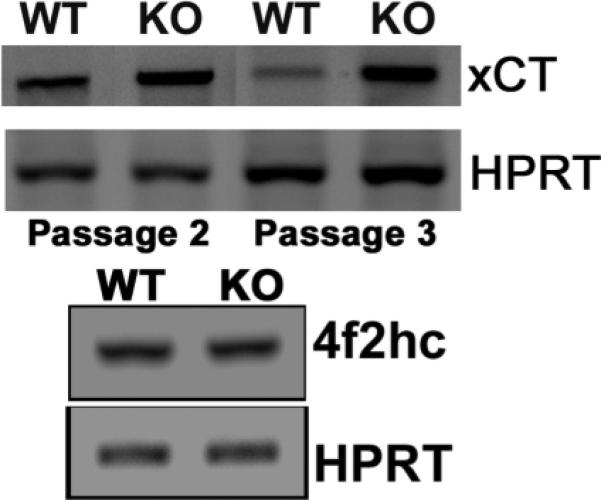
RT-PCR analysis of mRNA transcripts specific for xCT and 4F2hc in wild type and Hfe−/− RPE cells. HPRT1 was used as an internal control.
Functional activity of system xc− in wild type and Hfe−/− RPE cells
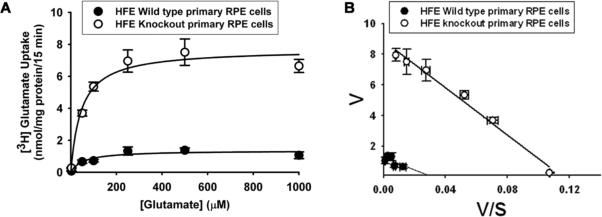
To obtain functional evidence for the increase in the expression of Slc7a11 in Hfe−/− RPE cels, we compared the activity of system xc− in wild type and Hfe−/− RPE cells. The Na+-independent glutamate uptake was ~3-fold higher in Hfe−/− RPE cells than in wild type RPE cells (Fig. 6A). To confirm that the observed glutamate uptake occurred via system xc−, we performed substrate selectivity studies (Fig. 6B). Uptake of [3H]-glutamate in wild type and Hfe−/− RPE cells was inhibited by unlabeled glutamate and cystine, but not by valine and aspartate. This mirrors the substrate specificity of system xc−, strongly suggesting that the observed uptake of glutamate in RPE cells occurred principally via system xc−.
Figure 6. Upregulation of system xc− activity in Hfe−/− RPE cells.
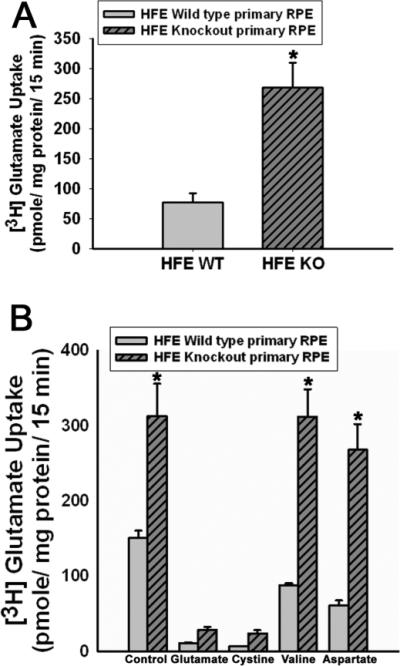
(A) Uptake of glutamate in wild type and Hfe−/− RPE cells. Uptake of [3H]-glutamate (2.5 μM) was measured for 15 min in control and Hfe−/− cells at 37°C in the absence of Na+. The values represent transport activity specific for system xc−. n = 9; *, p < 0.001. (B) Substrate selectivity of glutamate uptake in wild type and Hfe−/− RPE cells. Uptake of [3H]-glutamate (2.5 μM) was measured in wild type and Hfe−/− RPE cells in the absence of Na+ for 15 min at 37°C in the absence or presence of unlabeled amino acids glutamate, cystine, valine and aspartate, each at a concentration of 1 mM. n = 6; *, p < 0.001.
Kinetic analysis of system xc− in wild type and Hfe−/− RPE cells
The transport function of system xc− was monitored by measuring the Na+–independent uptake of glutamate over a concentration range of 2.5 – 1000 μM. The uptake process was saturable in wild type RPE cells as well as in Hfe−/− RPE cells. The increase in the transport activity of system xc− observed in Hfe−/− RPE cells compared with control cells was associated with an increase in the maximal velocity of the transport system with no significant change in substrate affinity (Fig. 7). The maximal velocity was 4.3–fold greater in Hfe−/− RPE cells than in control cells (7.8 ± 0.4 vs 1.8 ± 0.2 nmol/mg of protein/15 min; p < 0.001). The values for Michaelis constant in both cell types were comparable (46 ± 13 versus 53 ± 23 μM; p >0.05).
Figure 7. Kinetic analysis of system xc− in wild type and Hfe−/− RPE cells.
(A) Saturation kinetics of glutamate uptake in wild type and Hfe−/− RPE cells was evaluated by monitoring the uptake in a Na+-free medium with varying concentrations of glutamate. (B) Eadie-Hofstee transformation of the data. The experiment was repeated three times.
Glutathione levels in wild type and Hfe−/− RPE cells
Given that system xc− is an important determinant of cellular glutathione status via its participation in the supply of the rate-limiting amino acid cysteine in the form of cystine, we asked whether the enhanced activity of this transport system in Hfe−/− RPE cells influences glutathione status. To address this question, we measured cellular glutathione levels in wild type and Hfe−/− RPE cells. We found a significant increase in cellular levels of glutathione in Hfe−/− cells compared with wild type cells (Fig 8A; p < 0.001). These data suggest that increased activity of system xc− contributes to an increase in glutathione levels in Hfe−/− RPE cells.
Figure 8. Elevation of glutathione levels and upregulation of AP1 expression in Hfe−/− RPE cells.
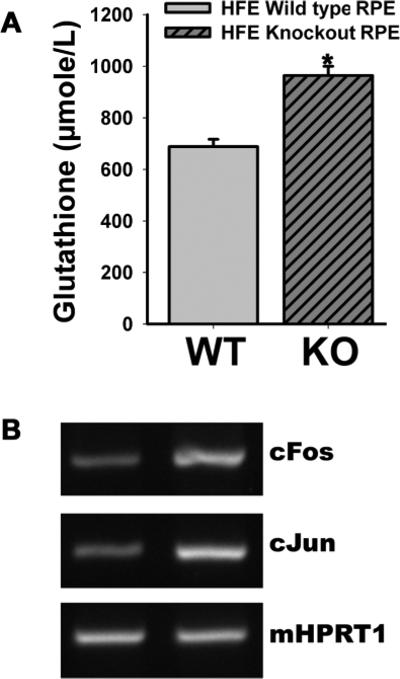
(A) Cellular content of glutathione was measured in wild type and Hfe−/− RPE cells. n = 10; *, p < 0.001. (B) RT-PCR analysis of c-Fos and c-Jun mRNA levels in wild type and Hfe−/− RPE cells. HPRT1 was used as an internal control.
Expression of c-Jun and c-Fos in wild type and Hfe−/− RPE cells
AP1, a transcription factor consisting of c-Jun and c-Fos, is upregulated in cells with increased activity of system xc− and elevated levels of cellular glutathione; the increase in AP1 expression contributes to increased cell proliferation [29, 30]. Therefore, we monitored the expression of c-Jun and c-Fos in wild type and Hfe−/− RPE cells by RT-PCR. We found that the expression of both AP1 components was increased significantly in Hfe−/− RPE cells compared with wild type cells (Fig. 8B).
Influence of ferric ammonium citrate on the expression and activity of xCT in wild type RPE cells
To determine directly the influence of cellular iron status on the expression and activity of xCT in RPE cells, we exposed wild type mouse RPE cells as well as two different human RPE cell lines (ARPE-19 and HRPE) to ferric ammonium citrate (100 μg/ml) for 72 h to increase cellular iron levels. Following the treatment, we monitored the steady-state levels of xCT mRNA by RT-PCR. In each case, exposure to ferric ammonium citrate increased the levels of xCT mRNA (Fig. 9A). We also monitored the activity of xc− in ARPE-19 cells (Fig. 9B). The activity of the transport system increased 5-fold as a result of exposure to ferric ammonium citrate.
Figure 9. Influence of ferric ammonium citrate (FAC) on the expression and activity of xCT in wild type mouse RPE cells and in two different human RPE cell lines (ARPE-19 and HRPE).
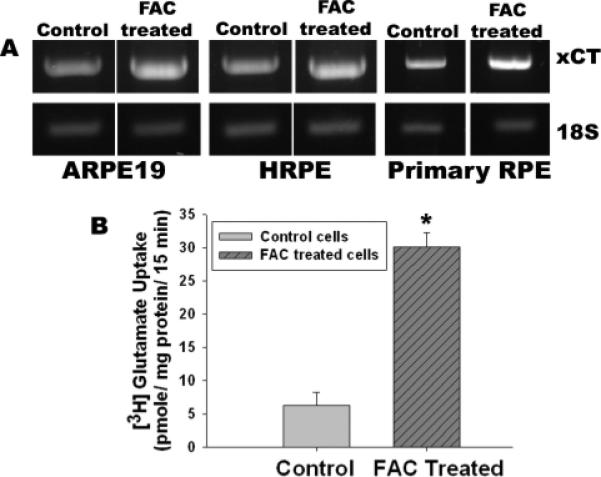
(A) Cells were treated with or without ferric ammonium citrate (100 μg/ml) for 72 h. RNA was isolated from these cells and used for RT-PCR. (B) xc− -specific transport activity in ARPE-19 cells with and without exposure to ferric ammonium citrate. n = 3; *, p < 0.001.
DISCUSSION
Recent studies have shown that all five genes associated with hemochromatosis are expressed in the retina [1-3, 19]. Therefore, it seems reasonable that the disease involves retina as a target organ for excessive iron accumulation. Here we show for the first time that there are noticeable morphological changes in the retina in the mouse model of hemochromatosis (Hfe−/− mouse). These changes include decreased number of cells in the ganglion cell layer and disruption of the inner and outer nuclear layers. We also provide evidence of hypertrophy and hyperplasia in the RPE cell layer. The morphological changes observed in the entire retina are somewhat surprising because Hfe, the gene deleted in the mouse model, is expressed almost exclusively in RPE. These data suggest that disruption of iron handling in this cell layer affects not only RPE but also the rest of the retina. This is corroborated with the findings that ferritin levels are elevated and TfR1 mRNA levels are decreased in retinas from Hfe−/− mice. RPE constitutes the outer retinal-blood barrier separating the retina from the choroidal blood circulation. We hypothesize that Hfe, expressed on the choroid-facing basolateral membrane of RPE, controls the transcellular iron movement across the cell layer, and that deletion of this gene leads to disruption of iron handling by RPE, leading to excessive iron accumulation in all cell types in the retina. We cannot however rule out a possible role for the inner retinal-blood barrier that consists of endothelial cells of the retinal blood vessels. Even though these cells do not express Hfe, they express TfR1 that mediates the cellular uptake of iron in the form of transferrin. Hemochromatosis is associated with increased transferrin saturation in systemic circulation. This might enhance iron delivery to inner retina through TfR1, thus contributing to increased iron accumulation throughout the retina. Whether the morphological changes observed in the retina are associated with detectable changes in retinal function remains to be seen.
It is important to note that the retinal changes seen in 18-month-old Hfe−/− mice are not evident in younger mice of the same genotype. This recapitulates what is known in patients with hemochromatosis in terms of iron accumulation in systemic organs. Iron overload and consequent functional disruption in systemic organs are not evident in hemochromatosis patients until ~50 years of age. The same seems to the case for the retinal involvement in the mouse model. In addition to the disruption of retinal morphology, we found evidence of hypertrophy and hyperplasia in the RPE cell layer. The changes observed in the retinal pigment epithelium and the rest of the retina in the mouse model of hemochromatosis may have relevance to age-related macular degeneration (AMD). AMD is a major cause of gradual, painless, and bilateral loss of central vision in elderly people [31-33]. There is overwhelming evidence in support of a genetic component in the etiology of AMD [33, 34]. Several genes have been identified either as the cause of the disease or contributors to the disease-associated retinal pathology, but still the etiology of the disease in most cases remains unknown. Since AMD occurs only in the elderly, and oxidation-induced cellular damage is increased with advancing age, there has been a lot of interest in the possible contribution of oxidative stress to the etiology of AMD [35]. These findings formed the basis for the National Eye Institute's support for the Age-Related Eye Disease Study for the evaluation of the efficacy of antioxidant supplements in the prevention and treatment of AMD [36]. The available evidence for a role of oxidative stress in the etiology of AMD is convincing, but the relevance of genetic factors in this process is far from clear. Irrespective of the genetic factors, patients with AMD show evidence of excessive iron accumulation in retina [4, 5]. Our findings in the hemochromatosis mouse model suggest that mutations in HFE causing hemochromatosis in humans may have a role in the etiology and/or progression of AMD. Iron is a pro-oxidant, and increased concentration of free iron in cells causes oxidative stress. The primary mechanism underlying the iron-dependent oxidative stress is the Fenton reaction in which Fe2+ mediates the conversion of hydrogen peroxide into highly reactive hydroxyl radical. The iron-induced oxidative damage is responsible for the functional defects in various organs such as the liver, heart, and pancreas that accumulate iron in patients with hemochromatosis. Published reports on patients with hemochromatosis [13, 14] and our studies with Hfe−/− mice (present study) show that iron accumulates in the retina in this disease, raising the possibility that mutations in HFE may play a significant role in the initiation and/or progression of retinal pathology seen in AMD. The emerging evidence for the involvement of excessive iron in AMD strongly suggests that systematic studies to investigate the potential association between hemochromatosis and AMD are warranted.
Iron accumulation in the retina observed in the ceruloplasmin/hephaestin double-knockout mouse is associated with hypertrophy and hyperplasia of RPE [8]. We observed a similar phenomenon in the hemochromatosis mouse. These findings indicate that excessive iron accumulation underlies the cellular and growth pattern changes seen in RPE. Interestingly, the hyperplasia phenotype of RPE observed in situ in intact retina of Hfe−/− mouse is also seen with RPE cell cultures established from Hfe−/− mouse retinas. Another important and interesting difference between the RPE cells from the wild type and Hfe−/− mouse retinas is in the viability of the cells during multiple passages. Hfe−/− RPE cells stay viable for at least 10 passages whereas wild type cells senesce within 4 passages. To understand the molecular processes responsible for the hyperproliferative phenotype of Hfe−/− RPE cells, we compared the gene expression pattern between wild type mouse RPE cells and Hfe−/− RPE cells by microarray analysis. These studies identified ~ 2,500 genes with differential expression in Hfe−/− RPE cells, many of which are related to cell cycle progression and cell proliferation. Several genes that are involved in the facilitation of cell cycle progression are upregulated in Hfe−/− RPE cells; in contrast, several genes that suppress cell cycle progression are downregulated. Among the various plasma membrane transporters that were regulated differentially in Hfe−/− RPE cells, Slc7a11 caught our attention because this transporter has been documented to play a critical role in cell proliferation [28-30]. Since the expression of this transporter is upregulated in Hfe−/− RPE cells suggesting that cystine uptake and glutathione status might play a critical role in the hyperproliferative phenotype of Hfe−/− cells, we investigated the differential expression of this transporter in detail. The increased expression of Slc7a11 that codes for the ‘transporter proper’ xCT in the cystine/glutamate exchanger xc− is demonstrable at the mRNA level and functional level in Hfe−/− RPE cells. The change in transport activity is due to an increase in maximal velocity of the transport system with no difference in substrate affinity. The increase in transport activity is associated with a significant increase in cellular levels of glutathione. It has been shown in other cell types that elevation of cellular glutathione content resulting from increased activity of xc− enhances cell proliferation, most likely via transcriptional upregulation of c-Jun and c-Fos [29, 30]. In the present study, we document a similar phenomenon in RPE cells. The upregulation of xc− and consequent elevation of glutathione content in Hfe−/− RPE cells cause an increase in the steady-state levels of c-Fos and C-Jun mRNA levels.
The molecular mechanism underlying the upregulation of Slc7a11 in Hfe−/− RPE cells remains to be established. The most likely mechanism is the iron-induced oxidative stress, which is known to activate the transcription factor Nrf2 (nuclear erythroid 2 p45 related factor-2). Nrf2 is a critical mediator of an adaptive response to protect cells from oxidative stress [37]. The promoter of Slc7a11 possesses Nrf2-binding sites and thus transcription of the gene is induced in response to Nrf2 activation [38]. Another potential mediator of Slc7a11 upregulation in Hfe−/− RPE cells is the nuclear factor ATF4. This transcription factor is a component of the PERK-eIF2α-ATF4 pathway that provides a survival advantage for tumor cells under hypoxic conditions [39]. This pathway also plays an important role in maintenance of cellular glutathione status [40]. Exposure of cells to the amyloid β1-42 peptide induces endoplasmic reticulum stress and activates PERK, leading to eIF2α phosphorylation with resultant translational upregulation of ATF mRNA and that the process is associated with induction of Slc7a11 [40]. Our studies show that Hfe−/− RPE cells accumulate more iron than wild type cells as evidenced from the expected changes in ferritin levels and TfR1 mRNA levels. Therefore, Hfe−/− RPE cells are likely to have iron-induced oxidative stress. Interestingly, it has been shown recently that intracellular iron regulates the activity of system xc− in RPE cells via cytosolic aconitase [41, 42]. Cytosolic aconitase is an iron-regulatory protein (IRP-1) and whether this protein functions as an IRP or as the aconitase enzyme depends on cellular iron status. When cells are iron-deficient, the protein assumes the role of an IRP whereas when cells have excess iron, the protein assumes the role of the enzyme. An increase in the cellular levels of iron in RPE cells facilitates the conversion of citrate into glutamate initiated by aconitase [41, 42]. Since intracellular glutamate is an exchangeable substrate for system xc−, an increase in cellular levels of glutamate enhances the activity of this transport system, facilitating the entry of cystine into cells. This however represents a non-genomic mechanism for activation of system xc−. We cannot rule out at this time the possibility of a similar mechanism contributing to some extent to the observed increase in xc− transport activity in Hfe−/− RPE cells, but clearly a genomic mechanism is also involved in these cells. Microarray analysis and RT-PCR data demonstrate unequivocally that the expression of Slc7a11 coding for the ‘transporter proper’ subunit xCT of this transport system is upregulated in Hfe−/− RPE cells.
Supplementary Material
Abbreviations used
- HFE
histocompatability leukocyte antigen class I-like protein involved in iron homeostasis
- RPE
retinal pigment epithelium
- ONL
outer nuclear layer
- INL
inner nuclear layer
- GCL
ganglion cell layer
- FAC
ferric ammonium citrate
References
- 1.Martin PM, Gnana-Prakasam JP, Roon P, Smith RG, Smith SB, Ganapathy V. Expression and polarized localization of the hemochromatosis gene product HFE in the retinal pigment epithelium. Invest. Ophthalmol. Vis. Sci. 2006;47:4238–4244. doi: 10.1167/iovs.06-0026. [DOI] [PubMed] [Google Scholar]
- 2.Gnana-Prakasam JP, Martin PM, Mysona BA, Roon P, Smith SB, Ganapathy V. Hepcidin expression in mouse retina and its regulation via lipopolysaccharide/Toll-like receptor-4 pathway independent of Hfe. Biochem. J. 2008;411:79–88. doi: 10.1042/BJ20071377. [DOI] [PMC free article] [PubMed] [Google Scholar]
- 3.Gnana-Prakasam JP, Martin PM, Zhang M, Atherton SS, Smith SB, Ganapathy V. Expression of the iron-regulatory protein hemojuvelin in retina and its regulation during cytomegalovirus infection. Biochem. J. 2009;419:533–543. doi: 10.1042/BJ20082240. [DOI] [PubMed] [Google Scholar]
- 4.Hahn P, Milam AH, Dunaief JL. Maculas affected by age-related macular degeneration contain increased chelatable iron in the retinal pigment epithelium and Bruch's membrane. Arch. Ophthalmol. 2003;121:1099–1105. doi: 10.1001/archopht.121.8.1099. [DOI] [PubMed] [Google Scholar]
- 5.Dentchev T, Hahn P, Dunaief JL. Strong labeling for iron and the iron-handling proteins ferritin and ferroportin in the photoreceptor layer in age-related macular degeneration. Arch. Ophthalmol. 2005;123:1745–1746. doi: 10.1001/archopht.123.12.1745. [DOI] [PubMed] [Google Scholar]
- 6.Dunaief JL, Richa C, Franks EP, Schultze RL, Aleman TS, Schenck JF, Zimmerman EA, Brooks DG. Macular degeneration in a patient with aceruloplasminemia, a disease associated with retinal iron overload. Ophthalmology. 2005;112:1062–1065. doi: 10.1016/j.ophtha.2004.12.029. [DOI] [PubMed] [Google Scholar]
- 7.Hahn P, Qian Y, Dentchev T, Chen L, Beard J, Harris ZL, Dunaief JL. Disruption of ceruloplasmin and hephaestin in mice causes retinal iron overload and retinal degeneration with features of age-related macular degeneration. Proc. Natl. Acad. Sci. USA. 2004;101:13850–13855. doi: 10.1073/pnas.0405146101. [DOI] [PMC free article] [PubMed] [Google Scholar]
- 8.Hadziahmetovic M, Denntchev T, Song Y, Haddad N, He X, Hahn P, Pratico D, Wen R, Harris ZL, Lambris JD, Beard J, Dunaief JL. Ceruloplasmin/hephaestin knockout mice model morphologic and molecular features of AMD. Invest. Ophthalmol. Vis. Sci. 2008;49:2728–2736. doi: 10.1167/iovs.07-1472. [DOI] [PMC free article] [PubMed] [Google Scholar]
- 9.Wrighting DM, Andrews NC. Iron homeostasis and erythropoiesis. Curr. Top. Dev. Biol. 2008;82:141–167. doi: 10.1016/S0070-2153(07)00006-3. [DOI] [PubMed] [Google Scholar]
- 10.Fleming RE, Britton RS, Waheed A, Sly WS, Bacon BR. Pathophysiology of hereditary hemochromatosis. Semin. Liver Dis. 2005;25:411–419. doi: 10.1055/s-2005-923313. [DOI] [PMC free article] [PubMed] [Google Scholar]
- 11.Beutler E. Hemochromatosis: Genetics and pathophysiology. Annu. Rev. Med. 2006;57:331–347. doi: 10.1146/annurev.med.57.121304.131310. [DOI] [PubMed] [Google Scholar]
- 12.Wallace DF, Subramaniam VN. Non-HFE hemochromatosis. World J. Gastroenterol. 2007;13:4690–4698. doi: 10.3748/wjg.v13.i35.4690. [DOI] [PMC free article] [PubMed] [Google Scholar]
- 13.Davies G, Dymock I, Harry J, Williams R. Deposition of melanin and iron in ocular structures in haemochromatosis. Br. J. Ophthalmol. 1972;56:338–342. doi: 10.1136/bjo.56.4.338. [DOI] [PMC free article] [PubMed] [Google Scholar]
- 14.Roth AM, Foos RY. Ocular pathologic changes in primary hemochromatosis. Arch. Ophthalmol. 1972;87:507–514. doi: 10.1001/archopht.1972.01000020509003. [DOI] [PubMed] [Google Scholar]
- 15.Miyasaki K, Murao S, Koizumi N. Hemochromatosis associated with brain lesions – a disorder of trace-metal binding proteins and/or polymers. J. Neuropathol. Exp. Neurol. 1977;36:964–976. doi: 10.1097/00005072-197711000-00008. [DOI] [PubMed] [Google Scholar]
- 16.Nielsen JE, Jensen LN, Krabbe K. Hereditary haemochromatosis: a case of iron accumulation in the basal ganglia associated with a parkinsonian syndrome. J. Neurol. Neurosurg. Psychiatry. 1995;59:318–321. doi: 10.1136/jnnp.59.3.318. [DOI] [PMC free article] [PubMed] [Google Scholar]
- 17.Berg D, Hoggenmuller U, Hofmann E, Fischer R, Kraus M, Scheurlen M, Becker G. The basal ganglia in haemochromatosis. Neuroradiology. 2000;42:9–13. doi: 10.1007/s002340050002. [DOI] [PubMed] [Google Scholar]
- 18.Costello DJ, Walsh SL, Harrington HJ, Walsh CH. Concurrent hereditary haemochromatosis and idiopathic Parkinson's disease: a case report series. J. Neurol. Neurosurg. Psychiatry. 2004;75:631–633. doi: 10.1136/jnnp.2003.027441. [DOI] [PMC free article] [PubMed] [Google Scholar]
- 19.Hahn P, Dentchev T, Qian Y, Rouault T, Harris ZL, Dunaief JL. Immunolocalization and regulation of iron handling proteins ferritin and ferroportin in the retina. Mol. Vis. 2004;10:598–607. [PubMed] [Google Scholar]
- 20.Smith SB, Duplantier JN, Dun Y, Mysona B, Roon P, Martin PM, Ganapathy V. In vivo protection against retinal neurodegeneration by the σR1 ligand (+)-pentazocine. Invest. Ophthalmol. Vis. Sci. 2008;49:4154–4161. doi: 10.1167/iovs.08-1824. [DOI] [PMC free article] [PubMed] [Google Scholar]
- 21.Martin PM, Ananth S, Cresci GA, Roon P, Smith SB, Ganapathy V. Expression and localization of GPR109A (PUMA-G/HM74A) mRNA and protein in mammalian retinal pigment epithelium. Mol. Vis. 2009;15:362–372. [PMC free article] [PubMed] [Google Scholar]
- 22.Thangaraju M, Gopal E, Martin PM, Ananth S, Smith SB, Prasad PD, Sterneck E, Ganapathy V. SLC5A8 triggers tumor cell apoptosis through pyruvate-dependent inhibition of histone deacetylases. Cancer Res. 2006;66:11560–11564. doi: 10.1158/0008-5472.CAN-06-1950. [DOI] [PubMed] [Google Scholar]
- 23.Yang D, Stewart TJ, Smith KK, Georgi D, Abrams SI, Liu K. Downregulation of IFN-gammaR in association with loss of Fas function is linked to tumor progression. Int. J. Cancer. 2008;122:350–362. doi: 10.1002/ijc.23090. [DOI] [PubMed] [Google Scholar]
- 24.Bridges CD, Kekuda R, Wang H, Prasad PD, Mehta P, Huang W, Smith SB, Ganapathy V. Structure, function, and regulation of human cystine/glutamate transporter in retinal pigment epithelial cells. Invest. Ophthalmol. Vis. Sci. 2001;42:47–54. [PubMed] [Google Scholar]
- 25.Bridges CC, Hu H, Miyauchi S, Siddaramappa UN, Ganapathy ME, Iganatowicz L, Maddox DM, Smith SB, Ganapathy V. Induction of cystine/glutamate transporter xc- by human immunodeficiency virus type 1 transactivator protein Tat in retinal pigment epithelium. Invest. Ophthalmol. Vis. Sci. 2004;45:2906–2914. doi: 10.1167/iovs.03-1355. [DOI] [PMC free article] [PubMed] [Google Scholar]
- 26.Thomson AM, Rogers JT, Leedman PJ. Iron-regulatory proteins, iron-responsive elements and ferritin mRNA translation. Int. J. Biochem. Cell Biol. 1999;31:1139–1152. doi: 10.1016/s1357-2725(99)00080-1. [DOI] [PubMed] [Google Scholar]
- 27.Rouault TA. The role of iron regulatory proteins in mammalian iron homeostasis and disease. Nat. Chem. Biol. 2006;2:406–414. doi: 10.1038/nchembio807. [DOI] [PubMed] [Google Scholar]
- 28.Lo M, Wang YZ, Gout PW. The xc- cystine/glutamate antiporter: a potential target for therapy of cancer and other diseases. J. Cell. Physiol. 2008;215:593–602. doi: 10.1002/jcp.21366. [DOI] [PubMed] [Google Scholar]
- 29.Lastro M, Kourtidis A, Farley K, Conklin DS. xCT expression reduces the early cell cycle requirement for calcium signaling. Cell. Signal. 2008;20:390–399. doi: 10.1016/j.cellsig.2007.10.030. [DOI] [PMC free article] [PubMed] [Google Scholar]
- 30.Reddy NM, Kleeberger SR, Bream JH, Fallon PG, Kensler TW, Yamamoto M, Reddy SP. Genetic disruption of the Nrf2 compromises cell-cycle progrby impairing GSH-induced redox signaling. Oncogene. 2008;27:5821–5832. doi: 10.1038/onc.2008.188. [DOI] [PMC free article] [PubMed] [Google Scholar]
- 31.Bird AC. Towards an understanding of age-related macular disease. Eye. 2003;17:457–466. doi: 10.1038/sj.eye.6700562. [DOI] [PubMed] [Google Scholar]
- 32.Fine SL, Berger JW, Maguire MG, Ho AC. Age-related macular degeneration. N. Engl. J. Med. 2000;342:483–492. doi: 10.1056/NEJM200002173420707. [DOI] [PubMed] [Google Scholar]
- 33.Ambati J, Ambati BK, Yoo SH, Ianchulev S, Adamis AP. Age-related macular degeneration: etiology, pathogenesis, and therapeutic strategies. Surv. Ophthalmol. 2003;48:257–293. doi: 10.1016/s0039-6257(03)00030-4. [DOI] [PubMed] [Google Scholar]
- 34.Montezuma SR, Sobrin L, Seddon JM. Review of genetics in age related macular degeneration. Semin. Ophthalmol. 2007;22:229–240. doi: 10.1080/08820530701745140. [DOI] [PubMed] [Google Scholar]
- 35.Beatty S, Koh H, Phil M, Henson D, Boulton M. The role of oxidative stress in the pathogenesis of age-related macular degeneration. Surv. Ophthalmol. 2000;45:115–134. doi: 10.1016/s0039-6257(00)00140-5. [DOI] [PubMed] [Google Scholar]
- 36.Chew EY. Nutritional supplement use and age-related macular degeneration. Curr. Opin. Ophthalmol. 1995;6:19–24. doi: 10.1097/00055735-199506000-00004. [DOI] [PubMed] [Google Scholar]
- 37.Ishii T, Itoh K, Sato H, Bannai S. Oxidative stress-inducible proteins in macrophages. Free Radic. Res. 1999;31:351–355. doi: 10.1080/10715769900300921. [DOI] [PubMed] [Google Scholar]
- 38.Sasaki H, Sato H, Kuriyama-Matsumura K, Sato K, Maebara K, Wang H, Tamba M, Itoh K, Yamamoto M, Bannai S. Electrophile response element-mediated induction of the cystine/glutamate exchange transporter gene expression. J. Biol. Chem. 2002;277:44765–44771. doi: 10.1074/jbc.M208704200. [DOI] [PubMed] [Google Scholar]
- 39.Fels DR, Koumenis C. The PERK/eIF2α/ATF4 module of the UPR in hypoxia resistance and tumor growth. Cancer Biol. Ther. 2006;5:723–728. doi: 10.4161/cbt.5.7.2967. [DOI] [PubMed] [Google Scholar]
- 40.Lewerenz J, Maher P. Basal levels of eIF2α phosphorylation determine cellular antioxidant status by regulating ATF4 and xCT expression. J. Biol. Chem. 2009;284:1106–1115. doi: 10.1074/jbc.M807325200. [DOI] [PMC free article] [PubMed] [Google Scholar]
- 41.Lall MM, Ferrell J, Nagar S, Fleisher LN, McGahan MC. Iron regulates L-cystine uptake and glutathione levels in lens epithelial and retinal epithelial cells by its effect on cytosolic aconitase. Invest. Ophthalmol. Vis. Sci. 2008;49:310–319. doi: 10.1167/iovs.07-1041. [DOI] [PubMed] [Google Scholar]
- 42.Goralska M, Ferrell J, Harned J, Lall M, Nagar S, Fleisher LN, McGahan MC. Iron metabolism in the eye: A review. Exp. Eye Res. 2009 doi: 10.1016/j.exer.2008.10.026. (in press) [DOI] [PMC free article] [PubMed] [Google Scholar]
Associated Data
This section collects any data citations, data availability statements, or supplementary materials included in this article.


