

Abstract
Objectives:
To provide updated estimates of Alzheimer disease (AD) dementia prevalence in the United States from 2010 through 2050.
Methods:
Probabilities of AD dementia incidence were calculated from a longitudinal, population-based study including substantial numbers of both black and white participants. Incidence probabilities for single year of age, race, and level of education were calculated using weighted logistic regression and AD dementia diagnosis from 2,577 detailed clinical evaluations of 1,913 people obtained from stratified random samples of previously disease-free individuals in a population of 10,800. These were combined with US mortality, education, and new US Census Bureau estimates of current and future population to estimate current and future numbers of people with AD dementia in the United States.
Results:
We estimated that in 2010, there were 4.7 million individuals aged 65 years or older with AD dementia (95% confidence interval [CI] = 4.0–5.5). Of these, 0.7 million (95% CI = 0.4–0.9) were between 65 and 74 years, 2.3 million were between 75 and 84 years (95% CI = 1.7–2.9), and 1.8 million were 85 years or older (95% CI = 1.4–2.2). The total number of people with AD dementia in 2050 is projected to be 13.8 million, with 7.0 million aged 85 years or older.
Conclusion:
The number of people in the United States with AD dementia will increase dramatically in the next 40 years unless preventive measures are developed.
The aging of the “baby boom” generation will dramatically increase the number of persons in the United States who have Alzheimer disease (AD) dementia and the huge burden it places on people with the disease, their caregivers, and society. As recognized in the National Plan to Address Alzheimer's Disease recently released by the Obama Administration, a full appreciation of the breadth of the challenge, how it may change in the future, and progress toward reducing the burden of AD dementia require estimates of current and projected prevalence of AD in the population. The most recently available estimates, however, are nearly a decade old. Therefore, this report presents updated estimates of the prevalence of AD dementia similar to those published in 2003 using the 2000 census population projections1 that reflect the changing age structure of the US population. These new estimates were generated using the same methods as the earlier report but updated all 5 components of information used in the calculations of future prevalence: 1) risk of developing AD dementia, 2) increased risk of mortality among those with AD dementia, 3) US mortality rates, 4) US education distribution, and 5) US current and projected total population.
METHODS
We applied the forward calculation methods used in the previous report using the 2000 census population projections,1 which were a variation of the technique proposed by Brookmeyer et al.2
AD dementia data.
We obtained incidence data from the Chicago Health and Aging Project (CHAP),3,4 a longitudinal, population-based study in a geographically defined area of Chicago. The study began in 1993 with a census of individuals aged 65 years or older. Of those identified, 6,158 (79%) participated in a home interview. Additional people were recruited as they turned age 65 for a total of 10,802 participants through 2011. Participants were re-interviewed in 3-year cycles. Each data-collection cycle consisted of an in-home interview of all participants and clinical evaluation for AD dementia of a stratified, random sample. Sampling for clinical evaluation was based on age, race, sex, and change in cognitive function from one home interview to the next of the entire cohort, with persons randomly selected for evaluation from all levels of cognitive change. Between 1997 and 2010, 402 cases of incident AD dementia were identified in 2,577 evaluations among 1,913 individuals determined to be free of AD dementia at the previous cycle, an average interval of 4.0 years. These participants were 38% male and 54% black. Their mean age was 77.1 years and mean years of education was 12.9. All persons examined received identical structured clinical evaluations by examiners blinded to population-interview cognitive testing and sampling category. Criteria for AD dementia were those of the Work Group of the National Institute of Neurological and Communicative Disorders and Stroke and the Alzheimer’s Disease and Related Disorders Association for probable AD dementia,5 except that persons who met these criteria and had another condition impairing cognition were retained.
Calculations.
We evaluated incidence risk using weighted logistic regression with predictors of age at time of evaluation (truncated at 90 years), age squared (truncated), an indicator for age older than 90 years, sex, race (black/other), years of education in 3 groups (<12, 12, >12), and interval between disease-free determination and clinical evaluation. (We used age truncation and a group indictor because there were not enough observations over age 90 to provide reliable single year estimates. We grouped education in a way that gave the best distribution of categories available for US educational information.) We calculated weights to provide estimates of the full population, using Iterative Proportional Fitting6 to adjust for clinical evaluation participation. Including loss to death, 68% of sampled individuals participated.
We evaluated AD dementia mortality risk among the same people using weighted Cox proportional hazards models adjusting for age, sex, race, and education. There were 990 deaths and mean follow-up of 6.1 years. There were no significant interactions among predictors.
We calculated separate incidence estimates (for each evaluation year) for 432 groups defined by single year of age, sex, 2 race groups, and 3 education groups. We computed a weighted average incidence across the education groups for each age, sex, and race group. The weights were based on the 2006–2008 level of education from the US Bureau of Census Current Population Survey. We obtained the educational status of populations beyond 2010 (e.g., 2011, 2012, etc.) by aging the population in those data so that the education distribution of people aged 65 years in 2010 would be the same distribution used for those aged 75 years in 2020.
In the second stage, we estimated the prevalence of disease in each US subpopulation jointly defined by sex, race, year of age (beginning with age 65), and calendar year. Each estimate incorporated information on the AD dementia and mortality experience of the corresponding birth cohort in previous years. We used life-table estimates of number of people alive (of a theoretical birth cohort of 100,000) and probability of death for the relevant age and calendar year. For example, the prevalence estimate for black women aged 69 years in 2013 incorporated information on black women aged 68 years in 2012, which in turn incorporated information on black women aged 67 years in 2011, and so on.
Beginning at age 65 for each birth cohort (and assuming no disease before age 65), we obtained the number of people developing AD dementia at each subsequent age and, therefore, calendar year by multiplying the number of people alive without AD dementia at the beginning of the 1-year age interval by the probability of incident AD dementia for that age, sex, and race group. We added the new cases to the number with AD dementia carried over from the previous age in the previous calendar year and subtracted them from the disease-free number. Using 2.13 as the relative risk of dying with AD dementia and an iterative algorithm, we divided the total number of deaths in the age interval into those dying with and without AD dementia. We subtracted the deaths from the AD dementia and the AD dementia-free numbers to provide the new numbers of people with and without AD dementia for the next age in the subsequent year. We then divided the new number with AD dementia by the total number remaining alive to provide the proportion with prevalent disease. This was the process we used to compute the new cases of AD dementia before subtracting the deaths for the ensuing year. Because deaths occur throughout the year, we repeated the entire prevalence procedure, subtracting the deaths at each age before rather than after computing the new cases of AD dementia to provide a range for the prevalence proportion. We then averaged these 2 proportions for each age, sex, and race group.
In the final stage, we multiplied the proportion of prevalent AD dementia by the census estimate of number of people in each age, sex, and race group and summed across groups to obtain total numbers of people with AD dementia.
In comparison with our previous calculations using the 2000 census population,1 the present calculations used the following updated information. First, data from more individuals and more evaluations for AD dementia in CHAP were available for our current estimates of AD dementia risk. In our previously reported AD dementia projections,1 we computed estimates of risk of incident AD dementia based on fewer than 1,000 detailed clinical evaluations for incident AD dementia from 1997 to 2000. In our current analyses, we used 2,577 evaluations among 1,913 individuals occurring between 1997 and 2010. Second, for estimating increased mortality among those with AD dementia, our current analyses relied on a larger pool of data that also were closely tied to the source of incidence data. Specifically, the previous estimates used the hazard ratio for increased risk of death among those with AD dementia obtained from 467 participants in the East Boston Study, which included both prevalent and incident cases of AD dementia. Our current mortality estimate relies on data from the same 1,913 CHAP participants we used as the source for estimating AD dementia incidence risk, and that estimate included only incident cases of AD dementia. Third, we used updated US data on 3 key components of the prevalence calculation: data on previous7 and projected8 US mortality by age, race, and sex; information about educational levels in the United States by age, race, and sex9; and information about current population10 and projections of future population11 by age, race, and sex.
We also calculated 95% confidence interval (CI) for the 2010 AD dementia estimate using delete-a-group jackknife variance estimation.12 This describes the uncertainty in the incidence estimates, and does not include uncertainty in the subsequent steps in the calculations.
Standard protocol approvals, registrations, and patient consents.
The Rush University Medical Center Institutional Review Board approved the study.
RESULTS
The estimated number of people with AD dementia in 2010 and projections for subsequent years are listed in table 1. The estimated number of people with AD dementia in the United States in 2010 is predicted to nearly triple by 2050 (figure 1). The 95% CIs for the estimated numbers in 2010 are listed in table 2. The CIs show that the 2010 prevalences projected using previous census estimates are well within the uncertainties of the AD dementia estimates made using the new 2010 census data. The CIs for the projections would be of similar size.
Table 1.
Predicted number of people in the United States with Alzheimer disease (in millions) and percent of the group affected, by age group and year
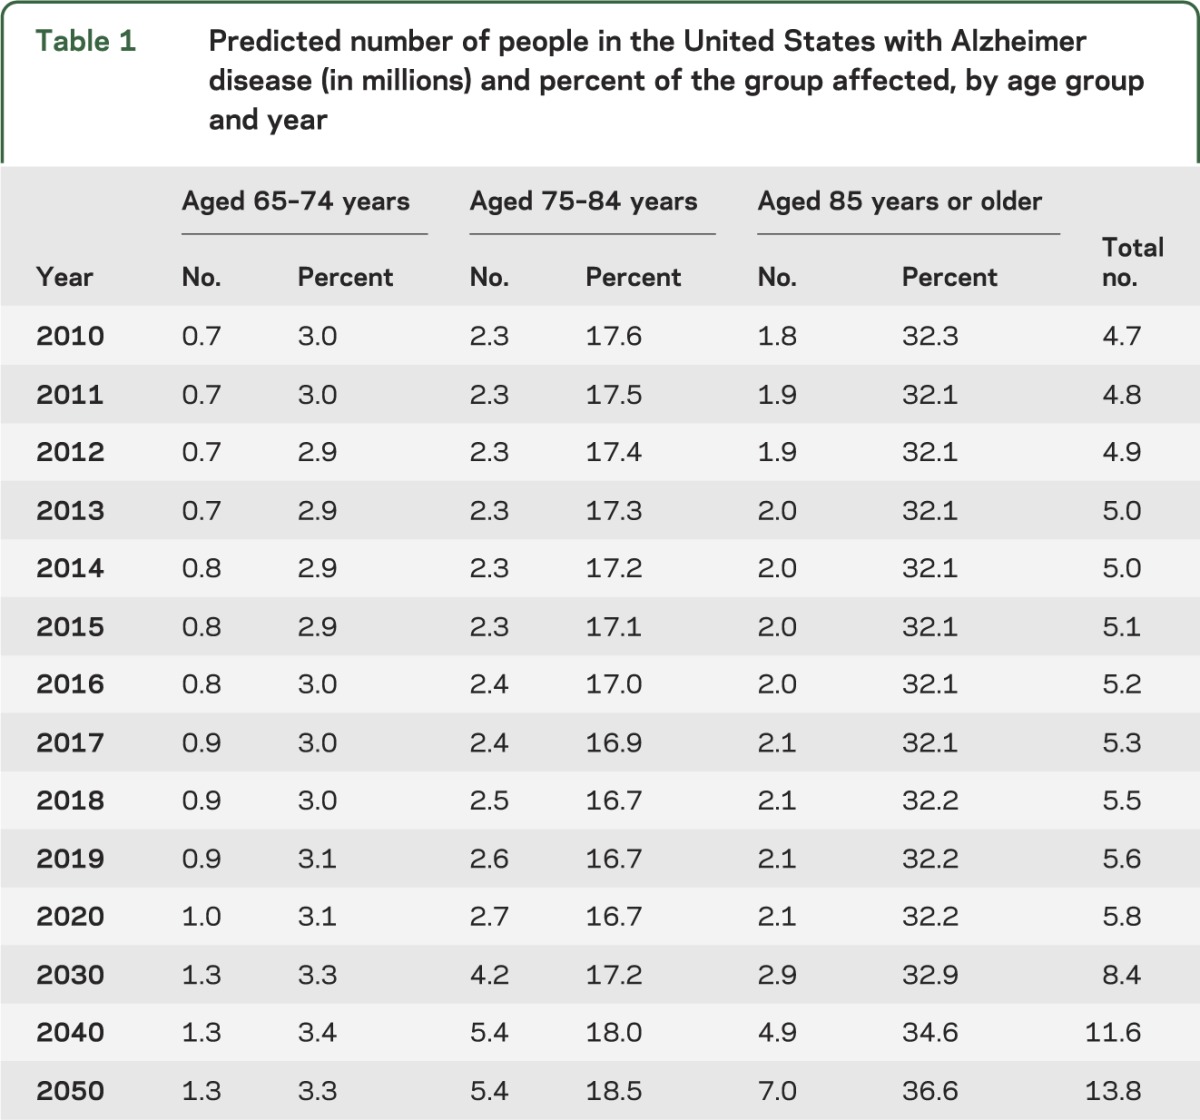
Figure 1. Estimated number of people with Alzheimer disease (AD) in the United States in 2010 and projections through 2050.
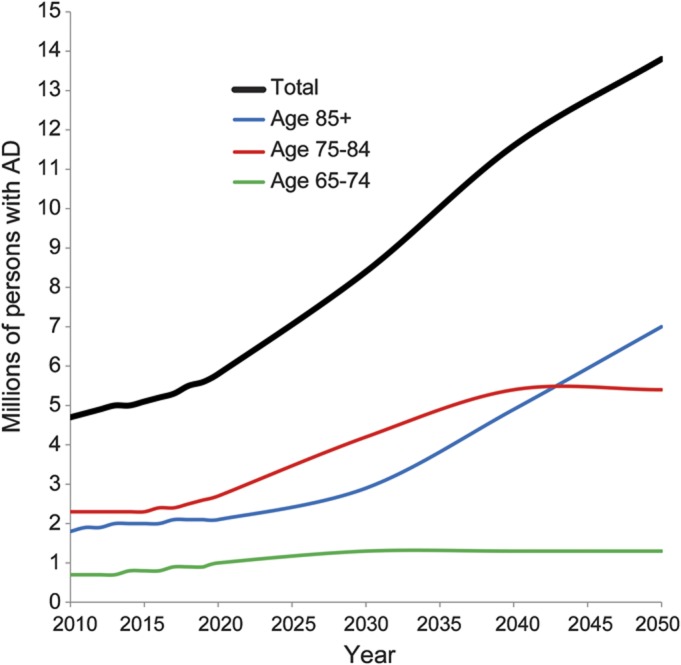
Table 2.
Ninety-five percent confidence intervals for the estimated numbers of people (in millions) with Alzheimer disease in 2010
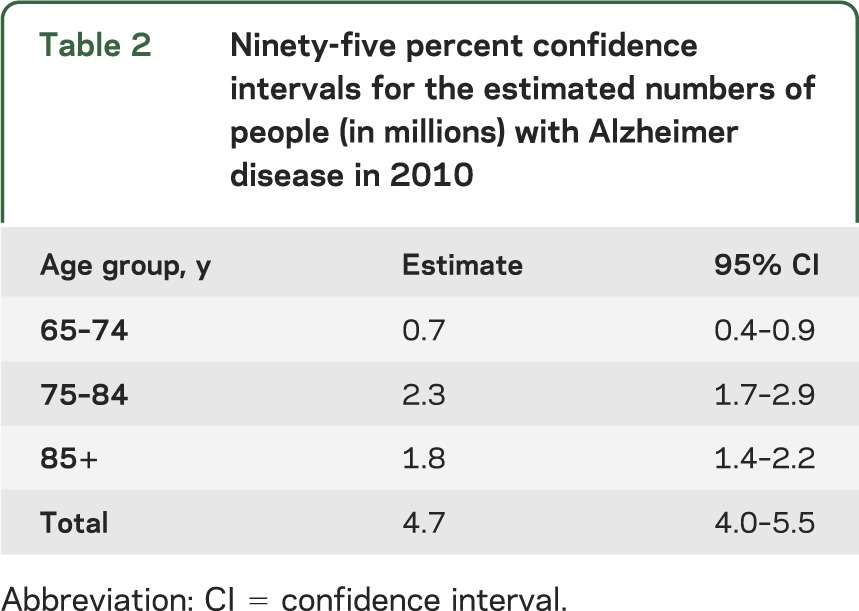
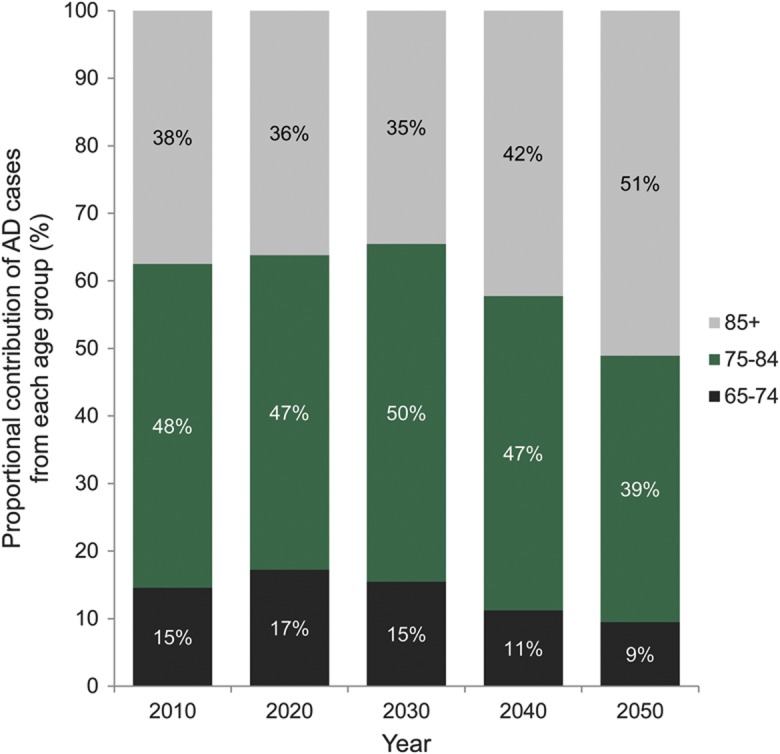
Figure 2 shows the contribution of each age group to the total number of people affected. The 65 to 74 age group contributes little to the number of people with AD dementia, even as the baby boomer bulge passes through that age range, because the prevalence of AD dementia is low under age 75. The prevalence of AD dementia is much larger in the oldest age group, but because the size of the oldest population is smaller, the middle age group contributes the largest number of cases of AD dementia until 2050. The oldest baby boomers will turn 75 in 2016 and there is a large increase in number of cases in the 75 to 84 age group in 2030 and 2040. By 2050, the youngest baby boomers will be 86 years old so the number of cases in the middle age range will level off whereas cases in the oldest age group will continue to increase.
Figure 2. Age distribution of number of persons with Alzheimer disease (AD) in the United States, 2010 through 2050.
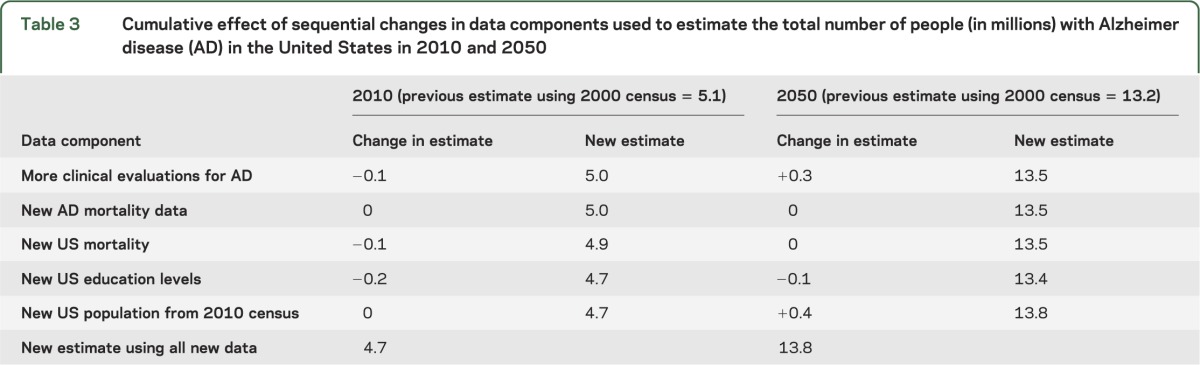
To examine the effect of changes in each of the data components on the estimate of number of AD dementia cases, we changed each data component sequentially. Beginning with the old data, we first added the results of the additional clinical evaluations to the estimation process. This decreased the 2010 estimate by 0.1 million (table 3). We next added the results of the new mortality data, which produced less than 0.1 million difference in the estimate of number of cases. The third component changed was the estimates of US total mortality. New estimates of US education levels were added next, producing an AD dementia prevalence estimate 0.2 million lower. The final change added the new US population numbers. The 2010 census total population aged 65 years or older was 40.3 million, compared with the projected population available in 2002 of 39.4 million. Using the newer data produced a change of less than 0.1 million. Table 3 also lists the effect of each data component on the projected estimate for 2050. The changes were not attributable to a single factor, but rather to small variations in multiple components. The update to the projected population numbers for 2050 contributed the largest change to the projected AD dementia prevalence for that year. The population aged 65 years or older projected for 2050 increased to 88.5 million from 81.7 million in the previous projections. However, this is also the time most distant from the present and therefore the most difficult number to estimate.
Table 3.
Cumulative effect of sequential changes in data components used to estimate the total number of people (in millions) with Alzheimer disease (AD) in the United States in 2010 and 2050
DISCUSSION
Updating each of the 5 components of the analyses produces results consistent with the previously reported AD projections using the 2000 census population projections.1 Statistically, they are comparable, and, more importantly, both old and new estimates continue to show that the burden AD places on the population, short of any effective preventive interventions, is going to continue to increase substantially.
It has been suggested that these numbers would decrease substantially if an intervention was identified that merely delayed the onset of AD dementia. It would take time for the intervention to decrease the prevalence of the disease, more so if the intervention took time to affect the relevant physiologic changes. An intervention whose effects were most pronounced in the earliest stage of disease would also have delayed impact on future prevalence. For instance, if the measure was effective only if implemented by age 50, there would be no change in the projected bulge from the baby boomers because all baby boomers are at least 50 now.
We are aware of only 2 other projections, in addition to the earlier report using CHAP data. A study in East Boston, MA, projected 5.1 million people with AD dementia for 2010 and 10.2 million people in 2050.13 That study used similar diagnostic criteria, but different statistical methodology. That approach could not take into account the expected increase in survival by 2050. The method used here assumed that projected increases in survival over the next 40 years will affect both persons with and without AD dementia, with the ratio of survival among unaffected persons to survival among affected persons remaining constant at its present level, so that persons with AD dementia will survive longer than they currently do. The other study2 used similar statistical methods, but combined estimates of incidence from 4 different studies. One was the incidence phase of the East Boston study,14 which used stratified random sampling to ascertain disease. The other 3 studies, however, used methods that gave lower estimates, especially in the oldest age groups. One15 used only medical records to identify cases; another16 eliminated the low-scoring 10% of persons from the dementia-free cohort and used a restrictive protocol to detect incident disease. Another17 examined a highly educated volunteer cohort, which was likely healthier than the total population. Because the older subgroups of the US population will experience the greatest growth, these lower estimates of disease in the oldest age groups result in large differences in projected AD dementia prevalence in future years. Nonetheless, all studies suggest marked growth in numbers of persons affected by AD dementia as the baby boom generation ages.
Our study has several limitations. The data used for incidence estimation were obtained from a limited geographic area. The Aging, Demographics, and Memory Study determined US prevalence of AD dementia in 2001–2003 using a nationally representative sample.18 That study found lower prevalence than estimated in the earlier CHAP article. The prevalence of disease in the Chicago area we studied may have been higher, but the Aging, Demographics, and Memory Study found no evidence of regional differences. There is evidence19 that the 2 studies used different cut-points for classifying disease presence in this condition of gradual onset. We were not able to estimate the distribution of severity of disease from these data, because there is no standard rate of progression of the disease. In addition, these estimates assumed that the risk of AD dementia is the same for people of Hispanic origin and the racial group with which they identify. If it differs, there may be a different total number of cases of AD dementia, especially in the future when the proportion of the older population that is Hispanic will be larger. These calculations assumed that there was no incidence of AD dementia under age 65. Although this is patently false, the occurrence is rare enough that it would not contribute substantively to the total prevalence. The CIs account only for uncertainty attributable to sampling from a community population of approximately 10,000 people. They do not account for the uncertainty in extrapolation to the 40 million people aged 65 years or older in the United States. They also do not account for the uncertainty in future estimates of US population. For the previous projections, we used 3 estimates of future population provided by the US Census Bureau to present this latter type of uncertainty, but the Census Bureau now provides only one estimate.
Our study has important strengths, as well. For incidence and mortality inputs, we relied on CHAP, a population-based study in which participants underwent standardized neurologic evaluation. This is preferable to using clinical sources because many people who have AD dementia are not clinically diagnosed.20 Moreover, CHAP's approach to diagnosis included evaluation of people from all strata of cognitive performance, including the best performers, which prevented undercounting new cases and underestimating mortality among persons with AD dementia.21 Thus, relying on incidence and mortality rates derived from a study that systematically assessed its participants in this way likely improved the accuracy of our prevalence estimates.
The estimates of the number of people with AD dementia have changed little, despite changes in each of the components of the calculations. The number of people with AD dementia is projected to nearly triple between 2010 and 2050. AD dementia will involve a larger proportion of the total population as the baby boomer bulge ages, and these projections emphasize the need to find either prevention or treatment for AD dementia in order to decrease the burden of future disease on individuals, families, and the medical care system.
GLOSSARY
- AD
Alzheimer disease
- CHAP
Chicago Health and Aging Project
- CI
confidence interval
AUTHOR CONTRIBUTIONS
Dr. Hebert contributed to study concept and design, analysis and interpretation of the data, and study supervision. Dr. Weuve contributed to analysis and interpretation of the findings and critical revision of the manuscript for important intellectual content. Dr. Scherr contributed to study concept and design, acquisition of data, and analysis and interpretation of the findings. Dr. Evans contributed to study concept and design, acquisition of data, critical revision of the manuscript for important intellectual content, and study supervision.
STUDY FUNDING
This work was funded by the Alzheimer's Association and NIH/National Institute on Aging grant AG011101.
DISCLOSURE
L. Hebert is (or has been) funded (principal investigator, coinvestigator, or biostatistician) by NIH grants NR010211, AG303544, AG011101, AG036650, and AG009966. J. Weuve is a consultant for the Alzheimer's Association and the AlzRisk Project (www.alzrisk.org). She is also funded by NIH grants R21ES019712 and R21ES020404. P. Scherr reports no disclosures. D. Evans is funded (principal investigator or coinvestigator) by NIH grants AG11101, AG036650, AG09966, AG030146, AG10161, AG021972, ES10902, NR009543, HL084209, and AG12505l. Go to Neurology.org for full disclosures.
REFERENCES
- 1.Hebert LE, Scherr PA, Bienias JL, Bennett DA, Evans DA. Alzheimer disease in the US population: prevalence estimates using the 2000 census. Arch Neurol 2003;60:1119–1122 [DOI] [PubMed] [Google Scholar]
- 2.Brookmeyer R, Gray S, Kawas C. Projections of Alzheimer's disease in the United States and the public health impact of delaying disease onset. Am J Public Health 1998;88:1337–1342 [DOI] [PMC free article] [PubMed] [Google Scholar]
- 3.Evans DA, Bennett DA, Wilson RS, et al. Incidence of Alzheimer disease in a biracial urban community: relation to apolipoprotein E allele status. Arch Neurol 2003;60:185–189 [DOI] [PubMed] [Google Scholar]
- 4.Bienias JL, Beckett LA, Bennett DA, Wilson RS, Evans DA. Design of the Chicago Health and Aging Project (CHAP). J Alzheimers Dis 2003;5:349–355 [DOI] [PubMed] [Google Scholar]
- 5.McKhann G, Drachman D, Folstein M, Katzman R, Price D, Stadlan EM. Clinical diagnosis of Alzheimer's disease: report of the NINCDS-ADRDA Work Group under the auspices of Department of Health and Human Services Task Force on Alzheimer's Disease. Neurology 1984;34:939–944 [DOI] [PubMed] [Google Scholar]
- 6.Little RJA, Rubin DB. Statistical Analysis with Missing Data, 2nd ed New York: Wiley; 2002 [Google Scholar]
- 7.United States Life Tables. 2012. Available at: www.cdc.gov/nchs/products/life_tables.htm. Accessed April 16, 2012 [PubMed]
- 8.US Census Bureau request e_proj_RushU_387v1 2000–2050 total population and total number of deaths by single year of age (0–99, 100+), sex and race. Created September 12, 2011. Washington, DC: US Census Bureau; 2012.
- 9.American Community Survey 3-year estimates 2006–2008. Available at: dataferrett.census.gov. Accessed September 20, 2010. Washington, DC: US Census Bureau
- 10.American Fact Finder 2010 Census Summary File 2 PCT3. 2012. Available at: factfinder2.census.gov/. Accessed May 7, 2012.
- 11.National Population Projections Release 2008 NP2008_D1. 2012. Available at: www.census.gov/population/www/projections/downloadablrefiles.htm. Accessed March 2, 2012
- 12.Bienias JL, Kott PS, Evans DA. Applying the delete-a-group jacknife varience estimator to analyses of data from a complex longitudinal survey. Proceedings of the Annual Meeting of the American Statistical Association, Section on Survey Research Methods. Alexandria: American Statistical Association; 2003:539–544
- 13.Evans DA. Estimated prevalence of Alzheimer's disease in the United States. Milbank Q 1990;68:267–289 [PubMed] [Google Scholar]
- 14.Hebert LE, Scherr PA, Beckett LA, et al. Age-specific incidence of Alzheimer's disease in a community population. JAMA 1995;273:1354–1359 [PubMed] [Google Scholar]
- 15.Kokmen E, Chandra V, Schoenberg BS. Trends in incidence of dementing illness in Rochester, Minnesota, in three quinquennial periods, 1960–1974. Neurology 1988;38:975–980 [DOI] [PubMed] [Google Scholar]
- 16.Bachman DL, Wolf PA, Linn RT, et al. Incidence of dementia and probable Alzheimer's disease in a general population: the Framingham Study. Neurology 1993;43:515–519 [DOI] [PubMed] [Google Scholar]
- 17.Kawas C, Gray S, Brookmeyer R, Fozard J, Zonderman A. Age-specific incidence rates of Alzheimer's disease: the Baltimore Longitudinal Study of Aging. Neurology 2000;54:2072–2077 [DOI] [PubMed] [Google Scholar]
- 18.Plassman BL, Langa KM, Fisher GG, et al. Prevalence of dementia in the United States: the aging, demographics, and memory study. Neuroepidemiology 2007;29:125–132 [DOI] [PMC free article] [PubMed] [Google Scholar]
- 19.Wilson RS, Weir DR, Leurgans SE, et al. Sources of variability in estimates of the prevalence of Alzheimer's disease in the United States. Alzheimers Dement 2011;7:74–79 [DOI] [PMC free article] [PubMed] [Google Scholar]
- 20.Bradford A, Kunik ME, Schulz P, Williams SP, Singh H. Missed and delayed diagnosis of dementia in primary care: prevalence and contributing factors. Alzheimer Dis Assoc Disord 2009;23:306–314 [DOI] [PMC free article] [PubMed] [Google Scholar]
- 21.Brookmeyer R, Evans DA, Hebert L, et al. National estimates of the prevalence of Alzheimer's disease in the United States. Alzheimers Dement 2011;7:61–73 [DOI] [PMC free article] [PubMed] [Google Scholar]