

Abstract
Objective:
We evaluated regional brain volumes and cerebral metabolite levels as correlates of HIV DNA in peripheral blood mononuclear cells (PBMCs).
Methods:
In this cross-sectional study, 35 HIV+ subjects aged ≥40 years (25 with detectable PBMC HIV DNA; 10 with HIV DNA <10 copies/106 cells, the threshold of detection) and 12 seronegative controls underwent structural brain MRI and magnetic resonance spectroscopy at 3 T. HIV+ subjects were on combination antiretroviral therapy ≥1 year; all but 1 had plasma HIV RNA <50 copies/mL. We used logistic regression to evaluate relationships of likely predictor variables to the outcome of PBMC HIV DNA detectability in the HIV+ subjects. Effects of serostatus and HIV DNA on regional brain volumes (normalized to intracranial volume) and on metabolite ratios over creatine were evaluated by analyses of covariance, controlling for age.
Results:
Relative to the HIV+ group with undetectable HIV DNA, subjects with detectable HIV DNA demonstrated decreased volumes of cerebellar (−14%, p = 0.020) and total subcortical (−10%, p = 0.024) gray matter. Compared to healthy controls, only the detectable HIV DNA group showed significant (p < 0.05) enlargement of lateral ventricles and volumetric reductions of caudate, putamen, thalamus, hippocampus, nucleus accumbens, brainstem, total cortical gray matter, and cerebral white matter. Detectable HIV DNA was not associated with significantly altered cerebral metabolite levels.
Conclusion:
Inability to clear peripheral blood of HIV DNA is associated with regional brain atrophy in well-controlled HIV infection, supporting the involvement of peripheral viral reservoirs in the neuropathogenesis of persistent HIV-related neurocognitive disorders.
Although the incidence of dementia in HIV infection has dropped with the use of combination antiretroviral therapy (cART),1 HIV-associated neurocognitive disorders (HAND) remain prevalent (∼50%).2 The mechanism whereby suppressed HIV viremia can induce neuronal injury and neuropsychological deficits3 remains unclear.
HIV DNA in peripheral blood mononuclear cells (PBMCs) constitutes a viral reservoir that may contribute to ongoing neurologic impairment. Detectable PBMC HIV DNA is associated with cognitive dysfunction in cART-naïve individuals4 and in cART-treated subjects with undetectable plasma HIV RNA.5,6 HIV DNA within the activated CD14+ monocyte subset of PBMC correlates with neurocognitive decline.5,7 We have linked elevated PBMC HIV DNA to cortical thinning8 but the relationship of HIV DNA to brain structure has not otherwise been explored.
In this study, we hypothesized that detectability of PBMC HIV DNA relates to cerebral metabolite abnormalities and to decreased volumes of subcortical gray matter structures and other brain regions, including the nucleus accumbens and brainstem. Brainstem atrophy9 and a relationship between apathy and nucleus accumbens shrinkage10 have been noted in HIV. Additionally, we analyzed volumes of total cortical and subcortical gray matter, cerebral white matter, cerebellar gray and white matter, and lateral ventricles. To evaluate brain function, we measured levels of N-acetylaspartate (NAA), choline (Cho), myo-inositol (MI), and glutamate (Glu) over creatine (Cr) in basal ganglia, frontal white matter (FWM), and posterior gray matter. Regional brain volumes and metabolite ratios were compared among HIV-seronegative controls and 2 HIV-seropositive subject groups stratified by PBMC HIV DNA detectability.
METHODS
Participants.
We studied 35 HIV-seropositive (HIV+) individuals and 12 healthy HIV-seronegative (SN) control subjects, aged 40 years and older, in a cross-sectional pilot study of MRI and proton magnetic resonance spectroscopy (MRS). HIV+ individuals with confirmed serologic status were drawn from Hawaii Center for AIDS research cohorts whose recent HIV DNA levels were known and who had agreed to be contacted for future trials. Patients within our HIV clinic who had high HIV DNA were identified through a separate screening protocol. We recruited SN controls from the local community through flyers and word of mouth. HIV+ participants comprised 10 subjects with undetectable PBMC HIV DNA (<10 copies/106 cells) and 25 with detectable HIV DNA (median 269.0 copies/106 cells; range 21.0–31,159.0), respectively termed the U-HIV and D-HIV groups. HIV+ participants had been on stable cART ≥1 year and evidenced suppressed plasma HIV RNA. HIV seronegativity in controls was verified by ELISA blood test. HIV+ and SN individuals were eligible for the study if they were ≥18 years old, could understand and sign a written informed consent document, and met none of the following exclusion criteria: 1) a major psychiatric or neurologic disorder; 2) head injury with unconsciousness lasting >30 minutes; 3) learning disability; 4) current substance abuse or dependence as defined by the DSM-IV11; 5) history of opportunistic brain infection; 6) non-English primary language; or 7) implanted metal or conditions (e.g., claustrophobia) precluding MRI. Participants underwent clinical evaluation, blood draws for PBMC HIV DNA assays, and neuroimaging. Specimens were obtained and stored at study entry. Plasma HIV RNA and CD4 cell counts were performed by a local commercial CLIA-certified laboratory. Nadir CD4 count and years since HIV diagnosis were determined by subject self-report. Current cART CNS penetration effectiveness (CPE) scores were computed by summing the CPE rankings for individual drugs in a regimen.12
Standard protocol approvals, registrations, and patient consents.
Each subject provided written informed consent. The University of Hawaii Committee on Human Studies approved the study.
PBMC HIV DNA assessment.
HIV-infected cells in the bloodstream were quantitated by assessing the proviral HIV DNA load per 106 PBMCs. We conducted blood draws for PBMC HIV DNA copy assays within 30 days of MRI. HIV DNA assay was carried out as detailed elsewhere, with low intra-assay and interassay variability shown by mean coefficients of variation of 1.1% and 1.4%, respectively.7 We analyzed copy numbers of each sample gene (HIV gag and β-globin) against standard curves, and determined the HIV DNA copy number per 1 × 10⁶ cells. The lower limit of detection of PBMC HIV DNA was 10 copies/106 cells.
Neuroimaging.
Study participants underwent MRI and MRS on a 3.0-T Philips Medical Systems (Best, Netherlands) Achieva scanner equipped with an 8-channel head coil (InVision Imaging, Honolulu, HI). For each subject, a high-resolution anatomical volume was acquired with a sagittal T1-weighted 3D turbo field echo sequence (echo time/repetition time = 3.1 ms/6.7 ms; flip angle 8°; slice thickness 1.2 mm with no gap; in-plane resolution 1.0 mm2; field of view 256 × 256 mm2). MRS imaging parameters are given in appendix e-1 on the Neurology® Web site at www.neurology.org. Concentrations of Cr, Cho, MI, NAA, and Glu were measured by single-voxel MRS in left-hemisphere FWM, right basal ganglia, and posterior cingulate gray matter (figure e-1). Cho, MI, NAA, and Glu levels were reported as ratios over Cr (e.g., NAA/Cr).
Image processing.
MRS data processing is described in appendix e-1. We used FreeSurfer (version 4.5.0, http://www.nmr.mgh.harvard.edu/freesurfer) to process structural (T1-weighted) MRI scans.13–15 The procedure includes skull-stripping, intensity normalization, Talairach transformation, segmentation of subcortical white matter and deep gray matter, and cortical gray/white matter boundary and pial surface reconstruction. Quality assurance of FreeSurfer data processing was done by visual inspection, and cortical surfaces and subcortical segmentations were checked prior to group analysis. FreeSurfer's estimate of intracranial volume (ICV) is deemed a reliable measure for regional brain volume normalization.16 FreeSurfer is effective for subcortical volumetry in HIV-infected patients.17 Figure 1 displays FreeSurfer's labeling of subcortical gray matter structures in a U-HIV and a D-HIV study participant.
Figure 1. FreeSurfer's labeling of subcortical brain regions.

FreeSurfer's segmentation and labeling of subcortical brain regions for an HIV-infected subject with undetectable HIV DNA (A) and an HIV-infected subject with detectable HIV DNA (B) whose subcortical gray matter volumes, expressed as a percentage of intracranial volume, are at the median values for their respective groups. Enlarged ventricles and sulcal widening are visible in the brain of the individual with detectable peripheral blood mononuclear cell HIV DNA.
Statistical methods.
Our statistical analyses utilized Statview 5.0 (SAS Institute Inc., Cary, NC). Demographic and clinical characteristics were compared between HIV+ and SN subjects, and between the D-HIV and U-HIV groups, with Mann-Whitney or χ2 tests. For HIV+ individuals, we used logistic regression to evaluate effects of likely predictor variables on the binary outcome of HIV DNA detectability. Regional brain volumes were summed over hemispheres and normalized (scaled) by ICV to control for head size. We assessed group differences in normalized volumes using one-way analysis of covariance (ANCOVA) with age as a covariate. Only main effects of group and age were included unless group × age interaction was significant. When combined ANCOVA indicated significant or trend-level differences among U-HIV, D-HIV, and SN subjects, post hoc Fisher protected least significant difference (PLSD) tests were performed to correct for multiple pairwise group comparisons and to identify group differences that accounted for the overall p value. We examined possible effects of nadir CD4 count in post hoc U-HIV vs D-HIV comparisons. p < 0.05 was considered statistically significant and 0.05 ≤ p < 0.1 suggestive of trends.
ANCOVA, controlling for age, compared cerebral metabolite ratios among groups (all HIV+ vs SN; SN vs U-HIV; SN vs D-HIV; D-HIV vs U-HIV). A Bonferroni correction for 12 comparisons (4 metabolite ratios across 3 brain regions) was done at the 0.0042 (0.05/12) level of significance. Spearman correlation assessed relationships of brain volumes and metabolite ratios to HIV DNA level (for D-HIV subjects), current and nadir CD4 count, years since HIV diagnosis, and age.
RESULTS
Subject characteristics.
The HIV+ and SN groups did not differ significantly in age, education, or sex. U-HIV and D-HIV subjects had no significant differences in age, education, sex, race/ethnicity, current CD4 cell count, nadir CD4, CPE score, or years since HIV diagnosis (table 1). Plasma HIV RNA was undetectable (<50 copies/mL) in all but one HIV+ study participant, a subject in the D-HIV group with low-level plasma viremia (158 copies/mL). The study sample was predominantly non-Hispanic Caucasian but included 1 Filipino subject (SN), 2 Hispanic subjects (U-HIV), 4 Laotian subjects (1 U-HIV, 3 D-HIV), and 4 Asian Indians (1 SN, 3 D-HIV).
Table 1.
Demographic and clinical characteristics of HIV-seronegative (SN) control subjects, HIV-infected subjects with undetectable HIV DNA (U-HIV), and HIV-infected subjects with detectable HIV DNA (D-HIV)a
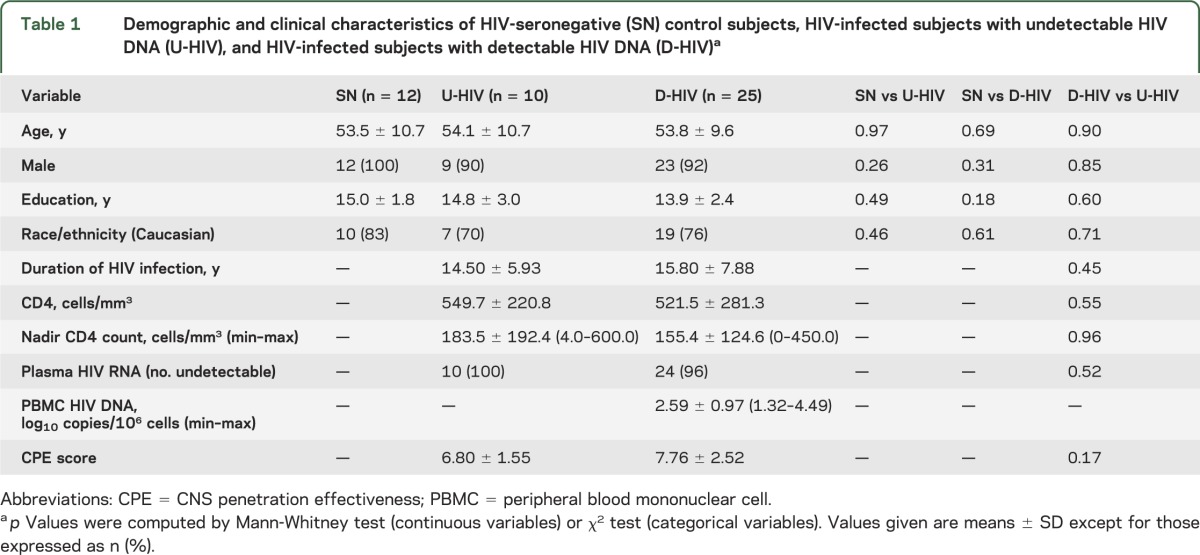
Age, education, sex, race/ethnicity, current and nadir CD4 cell counts, CPE score, and years since HIV diagnosis were entered into univariate logistic regression models as potential predictors of PBMC HIV DNA detectability in the HIV+ subjects. None of these variables was associated with detectable HIV DNA (p > 0.1).
HIV serostatus and regional brain volumes.
Two-sided ANCOVA of normalized regional volumes, with age as a covariate, showed that the pooled HIV+ subjects had smaller deep gray matter structures relative to the healthy control group. Volumetric reductions of 14% for amygdala (p = 0.007) and 10%–12% for the caudate nucleus (p = 0.006), thalamus (p = 0.01), hippocampus (p = 0.01), nucleus accumbens (p = 0.02), and putamen (p = 0.04) were associated with HIV seropositive status. Globus pallidus volume did not differ between HIV+ and SN subjects (−7%, p = 0.22). HIV+ individuals had larger lateral ventricles (+44%; p = 0.03) and decreased volumes of total subcortical gray matter (−9%; p = 0.04), brainstem (−10%, p = 0.03), and total cortical gray matter (−8%; p = 0.02).
HIV DNA and regional brain volumes.
Combined ANCOVA revealed significant or trend-level group differences among the SN, U-HIV, and D-HIV groups for normalized volumes of all brain regions examined except the globus pallidus and cerebellar white matter (table 2). Group-by-age interaction was significant (and included in the ANCOVA) only for lateral ventricular volume. Fisher PLSD tests were performed in post hoc pairwise comparisons to identify group differences that accounted for these p values. Total subcortical gray matter volume was greatest in SN controls, intermediate in the U-HIV group, and lowest in subjects with detectable HIV DNA (Cohen δ ∼0.9 relative to SN). Similar stepwise decreases were observed for total cortical gray matter, total cerebral white matter, brainstem, and individual subcortical gray matter structures (figure 2). Compared to controls, D-HIV subjects exhibited significant atrophy with strong Cohen δ effect sizes (∼0.8) in the nucleus accumbens and putamen, and with very large effect sizes (>1) in the caudate, hippocampus, thalamus, brainstem, and amygdala. The U-HIV group showed only trend-level, low to moderate volumetric decreases relative to SN for all of these structures except the amygdala (Cohen δ ∼1, p = 0.04). Lateral ventricles were larger in D-HIV than in SN subjects (Cohen δ ∼0.8).
Table 2.
Regional brain volumes expressed as percentage of total intracranial volume for HIV-seronegative (SN) controls, HIV-infected subjects with undetectable PBMC HIV DNA (U-HIV), and HIV-infected subjects with detectable PBMC HIV DNA (D-HIV)a
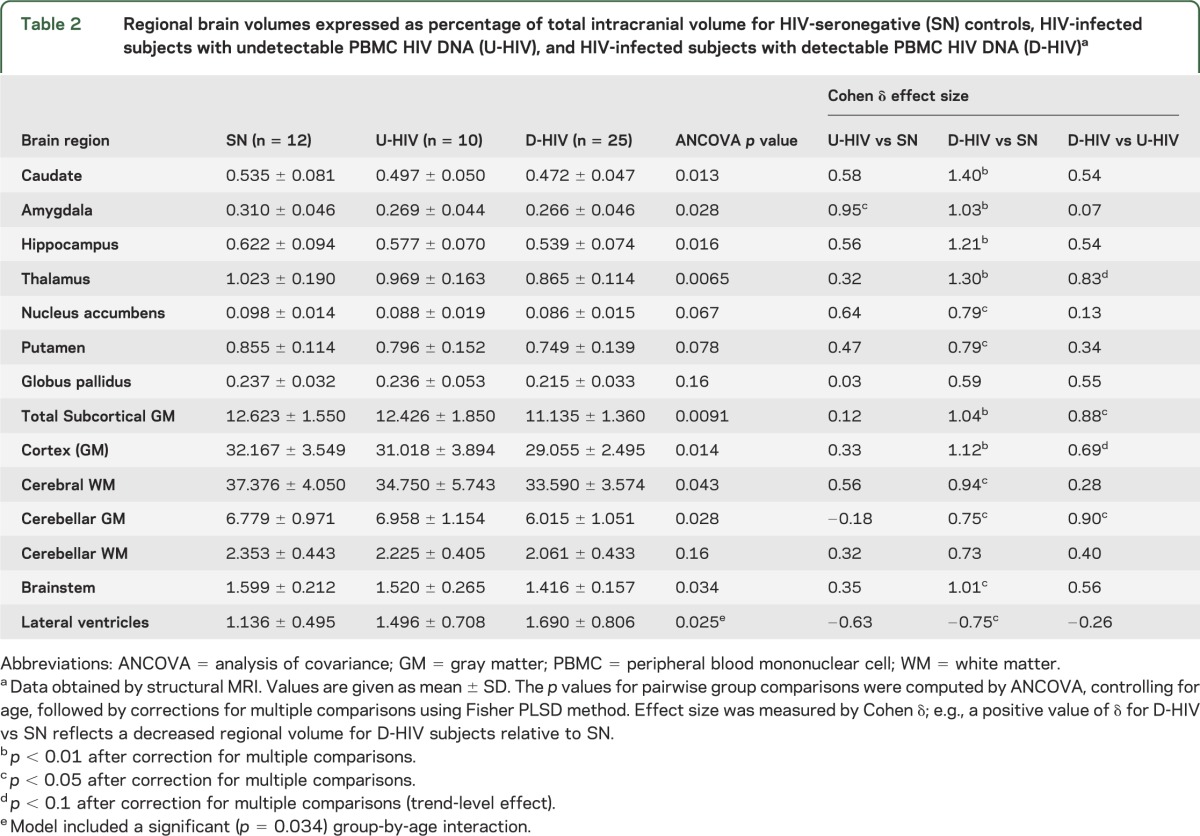
Figure 2. Regional brain volumes and group differences.

Regional brain volumes (as % total intracranial volume [ICV]) for HIV-seronegative controls (SN), HIV+ subjects with undetectable peripheral blood mononuclear cell (PBMC) HIV DNA (U-HIV), and HIV+ subjects with detectable PBMC HIV DNA (D-HIV). Significant group differences are given for normalized volumes of (A) nucleus accumbens, caudate, hippocampus, putamen, thalamus, brainstem, and lateral ventricles; and (B) total subcortical gray matter (GM), cerebellar GM, cortex, and cerebral white matter (WM). p Values were computed by analysis of covariance, controlling for age, and were corrected for multiple comparisons.
Compared to the U-HIV group, D-HIV subjects demonstrated significantly reduced cerebellar gray matter volume and total subcortical gray matter volume (Cohen δ ∼0.9). Volume differences between the D-HIV and U-HIV groups did not reach statistical significance for individual subcortical gray matter structures. However, D-HIV subjects showed trends toward decreased volumes of thalamus (p = 0.053) and total cortical gray matter (p = 0.086) relative to U-HIV, with moderately large effect sizes (∼0.7–0.8).
When tested as a covariate in the ANCOVA (both with and without age) for U-HIV vs D-HIV group comparisons, nadir CD4 had no significant or trend effect on any volume. Spearman correlation did not show associations between regional brain volumes and PBMC HIV DNA level in D-HIV subjects (p > 0.1). We found no significant correlation of volumes with current or nadir CD4 cell counts or with years since diagnosis in either the U-HIV or D-HIV group. Age correlated with lateral ventricular volume in the SN (p = 0.006; ρ = 0.83) and U-HIV (p = 0.005; ρ = 0.94) groups, but not in the D-HIV group (p = 0.16; ρ = 0.29).
HIV serostatus, HIV DNA, and cerebral metabolite ratios.
FWM Glu/Cr was elevated in pooled HIV+ study participants (+14% compared to SN, p = 0.032). Table e-1 presents results (uncorrected for multiple comparisons) from ANCOVA of metabolite ratios. Metabolite group differences did not meet Bonferroni-adjusted criteria for significance (p < 0.0042) or trends (p < 0.0083 = 0.1/12).
DISCUSSION
We observed that detectability of PBMC HIV DNA in HIV+ subjects with suppressed plasma viremia was associated with marked volumetric reductions of cerebellar and subcortical gray matter. These results were supported by lateral ventricular dilatation reflecting central atrophy. In comparison to healthy controls, subjects with detectable HIV DNA had significantly smaller volumes of caudate, putamen, thalamus, nucleus accumbens, hippocampus, brainstem, total cerebral white matter, and cortex. The HIV+ group with undetectable HIV DNA did not exhibit such decreases, showing that regional brain volume differences between pooled HIV+ subjects and SN controls were driven by the D-HIV group.
In cART-treated patients, imaging studies associate HIV infection with shrinkage of the basal ganglia,18 thalamus,19 hippocampus,20 cerebellum,21 cortex,22 and white matter19; i.e., brain regions in which we have identified volumetric reductions related to HIV DNA. Our findings of smaller brainstem and nucleus accumbens in the pooled HIV+ and D-HIV subjects are novel. We found only one published reference (from the pre-cART era) to HIV-related brainstem atrophy.9 Also, although increased apathy may correlate with nucleus accumbens volumetric reduction in HIV-infected individuals,10 decreased nucleus accumbens volume in HIV relative to SN controls has not been reported. Structural changes in these 2 regions are likely to have autonomic and behavioral consequences. HIV+ patients on cART demonstrate autonomic dysfunction,23 which may relate to altered brainstem volume. The nucleus accumbens, through the dopamine system, appears to modulate both normal and pathologic cognitive function.24
Disturbances in brain metabolite levels begin soon after infection by HIV.25 MRS-derived changes reflecting impaired neuronal function and neuronal damage persist in chronic stable disease.3 The pattern of biochemical change points to the occurrence of HIV-induced neuroinflammation prior to substantial loss of neurons. Both neuroasymptomatic HIV+ individuals and patients with HAND exhibit elevated NAA/Cr and Cho/Cr, signifying inflammatory responses.3 In contrast, decreases in NAA, a neuronal marker, are typically associated with HIV-related cognitive impairment3 and dementia,26 although reduced NAA has been detected in early HIV infection.27 MRS may be more sensitive than structural MRI to basal ganglia alterations in the initial stages of HAND.28 Metabolic alterations in CNS diseases generally precede structural change.29 We therefore anticipated brain abnormalities in our study participants to be revealed more readily by metabolites than by structure. The absence of MRS-based differences between the D-HIV and U-HIV groups was surprising. Given the regional volumetric differences associated with HIV DNA detectability, the D-HIV subjects might be expected to manifest increased MI/Cr, a correlate of blood–brain barrier (BBB) compromise in HIV,30 or reduced NAA/Cr. It is possible that we failed to identify true associations between brain metabolite levels and HIV DNA due to inadequate statistical power or to the dependence of single-voxel MRS on voxel position. Future work should employ magnetic resonance spectroscopic imaging, the multivoxel counterpart of MRS that is perhaps better suited for detecting regionally specific brain metabolic changes in HIV.26
FWM Glu/Cr was higher in our pooled HIV+ subjects than in controls, though the increase did not reach statistical significance after correction for multiple comparisons. Few MRS studies have measured brain Glu alone rather than the combined signal from glutamate and glutamine. One group observed reduced Glu in FWM of HIV+ patients.31 However, Glu in plasma and CSF is elevated in HIV dementia, with CSF Glu correlating to brain atrophy and dementia severity.32 Glutamate regulation by HIV is poorly understood. Activated HIV-infected macrophages secrete Glu that mediates neurotoxicity and may lead to impaired cognition.33 Significant brain Glu increases, measured in vivo by MRS, have directly implicated glutamate-mediated toxicity in neuronal loss associated with feline immunodeficiency virus infection.34 If enhanced, MRS-derived Glu/Cr levels in our HIV+ participants may reflect elevated extracellular brain glutamate.
Transmigration of the BBB by activated monocytes is central to the hypothesized pathogenesis of HAND. HIV-infected/activated monocytes are believed to traffic into brain perivascular or Virchow-Robin spaces (VRS), where they differentiate into macrophages and release neurotoxins and inflammatory mediators that cause neuronal injury.35 Dilated VRS are present in HIV disease.36 In normal subjects, VRS are visible on MRI within basal ganglia, thalamus, midbrain, cerebellum, insular cortex and extreme capsule, hippocampus, along the optical tract, and in white matter.37 Enlarged VRS can develop along the cingulate gyrus.38 As in the present study, the majority of structural brain changes reported in HIV infection are localized to subcortical gray matter structures and white matter, adjacent to VRS. Previously we found that detectable PBMC HIV DNA was related to gray matter loss in the bilateral insula, cingulate cortex, and ventromedial prefrontal cortex near the optic tract.8 It is noteworthy that shrinkage associated with high PBMC HIV DNA occurs in brain regions that are located near perivascular spaces. Dilated VRS may mark BBB breakdown and neuroinflammation39 as well as loss of surrounding brain tissue.40 The severity of HAND correlates with BBB disruption.30 Our results support an etiology for HAND involving a peripheral blood viral reservoir and the accumulation of HIV-infected PBMCs in brain perivascular spaces.
The viral reservoir in the brain is probably established during acute seroconversion.25 HIV-infected cells in VRS enter the brain parenchyma to instigate inflammatory responses leading to neuronal loss. We hypothesize that when HIV DNA in PBMCs is elevated, these blood cells continually replenish and expand the brain perivascular reservoir, resulting in pronounced atrophy of proximate brain regions. Thus HIV reservoirs in both peripheral blood and VRS may contribute to regional brain volumetric decreases, with greater reductions occurring in individuals with detectable PBMC HIV DNA, as seen in our cohort. Augmented atrophy associated with HIV DNA may obscure age-related brain parenchymal loss, consistent with our finding that lateral ventricular expansion correlated with older age only in the SN and U-HIV groups.
Longer duration of HIV DNA detectability should in such a scenario correlate positively with brain atrophy. We were unable to examine this relationship as we lacked data on longitudinal progression of participants' HIV DNA levels, including (in the U-HIV group) the time taken for HIV DNA to fall below the threshold of detectability. Our study was also limited by its modest sample size. Duration of untreated HIV infection, duration of plasma HIV RNA detectability, and mode of HIV transmission were unknown. We could not control for differences in disease progression between D-HIV and U-HIV groups, a potential source of bias. Longitudinal studies must clarify the impact of HIV-infected PBMCs and peripheral blood monocyte subsets on brain structure. Nevertheless, locations of the affected regions indicate involvement of activated, HIV-infected macrophages that accumulate in Virchow-Robin spaces upon entry from the periphery. The association between elevated PBMC HIV DNA and subcortical and cerebellar gray matter atrophy may elucidate the mechanism of brain structural and cognitive changes that persist in the setting of optimal cART, and may inform therapeutic approaches targeting depletion of HIV-infected cells in peripheral blood.
Supplementary Material
ACKNOWLEDGMENT
The authors thank the study participants, Nancy Hanks and the staff at InVision Imaging for support and assistance, and Dr. Margaret Keller for comments.
GLOSSARY
- ANCOVA
analysis of covariance
- BBB
blood–brain barrier
- cART
combination antiretroviral therapy
- Cho
choline
- CPE
CNS penetration effectiveness
- Cr
creatine
- D-HIV
HIV+ subjects with detectable peripheral blood mononuclear cells HIV DNA
- DSM-IV
Diagnostic and Statistical Manual of Mental Disorders, 4th edition
- FWM
frontal white matter
- Glu
glutamate
- HAND
HIV-associated neurocognitive disorders
- ICV
intracranial volume
- MI
myo-inositol
- MRS
magnetic resonance spectroscopy
- NAA
N-acetylaspartate
- PBMC
peripheral blood mononuclear cell
- PLSD
protected least significant difference
- SN
seronegative
- U-HIV
HIV+ infected subjects with undetectable peripheral blood mononuclear cells HIV DNA
- VRS
Virchow-Robin spaces
Footnotes
Supplemental data at www.neurology.org
AUTHOR CONTRIBUTIONS
Kalpana J. Kallianpur: writing of manuscript, data processing, analysis, and interpretation. Cecilia Shikuma: study supervision, study concept and design. Gregory R. Kirk: interpretation, critical revision of manuscript for intellectual content. Bruce Shiramizu: acquisition of data, critical revision of manuscript. Victor Valcour: critical revision of the manuscript for important intellectual content. Dominic Chow: analysis and interpretation, critical revision of manuscript. Scott Souza: data interpretation, critical revision of manuscript. Beau Nakamoto: study design, critical revision of manuscript for intellectual content. Napapon Sailasuta: study concept and design, acquisition of data, interpretation.
STUDY FUNDING
Supported by the NIH (U19MH081835, P20RR011091, U54RR026136 [RMATRIX], U54MD007584 [RMATRIX], R01NS061696 [V. Valcour], and R01NS053345 [B. Shiramizu]).
DISCLOSURE
K. Kallianpur is funded by NIH grants U19MH081835, U54RR026136, and U54MD007584. C. Shikuma is funded by NIH grants U54RR026136, R01NS063932, R01HL095135, U19MH081835, R01AI074554, R01NS061696, and MD00173, and receives research support from Merck, Gilead, and ViiV. G. Kirk is funded by NIH grants P50 MH84051, P50 MH84051, 1RC1MH090912, P50 MH84051, and K01 MH086787. B. Shiramizu is funded by NIH grant R01NS053345. V. Valcour is funded by NIH grants R01NS061696, R01MH089722, R01MH095613, R01NS053359, and R01 NS063932. He also receives travel support from the International AIDS Society–USA to provide Continuing Medical Education seminars. D. Chow is funded by NIH grants U54RR026136, U54MD007584, R01HL095135, and K23HL088981. S. Souza and B. Nakamoto report no disclosures. N. Sailasuta is funded by NIH grant K25DA2111. Go to Neurology.org for full disclosures.
REFERENCES
- 1.Sacktor N, Lyles RH, Skolasky R, et al. HIV-associated neurologic disease incidence changes: multicenter AIDS Cohort Study, 1990–1998. Neurology 2001;56:257–260 [DOI] [PubMed] [Google Scholar]
- 2.Heaton RK, Clifford DB, Franklin DR, Jr, et al. HIV-associated neurocognitive disorders persist in the era of potent antiretroviral therapy: CHARTER Study. Neurology 2010;75:2087–2096 [DOI] [PMC free article] [PubMed] [Google Scholar]
- 3.Harezlak J, Buchthal S, Taylor M, et al. Persistence of HIV-associated cognitive impairment, inflammation, and neuronal injury in era of highly active antiretroviral treatment. AIDS 2011;25:625–633 [DOI] [PMC free article] [PubMed] [Google Scholar]
- 4.Shiramizu B, Ratto-Kim S, Sithinamsuwan P, et al. HIV DNA and dementia in treatment-naive HIV-1-infected individuals in Bangkok, Thailand. Int J Med Sci 2007;4:13–18 [DOI] [PMC free article] [PubMed] [Google Scholar]
- 5.Valcour VG, Shiramizu BT, Sithinamsuwan P, et al. HIV DNA and cognition in a Thai longitudinal HAART initiation cohort: the SEARCH 001 Cohort Study. Neurology 2009;72:992–998 [DOI] [PMC free article] [PubMed] [Google Scholar]
- 6.Valcour VG, Shiramizu BT, Shikuma CM. HIV DNA in circulating monocytes as a mechanism to dementia and other HIV complications. J Leukoc Biol 2010;87:621–626 [DOI] [PMC free article] [PubMed] [Google Scholar]
- 7.Shiramizu B, Gartner S, Williams A, et al. Circulating proviral HIV DNA and HIV-associated dementia. AIDS 2005;19:45–52 [DOI] [PMC free article] [PubMed] [Google Scholar]
- 8.Kallianpur KJ, Kirk GR, Sailasuta N, et al. Regional cortical thinning associated with detectable levels of HIV DNA. Cereb Cortex 2012;22:2065–2075 [DOI] [PMC free article] [PubMed] [Google Scholar]
- 9.Elovaara I, Poutiainen E, Raininko R, et al. Mild brain atrophy in early HIV infection: the lack of association with cognitive deficits and HIV-specific intrathecal immune response. J Neurol Sci 1990;99:121–136 [DOI] [PubMed] [Google Scholar]
- 10.Paul RH, Brickman AM, Navia B, et al. Apathy is associated with volume of the nucleus accumbens in patients infected with HIV. J Neuropsychiatry Clin Neurosci 2005;17:167–171 [DOI] [PMC free article] [PubMed] [Google Scholar]
- 11.American Psychiatric Association Diagnostic and statistical manual of mental disorders, 4th ed Washington, DC: American Psychiatric Publishing; 1994 [Google Scholar]
- 12.Letendre SL, Ellis RJ, Ances BM, McCutchan JA. Neurologic complications of HIV disease and their treatment. Top HIV Med 2010;18:45–55 [PMC free article] [PubMed] [Google Scholar]
- 13.Dale AM, Fischl B, Sereno MI. Cortical surface-based analysis: I: segmentation and surface reconstruction. Neuroimage 1999;9:179–194 [DOI] [PubMed] [Google Scholar]
- 14.Fischl B, Sereno MI, Dale AM. Cortical surface-based analysis: II: inflation, flattening, and a surface-based coordinate system. Neuroimage 1999;9:195–207 [DOI] [PubMed] [Google Scholar]
- 15.Fischl B, van der Kouwe A, Destrieux C, et al. Automatically parcellating the human cerebral cortex. Cereb Cortex 2004;14:11–22 [DOI] [PubMed] [Google Scholar]
- 16.Buckner RL, Head D, Parker J, et al. A unified approach for morphometric and functional data analysis in young, old, and demented adults using automated atlas-based head size normalization: reliability and validation against manual measurement of total intracranial volume. Neuroimage 2004;23:724–738 [DOI] [PubMed] [Google Scholar]
- 17.Dewey J, Hana G, Russell T, et al. Reliability and validity of MRI-based automated volumetry software relative to auto-assisted manual measurement of subcortical structures in HIV-infected patients from a multisite study. Neuroimage 2010;51:1334–1344 [DOI] [PMC free article] [PubMed] [Google Scholar]
- 18.Becker JT, Sanders J, Madsen SK, et al. Subcortical brain atrophy persists even in HAART-regulated HIV disease. Brain Imaging Behav 2011;5:77–85 [DOI] [PMC free article] [PubMed] [Google Scholar]
- 19.Chiang MC, Dutton RA, Hayashi KM, et al. 3D pattern of brain atrophy in HIV/AIDS visualized using tensor-based morphometry. Neuroimage 2007;34:44–60 [DOI] [PMC free article] [PubMed] [Google Scholar]
- 20.Archibald SL, Masliah E, Fennema-Notestine C, et al. Correlation of in vivo neuroimaging abnormalities with postmortem human immunodeficiency virus encephalitis and dendritic loss. Arch Neurol 2004;61:369–376 [DOI] [PubMed] [Google Scholar]
- 21.Klunder AD, Chiang MC, Dutton RA, et al. Mapping cerebellar degeneration in HIV/AIDS. Neuroreport 2008;19:1655–1659 [DOI] [PMC free article] [PubMed] [Google Scholar]
- 22.Thompson PM, Dutton RA, Hayashi KM, et al. Thinning of the cerebral cortex visualized in HIV/AIDS reflects CD4+ T lymphocyte decline. Proc Natl Acad Sci USA 2005;102:15647–15652 [DOI] [PMC free article] [PubMed] [Google Scholar]
- 23.Askgaard G, Kristoffersen US, Mehlsen J, Kronborg G, Kjaer A, Lebech AM. Decreased heart rate variability in HIV positive patients receiving antiretroviral therapy: importance of blood glucose and cholesterol. PLoS One 2011;6:e20196. [DOI] [PMC free article] [PubMed] [Google Scholar]
- 24.Salamone JD, Correa M, Mingote SM, Weber SM. Beyond the reward hypothesis: alternative functions of nucleus accumbens dopamine. Curr Opin Pharmacol 2005;5:34–41 [DOI] [PubMed] [Google Scholar]
- 25.Valcour V, Chalermchai T, Sailasuta N, et al. Central nervous system viral invasion and inflammation during acute HIV infection. J Infect Dis 2012;206:275–282 [DOI] [PMC free article] [PubMed] [Google Scholar]
- 26.Sacktor N, Skolasky RL, Ernst T, et al. A multicenter study of two magnetic resonance spectroscopy techniques in individuals with HIV dementia. J Magn Reson Imaging 2005;21:325–333 [DOI] [PubMed] [Google Scholar]
- 27.Lentz MR, Kim WK, Lee V, et al. Changes in MRS neuronal markers and T cell phenotypes observed during early HIV infection. Neurology 2009;72:1465–1472 [DOI] [PMC free article] [PubMed] [Google Scholar]
- 28.Paul RH, Ernst T, Brickman AM, et al. Relative sensitivity of magnetic resonance spectroscopy and quantitative magnetic resonance imaging to cognitive function among nondemented individuals infected with HIV. J Int Neuropsychol Soc 2008;14:725–733 [DOI] [PMC free article] [PubMed] [Google Scholar]
- 29.Fayed N, Olmos S, Morales H, Modrego PJ. Physical basis of magnetic resonance spectroscopy and its application to central nervous system diseases. Am J Appl Sci 2006;3:1836–1845 [Google Scholar]
- 30.Avison MJ, Nath A, Greene-Avison R, Schmitt FA, Greenberg RN, Berger JR. Neuroimaging correlates of HIV-associated BBB compromise. J Neuroimmunol 2004;157:140–146 [DOI] [PubMed] [Google Scholar]
- 31.Sailasuta N, Shriner K, Ross B. Evidence of reduced glutamate in the frontal lobe of HIV-seropositive patients. NMR Biomed 2009;22:326–331 [DOI] [PubMed] [Google Scholar]
- 32.Ferrarese C, Aliprandi A, Tremolizzo L, et al. Increased glutamate in CSF and plasma of patients with HIV dementia. Neurology 2001;57:671–675 [DOI] [PubMed] [Google Scholar]
- 33.Jiang ZG, Piggee C, Heyes MP, et al. Glutamate is a mediator of neurotoxicity in secretions of activated HIV-1-infected macrophages. J Neuroimmunol 2001;117:97–107 [DOI] [PubMed] [Google Scholar]
- 34.Power C, Moench T, Peeling J, Kong PA, Langelier T. Feline immunodeficiency virus causes increased glutamate levels and neuronal loss in brain. Neuroscience 1997;77:1175–1185 [DOI] [PubMed] [Google Scholar]
- 35.Kaul M, Garden GA, Lipton SA. Pathways to neuronal injury and apoptosis in HIV-associated dementia. Nature 2001;410:988–994 [DOI] [PubMed] [Google Scholar]
- 36.Corti M, Villafane MF, Negroni R, Arechavala A, Maiolo E. Magnetic resonance imaging findings in AIDS patients with central nervous system cryptococcosis. Rev Iberoam Micol 2008;25:211–214 [DOI] [PubMed] [Google Scholar]
- 37.Groeschel S, Chong WK, Surtees R, Hanefeld F. Virchow-Robin spaces on magnetic resonance images: normative data, their dilatation, and a review of the literature. Neuroradiology 2006;48:745–754 [DOI] [PubMed] [Google Scholar]
- 38.Fayeye O, Pettorini BL, Foster K, Rodrigues D. Mesencephalic enlarged Virchow-Robin spaces in a 6-year-old boy: a case-based update. Childs Nerv Syst 2010;26:1155–1160 [DOI] [PubMed] [Google Scholar]
- 39.Wuerfel J, Haertle M, Waiczies H, et al. Perivascular spaces–MRI marker of inflammatory activity in the brain? Brain 2008;131:2332–2340 [DOI] [PubMed] [Google Scholar]
- 40.Barkhof F. Enlarged Virchow-Robin spaces: do they matter? J Neurol Neurosurg Psychiatry 2004;75:1516–1517 [DOI] [PMC free article] [PubMed] [Google Scholar]
Associated Data
This section collects any data citations, data availability statements, or supplementary materials included in this article.