

Abstract
Premature infants in neonatal intensive care units (NICUs) are highly susceptible to infection due to the immaturity of their immune systems, and nosocomial infections are a significant risk factor for death and poor neurodevelopmental outcome in this population. To investigate the impact of cleaning within a NICU, a high-throughput short-amplicon-sequencing approach was used to profile bacterial and fungal surface communities before and after cleaning. Intensive cleaning of surfaces in contact with neonates decreased the total bacterial load and the percentage of Streptococcus species with similar trends for total fungal load and Staphylococcus species; this may have clinical relevance since staphylococci and streptococci are the most common causes of nosocomial NICU infections. Surfaces generally had low levels of other taxa containing species that commonly cause nosocomial infections (e.g., Enterobacteriaceae) that were not significantly altered with cleaning. Several opportunistic yeasts were detected in the NICU environment, demonstrating that these NICU surfaces represent a potential vector for spreading fungal pathogens. These results underline the importance of routine cleaning as a means of managing the microbial ecosystem of NICUs and of future opportunities to minimize exposures of vulnerable neonates to potential pathogens and to use amplicon-sequencing tools for microbial surveillance and hygienic testing in hospital environments.
INTRODUCTION
Premature infants in neonatal intensive care units (NICUs) are highly vulnerable to infections due to the immaturity of virtually every aspect of their innate and adaptive immune systems. The importance of hospital surfaces and the cleaning of these surfaces in interrupting outbreaks of specific organisms in NICUs (1, 2) and in eliminating reservoirs of potential pathogens (3–5) has been emphasized. However, most studies to date have relied on culture-based techniques, which can give incomplete and biased assessments of mixed microbial communities (6).
The increasing ease and decreasing costs of high-throughput short-amplicon-sequencing technologies are propelling efforts to describe the microbial communities of surfaces on a massive scale (7). By parallel sequencing of short amplicons, typically 16S rRNA genes in bacteria and internal transcribed spacer (ITS) domains in fungi (8), it is possible to comprehensively profile the microbial composition of diverse environments. Microbial communities in intensive care units (ICUs) (9), hospitals (10), public restrooms (11), wineries (12), and office spaces (13) have been explored using high-throughput amplicon sequencing, advancing our knowledge of microbial trafficking and colonization in these systems. A recent report on bacterial communities on the surfaces in two NICUs demonstrated significant diversity and supported the hypothesis that colonies of pathogens on NICU surfaces may increase the risk of infection for premature infants (14).
Stringent cleaning protocols for the surfaces in NICUs have been in place for many years, but the efficacy of specific approaches has been investigated only with culture techniques (15). Using amplicon sequencing and quantitative PCR (qPCR), we tested the impact of cleaning on the diversity and abundance of bacterial and fungal communities inhabiting NICU surfaces. We hypothesized that the intense cleaning of equipment following contact with a neonate would decrease the numbers of potentially pathogenic bacteria. For comparison, we also did repeat testing over time of inanimate surfaces that are cleaned less vigorously, and we tested disposable items before and after contact with neonates.
MATERIALS AND METHODS
Data availability.
The sequencing data sets generated in this study are publicly available in the Quantitative Insights into Microbial Ecology (QIIME) database (www.microbio.me/qiime/) as study identification number 1797 (fungal sequencing run) and study identification number 1798 (bacterial sequencing run).
Cleaning procedures in the NICU. (i) Intensive cleaning.
When a piece of equipment (isolette, radiant warmer, etc.) was no longer needed for an infant, it was cleaned by the housekeeping staff with a liquid solution (3M Quat disinfectant 25H [active ingredients, 13% n-alkyl dimethyl ethylbenzyl ammonium chloride and 13% n-alkyl dimethyl benzyl ammonium chloride]) on a soft cloth.
(ii) Routine cleaning.
At the beginning of each 12-h shift, a registered nurse (RN) washed his or her hands, put on nonsterile gloves, and wiped surfaces (computers, computer mice, tables, cribs, monitors, etc.) with an antibacterial wipe (PDI Super Sani-Cloth germicidal disposable wipe [active ingredients, 0.25% n-alkyl dimethyl ethylbenzyl ammonium chloride and 0.25% n-alkyl dimethyl benzyl ammonium chloride]). The only surfaces not cleaned with the antibacterial wipes were the isolettes, which were cleaned with a soft cloth moistened with water. Each stethoscope remained at a given bedside and then was cleaned with an alcohol wipe after the baby in that bed was discharged.
Disposable items (e.g., tubing, nose pieces for continuous positive airway pressure [CPAP] machines, pacifiers, and suction catheters) were not cleaned or reused.
Sample collection and DNA extraction.
A total of 147 samples were collected from the NICU at UC Davis Children's Hospital (Sacramento, CA) by a single investigator from August to December 2012. Multiple sites on three isolettes, two radiant warmers, and one ventilator were sampled before and after intensive cleaning. A list of all sites tested is included in Table S1 in the supplemental material, and the sites are illustrated in Fig. 1.
Fig 1.

Key to surface swab samples. The neonate-associated surfaces (top) were sampled before and after intensive cleaning. Disposable items (tubing, nose pieces, pacifiers, and suction catheters) were sampled when new and after use. Environmental surfaces of the room (bottom) were sampled four times at weekly intervals, unrelated to the timing of routine cleaning.
The surfaces were sampled with sterile cotton-tipped swabs (Covidien, Mansfield, MA). The swabs were moistened with sterile phosphate-buffered saline and streaked across a 4-in2 area (or the entire surface for surfaces of <4 in2) in two perpendicular series of firm overlapping S strokes; swabs were rotated to ensure full contact of all parts of the swab tip and the surface. Swab tips were snapped off into sterile 1.5-ml polyethylene tubes against the inner edge of the tube without manual contact. The samples were frozen immediately in a −40°C freezer for storage. The cotton tip of each swab was aseptically removed from the shaft and placed directly into the 96-well lysis plate provided in the ZR-96 fecal DNA extraction kit (Zymo Research, Irvine, CA). DNA was extracted using the standard protocol for the ZR-96 kit, with bead beating done with a Geno/Grinder high-throughput tissue homogenizer (SPEX SamplePrep, Metuchen, NJ), and stored at −20°C until further processing.
Sequencing library construction.
Amplification and sequencing were performed as described previously for bacterial (16) and fungal communities (8). Briefly, the V4 domain of bacterial 16S rRNA genes was amplified using the primers F515 (5′-NNNNNNNNGTGTGCCAGCMGCCGCGGTAA-3′) and R806 (5′-GGACTACHVGGGTWTCTAAT-3′) (17), with the forward primer modified to contain a unique 8-nucleotide (nt) barcode (italicized poly-N section of the F515 primer) and a 2-nt linker sequence (the bold underlined portion of the F515 primer) at the 5′ terminus. The PCR mixtures contained 5 to 100 ng DNA template, 1× GoTaq green master mix (Promega, Madison, WI), 1 mM MgCl2, and 2 pmol of each primer. The reaction conditions consisted of an initial 94°C for 3 min, followed by 35 cycles of 94°C for 45 s, 50°C for 60 s, and 72°C for 90 s, and a final extension of 72°C for 10 min. Fungal internal transcribed spacer (ITS)-1 loci were amplified with the primers BITS (5′-NNNNNNNNCTACCTGCGGARGGATCA-3′) and B58S3 (5′-GAGATCCRTTGYTRAAAGTT-3′) (8), with a unique 8-nt barcode and linker sequence incorporated in each forward primer. The PCR mixtures contained 5 to 100 ng DNA template, 1× GoTaq green master mix (Promega), 1 mM MgCl2, and 2 pmol of each primer. The reaction conditions consisted of an initial 95°C for 2 min, followed by 40 cycles of 95°C for 30 s, 55°C for 30 s, and 72°C for 60 s, and a final extension of 72°C for 5 min. Amplicons were combined into two separate pooled samples (keeping the bacterial and fungal amplicons separate) at equal ratios, purified using the QIAquick spin kit (Qiagen), and submitted to the UC Davis Genome Center DNA Technologies Core for Illumina paired-end library preparation, cluster generation, and 250-bp paired-end sequencing on an Illumina MiSeq instrument in two separate runs.
Data analysis.
The raw FASTQ files were demultiplexed, quality filtered, and analyzed using QIIME 1.6.0 (18). The 250-bp sequences were truncated at any site of more than three sequential bases receiving a quality score of <20, and any sequence containing ambiguous base calls or barcode/primer errors was discarded, as were sequences with <75% (of total read length) consecutive high-quality base calls (19). For the ITS sequences, the primer sequences were trimmed from the ends of each sequence, and operational taxonomic units (OTUs) were clustered de novo using the QIIME implementation of UCLUST (20), with a threshold of 97% pairwise identity. The bacterial 16S rRNA gene sequences were clustered using the QIIME subsampled reference OTU-picking pipeline with the UCLUST reference 20 against the Greengenes 16S rRNA gene database (February 2011 release) (21), clustered at 97% pairwise identity. The OTUs were classified taxonomically using a QIIME-based wrapper of BLAST (22) against the Greengenes 16S rRNA gene database (for 16S rRNA gene sequences) or the UNITE (23, 24) database (for ITS sequences), modified as described previously (8). Any OTU comprising <0.0001% of the total sequences for each run was removed prior to further analysis, calibrating against the defined mock communities included in both sequencing runs (19). The bacterial 16S rRNA gene sequences were aligned using PyNAST (25) against a reference alignment of the Greengenes core set (21). From this alignment, chimeric sequences were identified and removed using ChimeraSlayer (26), and a phylogenic tree was generated from the filtered alignment using FastTree (27). Sequences that failed to be aligned or those identified as chimeras were removed prior to the downstream analysis. Any sample yielding less than 800 filtered sequences was removed prior to the diversity and statistical analyses.
Beta diversity estimates (between-sample diversity comparisons) were calculated within QIIME using the weighted UniFrac (28) distance between the samples for the bacterial 16S rRNA gene sequences (evenly sampled at 800 sequences per sample), subsampled 10 times without replacement. From these estimates, the principal coordinates were computed to compress dimensionality into three-dimensional principal coordinate analysis (PCoA) biplots.
In order to test whether routine cleaning resulted in significant differences in OTU diversity between time points and between the host-associated and environmental (room) surfaces, a permutational multivariate analysis of variance (MANOVA) (29) with 999 permutations was used to test (with the QIIME-wrapped R module Adonis) the null hypothesis that the sample groups were not statistically different based on the evenly sampled UniFrac distance. All other statistical tests were performed using R software. A one-way analysis of variance (ANOVA) was used to determine whether the relative abundances of known neonatal pathogens differed significantly between host-associated surfaces before and after cleaning, disposable items before and after use, and environmental surfaces over time. One-tailed paired-sample t tests were used to test whether the relative abundances of known neonatal pathogens differed significantly between host-associated surfaces before and after cleaning and between disposable items before and after use. Repeated-measures ANOVAs were used to test whether bacterial taxa differed significantly between weekly sampling time points for environmental samples from routinely cleaned rooms.
Environmental surveillance heat maps were generated based on taxonomic abundance tables generated in QIIME and visualized using SitePainter 1.1 (30).
Quantitative PCR.
In order to quantify net microbial biomasses on neonate-associated surfaces (isolettes, radiant warmers, ventilators, CPAP machines, stethoscopes, and pacifiers), quantitative PCRs (qPCRs) were used to enumerate the fungal and bacterial communities. qPCRs were performed in 20-μl reaction mixtures containing 2 μl of DNA template, 5 pmol of each respective primer, and 10 μl of TaKaRa SYBR 2× perfect real-time master mix (TaKaRa Bio, Inc.). For quantification of the fungal community, the primers YEASTF (5′-GAGTCGAGTTGTTTGGGAATGC-3′) and YEASTR (5′-TCTCTTTCCAAAGTTCTTTTCATCTT-3′) were used (31). The reaction conditions involved an initial step at 95°C for 10 min, followed by 40 cycles of 15 s at 95°C, 1 min at 60°C, and 30 s at 72°C. For amplification of the bacterial community, the primers Uni334F (5′-ACTCCTACGGGAGGCAGCAGT-3′) and Uni514R (5′-ATTACCGCGGCTGCTGGC-3′) (32) were used. The reaction conditions consisted of an initial hold at 95°C for 20 s, followed by 40 cycles of 4 s at 95°C and 25 s at 65.5°C. All reactions were performed in triplicate in optical-grade 96-well plates on an ABI Prism 7500 fast real-time PCR system (Applied Biosystems). The instrument automatically calculated cycle threshold (CT) values, efficiencies (E), confidence intervals, and cell concentrations (fungi) or 16S rRNA gene copy numbers (bacteria) by comparing sample threshold (CT) values to a standard curve of serially diluted genomic DNA extracted from a known concentration of Saccharomyces cerevisiae or Escherichia coli cells. One-tailed paired-sample t tests were calculated with R software to test significant differences between host-associated surfaces before and after cleaning and between disposable items before and after use. qPCR microbial biomass heat maps were generated using SitePainter 1.1 (30). Given the multiple comparisons performed, P values of <0.1 were reported, and P values of <0.01 were considered significant.
RESULTS
To address the question of how routine cleaning impacts the microbial ecosystem of a NICU, amplicon sequencing and qPCRs were used to profile the bacterial and fungal communities inhabiting both neonate-associated (isolettes, ventilators, CPAP machines, stethoscopes, nasal catheters, radiant warmers, and pacifiers) and nonassociated environmental (room) surfaces (Fig. 1).
All surfaces in the NICU supported complex bacterial communities, primarily dominated by members of the Gammaproteobacteria and Firmicutes (Fig. 2; see also Table S2 in the supplemental material). The neonate-associated surfaces were inhabited by sporadically elevated relative abundances of Streptococcus, Staphylococcus, Neisseria, and Enterobacteriaceae compared to those in the room environment, which exhibited higher abundances of Geobacillus, Halomonas, Shewanella, Acinetobacter, and Gemella, among other genera (Fig. 2). Most surfaces (especially the neonate-associated surfaces) failed to amplify with the fungal ITS primers, most likely because the fungal populations were below the limit of detection for this assay. The surfaces that did amplify displayed the presence of several yeasts, including Saccharomyces cerevisiae, Cryptococcus albidus, Debaryomyces fabryi, and Candida albicans (Fig. 3). S. cerevisiae was the most dominant fungus on these surfaces, exhibiting as much as 100% relative abundance on some surfaces (Fig. 3; see also Table S3 in the supplemental material).
Fig 2.

Microbial heat maps reveal bacterial distribution in the NICU. Heat maps of select, most abundant bacterial genera detected across each surface type using 16S rRNA gene amplicon sequencing are shown. The keys for each plot indicate the relative abundance scale from blue (absent/low) to red (high). Sites that appear white had bacterial DNA below the limit of detection for this assay.
Fig 3.

Microbial heat maps reveal fungal distribution in the NICU. Heat maps of select, most abundant fungal genera detected across each surface type using ITS amplicon sequencing are shown. The keys for each plot indicate the relative abundance scale from blue (absent/low) to red (high). Sites that appear white had fungal DNA below the limit of detection for this assay.
Table 1 summarizes the relative abundances of the bacterial and fungal taxa detected on the NICU surfaces known to contain the pathogens most commonly associated with neonatal disease outbreaks (33). Table 2 summarizes the most common organisms grown from blood cultures in this NICU in the years 2011 and 2012. Cleaning resulted in significantly (P = 0.0022) decreased abundances of Streptococcus (Table 1). Staphylococcus and Streptococcus were more abundant on the neonate-associated surfaces than on nonassociated surfaces, which exhibited higher abundances of Acinetobacter and Pseudomonas (Table 1). Disposable items did not exhibit differences in the common NICU pathogens before or after exposure to the neonate with the exception of Acinetobacter, the abundance of which was similar to that of the microbiota of the nonclinical room surfaces before contact with the neonate and decreased afterward. The amplicon-sequencing protocol employed here did not differentiate the bacterial species, so not all of the genera detected necessarily represent pathogenic species. None of these taxa demonstrated significant changes on the environmental surfaces of the room for 4 weekly sampling times, but repeated-measures ANOVAs indicated that Limnohabitans (P = 0.008) changed significantly during this period, with trends also seen for Sphingomonadales (P = 0.033), Kaistobacter (P = 0.035), Skermanella (P = 0.018), Alteromonadales (P = 0.022), and Intrasporangiaceae (P = 0.028).
Table 1.
Relative abundances in this NICU of taxa associated with neonatal outbreaks
| Taxon | Relative abundances [mean (±SD)]: |
P valuea |
||||||
|---|---|---|---|---|---|---|---|---|
| Before intensive cleaning (n = 38) (A) | After intensive cleaning (n = 38) (B) | In the environment (routine cleaning) (n = 52) (C) | In disposables before contact (n = 6) (D) | In disposables after contact (n = 6) (E) | A > B (paired t test)b | D < E (paired t test) | A ≠ B ≠ C ≠ D ≠ E (one-way ANOVA) | |
| Staphylococcus | 0.0549 (±0.0804) | 0.0353 (±0.0671) | 0.0237 (±0.0260) | 0.0106 (±0.0051) | 0.1444 (±0.2358) | 0.07196 | 0.0891 | 0.0017 |
| Enterococcus | 0.0006 (±0.0019) | 0.0007 (±0.0020) | 0.0011 (±0.0046) | 0.0000 (±0.0001) | 0.0000 (±0.0001) | NS | NS | NS |
| Streptococcus | 0.0250 (±0.0445) | 0.0119 (±0.0217) | 0.0216 (±0.0317) | 0.0024 (±0.0004) | 0.1344 (±0.2805) | 0.0022 | NS | 0.0006 |
| Escherichia | 0.0003 (±0.0005) | 0.0004 (±0.0006) | 0.0003 (±0.0006) | 0.0005 (±0.0004) | 0.0004 (±0.0005) | NS | NS | NS |
| Klebsiella | 0.0005 (±0.0003) | 0.0005 (±0.0004) | 0.0005 (±0.0003) | 0.0005 (±0.0004) | 0.0003 (±0.0001) | NS | NS | NS |
| Acinetobacter | 0.0655 (±0.0240) | 0.0696 (±0.0199) | 0.0758 (±0.0303) | 0.0820 (±0.0107) | 0.0520 (±0.0311) | NS | 0.0095c | 0.0786 |
| Pseudomonas | 0.0166 (±0.0054) | 0.0199 (±0.0065) | 0.0221 (±0.0140) | 0.0201 (±0.0038) | 0.0159 (±0.0096) | 0.0233c | 0.0998c | NS |
| Candida albicans | 0 | 0 | 0.0346 | 0 | 0 | |||
NS, not significant (P < 0.1); the significance of Candida albicans was not tested, as fungal amplification was only possible from one sample of the room environment.
Only paired before and after the cleaning sites were tested (n = 70).
A < B; D > E.
Table 2.
Neonatal blood culture results, 2011-2012a
| Pathogen | No. of infants with positive cultures |
|---|---|
| Staphylococcus, coagulase negative | 24 |
| Staphylococcus aureus | 9 |
| Escherichia coli | 6 |
| Enterococcus species | 6 |
| Klebsiella pneumoniae | 4 |
| Streptococcus viridans group | 2 |
| Enterobacter cloacae | 2 |
| Other Gram-negative rod | 3 |
One patient had a positive blood culture for each of the following: Leuconostoc sp., Acinetobacter baumannii, Candida albicans, Candida parapsilosis, Listeria monocytogenes, Pseudomonas aeruginosa, Serratia marcescens, Streptococcus agalactiae (group B), Streptococcus anginosus group, and an unidentified yeast.
Beta diversity (between-sample community comparison) estimates are important ecological metrics for comparing the similarities of different samples based on species diversity. The abundance-weighted UniFrac PCoA of the bacterial communities revealed that the surface samples formed three clusters, neonate-associated surfaces after use (before cleaning) and before use (after cleaning) and nonassociated environmental surfaces in the room, associated with different bacterial taxa (Fig. 4A). A significant separation of these three groups was confirmed with a permutational MANOVA (P = 0.006). The precleaning and used disposable samples demonstrated diffuse clustering (Fig. 4A), due to the sporadic dominance of Streptococcus and Staphylococcus on these surfaces (Fig. 2), and this clustering appears associated with the abundance of Firmicutes, primarily Streptococcus, Staphylococcus, and Clostridium (Fig. 4A). After being cleaned, these surfaces clustered closer to environmental samples from the room and unused disposable samples, associated with the dominance of Acinetobacter, Enterobacteriaceae, Shewanella, and Halomonas (Fig. 4A). The separation of bacteria found in the environmental samples into a different cluster appears to be due to the association with the minor bacterial populations present in these samples, including those of Fusobacterium and Actinomyces (Fig. 4A).
Fig 4.
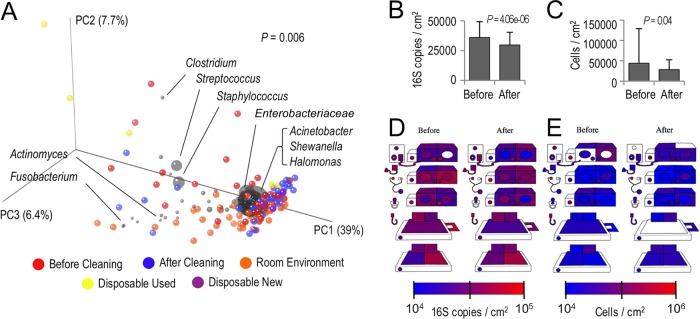
Cleaning drives shifts in microbial structures and abundances. (A) A weighted UniFrac PCoA biplot demonstrates the abundance-weighted clustering of clinical surfaces before cleaning (red) and after cleaning (blue), disposable items before (purple) and after use (yellow), and nonclinical surfaces in the room environment (orange). Each colored orb represents a single sample, and the proximity indicates the degree of similarity between individual samples. In this biplot, bacterial taxa are coplotted as gray orbs to indicate the association with different sample clusters; orb size is a function of the mean abundance. The P value in the top right corner indicates the result of a permutational MANOVA test comparing the bacterial community similarity of pre-/postcleaning and environmental sample groups. (B and C) qPCRs indicate drops in bacterial (B) and fungal (C) surface bioloads in response to cleaning. The error bars represent the standard deviation (SD); P values indicate the results of paired t tests. (D and E) Quantitative heat maps of clinical surfaces illustrate changes in bacterial (D) and fungal (E) bioloads on each surface, as determined by qPCRs. The keys for each plot indicate the absolute abundance scale from blue (absent/low) to red (high). Sites that appear white had DNA below the limit of detection for this assay.
To test whether cleaning also changed the microbial loads on the neonate-associated surfaces, qPCRs were used to enumerate the bacterial and fungal biomasses. Cleaning resulted in significant decreases in the numbers of bacteria (P = 0.000004) and similar decreases for fungi (P = 0.04) (Fig. 4B and C). All the surfaces exhibited low levels of bacterial (104 to 105 16S rRNA gene copies/cm2) and fungal (104 to 106 cells/cm2) biomasses, visualized in quantitative heat maps (Fig. 4D and E).
DISCUSSION
NICU surfaces contain delicate microbial ecosystems, heavily influenced by contact with their fragile residents—premature and sick neonates—who are innately vulnerable to opportunistic infections. It is impossible to operate these environments in complete sterility, as the infants themselves, the milk they consume, the adults caring for them, and the multiple pieces of equipment required for their care all represent fertile vectors for microbial transmission. Thus, cleaning regimens are necessary to prevent the retention and spread of virulent microbial pathogens in this sensitive environment.
To assess the impact of cleaning on bacterial and fungal communities of NICUs, amplicon sequencing and qPCRs were used to monitor the effect of cleaning on the microbial community structure and abundance on surfaces in a NICU. The results demonstrate that NICU surfaces have a large number of bacterial and fungal taxa that contain members associated with nosocomial infections in neonates, including Streptococcus, Staphylococcus, Neisseria, Pseudomonas, Escherichia, Enterococcus, and Acinetobacter and Candida albicans. It should be noted, however, that these genera also contain many species that are commensal bacteria in healthy humans, and the taxa detected here do not necessarily represent pathogenic strains. Several of these taxa, in particular Staphylococcus and Streptococcus, were detected at moderate levels on isolette and radiant warmer surfaces prior to cleaning. In addition to containing species associated with neonatal disease outbreaks (33), these two genera are also common human commensal bacteria of the skin and mucosal surfaces and have been detected previously in NICUs, where they are most likely deposited by skin contact (14). However, members of these two genera also represent the most prevalent causes of the infectious outbreaks identified in this NICU during the 2011-2012 period and are thus important targets for cleaning. Importantly, the intensive cleaning reduced both the relative abundance of Streptococcus and the absolute abundance of bacteria on all infant-associated surfaces, with similar trends for Staphylococcus and total numbers of fungi. However, the low surface levels of common NICU enteric genera (Enterococcus, Klebsiella, Escherichia, and Pseudomonas) were not significantly altered by this regimen. These data also suggest that the routine cleaning of environmental surfaces with antibacterial wipes is effective for keeping the numbers of potentially pathogenic bacteria in ranges similar to those of the surfaces that have undergone intensive cleaning. These results underline the importance of frequent cleaning to suppress the growth and retention of potential pathogens in NICU environments. Of note, the microbial abundances on newly opened disposable surfaces are similar to those of environmental surfaces prior to exposure to the neonate, and following contact with the neonate, the disposable surfaces are comparable in structures and abundances to nondisposable neonate-associated surfaces.
Infection outbreaks in NICUs differ from those of other hospital ICUs in that NICU outbreaks are more frequently caused by Enterobacteriaceae (33). It is noteworthy that of the two NICUs previously studied, surface colonization with this family of bacteria was significantly greater in one than the other (14). In the current study, levels of these organisms were relatively low but were not altered with intensive cleaning. These observations raise questions as to whether the colonization of NICU surfaces with Enterobacteriaceae is related to increased numbers of nosocomial infections and whether improved hand-washing or surface cleaning techniques might further decrease this class of infection. It may be that NICU surface ecologies are not significantly different than those of other hospital environments, a situation that can only be assessed as hospital ecological surveillance data grow. Rather, the unique challenge in preventing nosocomial infections in the NICU may be the increased susceptibility of premature and otherwise compromised infants to opportunistic infections, even from organisms that are commensals in healthy adults. The sources of most outbreak episodes are difficult to diagnose, but infected patients and colonized parents and personnel appear to be prevalent sources of infection (33). As with previous studies, NICU surfaces appear to be important reservoirs for potentially pathogenic microbes in these environments. Cleaning significantly reduces the total microbial load and reshapes the microbial assemblages on these surfaces to be dominated by nonpathogenic organisms. It is noteworthy, however, that some of the more abundant surface microbiota groups with known neonatal pathogen members are not common causes of infection in this NICU (e.g., Acinetobacter), while some organisms that commonly cause infection in this NICU are present in very low abundance on the NICU surfaces tested in this study (e.g., Enterococcus and Klebsiella).
The observation that streptococci and staphylococci colonize the NICU surfaces that are in contact with the neonate suggests that these microbes are able to outcompete the normal surface microbes. It is tempting to speculate that more potent cleaning techniques or agents will lead to further decreases in nosocomial infections; however, surveys of microbial communities like the present study have suggested that the prevailing paradigm (all bacteria are potentially dangerous, and therefore effective destruction of all bacteria on surfaces is a reasonable goal) may be inadequate. Future improvement may require innovative approaches such as selective antimicrobial cleansers or purposeful colonization of surfaces with as yet undetermined nonpathogenic species that can outcompete known pathogens.
The decreasing cost of high-throughput sequencing technologies will likely make testing future interventions and routine environmental surveillance of hospital surfaces feasible. The similarities in detection of several host-associated groups of Enterobacteriaceae and Firmicutes (e.g., Staphylococcus, Streptococcus, and Enterococcus) between this and the previous amplicon-sequencing survey of NICU surfaces (14) begin to define what constitutes a “typical” NICU surface ecosystem. Defining routine (i.e., nonthreatening) surface microbiota will require additional amplicon-sequencing studies of NICUs, and such an approach may enable future assessments of individual NICU “health” and early warning systems for predicting and preventing infection outbreaks.
Supplementary Material
ACKNOWLEDGMENTS
This work was supported by funding from National Institutes of Health NICHD award R01HD059127. N.A.B. was supported by the 2012-2013 Dannon Probiotics Fellow Program (The Dannon Company, Inc.) during the completion of this work. D.A.M. acknowledges the Shields Endowed Chair.
We thank Mariya Ryazantseva for assisting with DNA extraction from swab samples and Susan House and Christopher Polage for assistance with the blood culture data.
Footnotes
Published ahead of print 5 June 2013
Supplemental material for this article may be found at http://dx.doi.org/10.1128/JCM.00898-13.
REFERENCES
- 1. Melamed R, Greenberg D, Porat N, Karplus M, Zmora E, Golan A, Yagupsky P, Dagan R. 2003. Successful control of an Acinetobacter baumannii outbreak in a neonatal intensive care unit. J. Hosp. Infect. 53:31–38 [DOI] [PubMed] [Google Scholar]
- 2. Shimono N, Hayashi J, Matsumoto H, Miyake N, Uchida Y, Shimoda S, Furusyo N, Akashi K. 2012. Vigorous cleaning and adequate ventilation are necessary to control an outbreak in a neonatal intensive care unit. J. Infect. Chemother. 18:303–307 [DOI] [PubMed] [Google Scholar]
- 3. Chandrashekar MR, Rathish KC, Nagesha CN. 1997. Reservoirs of nosocomial pathogens in neonatal intensive care unit. J. Indian Med. Assoc. 95: 72–74, 77 [PubMed] [Google Scholar]
- 4. Newman MJ. 2002. Neonatal intensive care unit: reservoirs of nosocomial pathogens. West Afr. J. Med. 21:310–312 [DOI] [PubMed] [Google Scholar]
- 5. Bures S, Fishbain JT, Uyehara CF, Parker JM, Berg BW. 2000. Computer keyboards and faucet handles as reservoirs of nosocomial pathogens in the intensive care unit. Am. J. Infect. Control 28:465–471 [DOI] [PubMed] [Google Scholar]
- 6. Amann RI, Ludwig W, Schleifer KH. 1995. Phylogenetic identification and in-situ detection of individual microbial cells without cultivation. Microbiol. Rev. 59:143–169 [DOI] [PMC free article] [PubMed] [Google Scholar]
- 7. Kelley ST, Gilbert JA. 2013. Studying the microbiology of the indoor environment. Genome Biol. 14:202. 10.1186/gb-2013-14-2-202 [DOI] [PMC free article] [PubMed] [Google Scholar]
- 8. Bokulich NA, Mills DA. 2013. Improved selection of internal transcribed spacer-specific primers enables quantitative, ultra-high-throughput profiling of fungal communities. Appl. Environ. Microbiol. 79:2519–2526 [DOI] [PMC free article] [PubMed] [Google Scholar]
- 9. Poza M, Gayoso C, Gomez MJ, Rumbo-Feal S, Tomas M, Aranda J, Fernandez A, Bou G. 2012. Exploring bacterial diversity in hospital environments by GS-FLX Titanium pyrosequencing. PLoS One 7:e44105. 10.1371/journal.pone.0044105 [DOI] [PMC free article] [PubMed] [Google Scholar]
- 10. Kembel SW, Jones E, Kline J, Northcutt D, Stenson J, Womack AM, Bohannan BJ, Brown GZ, Green JL. 2012. Architectural design influences the diversity and structure of the built environment microbiome. ISME J. 6:1469–1479 [DOI] [PMC free article] [PubMed] [Google Scholar]
- 11. Flores GE, Bates ST, Knights D, Lauber CL, Stombaugh J, Knight R, Fierer N. 2011. Microbial biogeography of public restroom surfaces. PLoS One 6:e28132. 10.1371/journal.pone.0028132 [DOI] [PMC free article] [PubMed] [Google Scholar]
- 12. Bokulich NA, Ohta M, Richardson PM, Mills DA. 2013. Monitoring seasonal changes in winery-resident microbiota. PLoS One 8(6):e66437. 10.1371/journal.pone.0066437 [DOI] [PMC free article] [PubMed] [Google Scholar]
- 13. Hewitt KM, Gerba CP, Maxwell SL, Kelley ST. 2012. Office space bacterial abundance and diversity in three metropolitan areas. PLoS One 7:e37849. 10.1371/journal.pone.0037849 [DOI] [PMC free article] [PubMed] [Google Scholar]
- 14. Hewitt KM, Mannino FL, Gonzalez A, Chase JH, Caporaso JG, Knight R, Kelley ST. 2013. Bacterial diversity in two neonatal intensive care units (NICUs). PLoS One 8:e54703. 10.1371/journal.pone.0054703 [DOI] [PMC free article] [PubMed] [Google Scholar]
- 15. Attaway HH, III, Fairey S, Steed LL, Salgado CD, Michels HT, Schmidt MG. 2012. Intrinsic bacterial burden associated with intensive care unit hospital beds: effects of disinfection on population recovery and mitigation of potential infection risk. Am. J. Infect. Control 40:907–912 [DOI] [PubMed] [Google Scholar]
- 16. Bokulich NA, Joseph CML, Allen GR, Benson A, Mills DA. 2012. Next-generation sequencing reveals significant bacterial diversity of botrytized wine. PLoS One 7:e36357. 10.1371/journal.pone.0036357 [DOI] [PMC free article] [PubMed] [Google Scholar]
- 17. Caporaso JG, Lauber CL, Walters WA, Berg-Lyons D, Lozupone CA, Turnbaugh PJ, Fierer N, Knight R. 2011. Global patterns of 16S rRNA diversity at a depth of millions of sequences per sample. Proc. Natl. Acad. Sci. U.S.A. 108:4516–4522 [DOI] [PMC free article] [PubMed] [Google Scholar]
- 18. Caporaso JG, Kuczynski J, Stombaugh J, Bittinger K, Bushman FD, Costello EK, Fierer N, Gonzalez Pena A, Goodrich JK, Gordon JI, Huttley GA, Kelley ST, Knights D, Koenig JE, Ley RE, Lozupone CA, McDonald D, Muegge BD, Pirrung M, Reeder J, Sevinsky JR, Turnbaugh PJ, Walters WA, Widmann J, Yatsunenko T, Zaneveld J, Knight R. 2010. QIIME allows analysis of high-throughput community sequence data. Nat. Methods 7:335–336 [DOI] [PMC free article] [PubMed] [Google Scholar]
- 19. Bokulich NA, Subramanian S, Faith JJ, Gevers D, Gordon JI, Knight R, Mills DA, Caporaso JG. 2013. Quality-filtering vastly improves diversity estimates from Illumina amplicon sequencing. Nat. Methods 10:57–59 [DOI] [PMC free article] [PubMed] [Google Scholar]
- 20. Edgar RC. 2010. Search and clustering orders of magnitude faster than BLAST. Bioinformatics 26: 2460–2461 [DOI] [PubMed] [Google Scholar]
- 21. McDonald D, Price MN, Goodrich J, Nawrocki EP, DeSantis TZ, Probst A, Andersen GL, Knight R, Hugenholtz P. 2012. An improved Greengenes taxonomy with explicit ranks for ecological and evolutionary analyses of bacteria and archaea. ISME J. 6:610–618 [DOI] [PMC free article] [PubMed] [Google Scholar]
- 22. Altschul SF, Gish W, Miller W, Myers EW, Lipman DJ. 1990. Basic local alignment search tool. J. Mol. Biol. 215:403–410 [DOI] [PubMed] [Google Scholar]
- 23. Kõljalg U, Larsson KH, Abarenkov K, Nilsson RH, Alexander IJ, Eberhardt U, Erland S, Hoiland K, Kjoller R, Larsson E, Pennanen T, Sen R, Taylor AF, Tedersoo L, Vralstad T, Ursing BM. 2005. UNITE: a database providing web-based methods for the molecular identification of ectomycorrhizal fungi. New Phytol. 166:1063–1068 [DOI] [PubMed] [Google Scholar]
- 24. Abarenkov K, Nilsson RH, Larsson KH, Alexander IJ, Eberhardt U, Erland S, Høiland K, Kjøller R, Larsson E, Pennanen T, Sen R, Taylor AFS, Tedersoo L, Ursing BM, Vrålstad T, Liimatainen K, Peintner U, Kõljalg U. 2010. The UNITE database for molecular identification of fungi—recent updates and future perspectives. New Phytol. 186:281–285 [DOI] [PubMed] [Google Scholar]
- 25. Caporaso JG, Bittinger K, Bushman FD, DeSantis T, Andersen GL, Knight R. 2010. PyNAST: a flexible tool for aligning sequences to a template alignment. Bioinformatics 26:266–267 [DOI] [PMC free article] [PubMed] [Google Scholar]
- 26. Haas BJ, Gevers D, Earl AM, Feldgarden M, Ward DV, Giannoukos G, Ciulla DM, Tabbaa D, Highlander SK, Sodergren E, Methe B, DeSantis TZ, Petrosino JF, Knight R, Birren BW. 2011. Chimeric 16S rRNA sequence formation and detection in Sanger and 454-pyrosequenced PCR amplicons. Genome Res. 21:494–504 [DOI] [PMC free article] [PubMed] [Google Scholar]
- 27. Price MN, Dehal PS, Arkin AP. 2010. FastTree 2—approximately maximum-likelihood trees for large alignments. PLoS One 5:e9490. 10.1371/journal.pone.0009490 [DOI] [PMC free article] [PubMed] [Google Scholar]
- 28. Lozupone CA, Knight R. 2005. UniFrac: a new phylogenetic method for comparing microbial communities. Appl. Environ. Microbiol. 71:8228–8235 [DOI] [PMC free article] [PubMed] [Google Scholar]
- 29. Anderson MJ. 2001. A new method for non-parametric multivariate analysis of variance. Austr. Ecol. 26:32–46 [Google Scholar]
- 30. Gonzalez A, Stombaugh J, Lauber CL, Fierer N, Knight R. 2012. SitePainter: a tool for exploring biogeographical patterns. Bioinformatics 28:436–438 [DOI] [PMC free article] [PubMed] [Google Scholar]
- 31. Hierro N, Esteve-Zarzoso B, Gonzalez A, Mas A, Guillamon JM. 2006. Real-time quantitative PCR (QPCR) and reverse transcription-QPCR for detection and enumeration of total yeasts in wine. Appl. Environ. Microbiol. 72:7148–7155 [DOI] [PMC free article] [PubMed] [Google Scholar]
- 32. Hartmann AL, Lough DM, Barupal DK, Fiehn O, Fishbein T, Zasloff M, Eisen JA. 2009. Human gut microbiome adopts an alternative state following small bowel transplantation. Proc. Natl. Acad. Sci. U.S.A. 106:17187–17192 [DOI] [PMC free article] [PubMed] [Google Scholar]
- 33. Gastmeier P, Loui A, Stamm-Balderjahn S, Hansen S, Zuschneid I, Sohr D, Behnke M, Obladen M, Vonberg RP, Ruden H. 2007. Outbreaks in neonatal intensive care units—they are not like others. Am. J. Infect. Control 35:172–176 [DOI] [PubMed] [Google Scholar]
Associated Data
This section collects any data citations, data availability statements, or supplementary materials included in this article.
Supplementary Materials
Data Availability Statement
The sequencing data sets generated in this study are publicly available in the Quantitative Insights into Microbial Ecology (QIIME) database (www.microbio.me/qiime/) as study identification number 1797 (fungal sequencing run) and study identification number 1798 (bacterial sequencing run).