

Abstract
Metabolic diseases are characterized by the failure of regulatory genes or proteins to effectively orchestrate specific pathways involved in the control of many biological processes. In addition to the classical regulators, recent discoveries have shown the remarkable role of small noncoding RNAs (microRNAs [miRNAs]) in the posttranscriptional regulation of gene expression. In this regard, we have recently demonstrated that miR-33a and miR33b, intronic miRNAs located within the sterol regulatory element-binding protein (SREBP) genes, regulate lipid metabolism in concert with their host genes. Here, we show that miR-33b also cooperates with SREBP1 in regulating glucose metabolism by targeting phosphoenolpyruvate carboxykinase (PCK1) and glucose-6-phosphatase (G6PC), key regulatory enzymes of hepatic gluconeogenesis. Overexpression of miR-33b in human hepatic cells inhibits PCK1 and G6PC expression, leading to a significant reduction of glucose production. Importantly, hepatic SREBP1c/miR-33b levels correlate inversely with the expression of PCK1 and G6PC upon glucose infusion in rhesus monkeys. Taken together, these results suggest that miR-33b works in concert with its host gene to ensure a fine-tuned regulation of lipid and glucose homeostasis, highlighting the clinical potential of miR-33a/b as novel therapeutic targets for a range of metabolic diseases.
INTRODUCTION
The liver plays an essential role in maintaining plasma glucose levels to meet whole-body energy requirements. When food sources exceed the needs of the body, the liver increases glucose uptake, and it is converted into glycogen and triglycerides for fat/energy storage, whereas during fasting, the liver produces glucose by glycogenolysis and gluconeogenesis (1). In the early fasting state, glucose is supplied to the central nervous system and peripheral tissues from the breakdown of liver glycogen stores. However, during prolonged starvation, gluconeogenesis, which utilizes nonglycosidic intermediates such as lactate and pyruvate, takes over (1).
A complex network consisting of hormones, nuclear receptors, intracellular signaling pathways, and transcription factors governs the rate of de novo glucose synthesis. Specifically, hepatic gluconeogenesis is controlled through the transcriptional modulation of phosphoenolpyruvate carboxykinase (PCK1) and glucose-6-phosphatase (G6PC), the rate-limiting enzymes in this pathway (1). The expression of Pck1 and G6pc is regulated by the counteracting hormones glucagon/glucocorticoids (fasting) and insulin (feeding). Glucagon promotes hepatic glucose production by activating cyclic AMP (cAMP)/protein kinase A (PKA) signaling, which induces the formation of complex transcriptional machinery consisting of transcription factors that include cAMP response element-binding protein 1 (CREB1), Forkhead box O1 (FoxO1), hepatic nuclear factor 4 (HNF4A), retinoic acid receptor (RAR)-related orphan receptor alpha (RORα), and coactivators such as CREB-regulated transcription coactivator 2 (CRTC2), sirtuin 1 (SIRT1), p300/CBP (p300/CREB-binding protein), steroid receptor coactivator 1 (SRC1), and SRC2 on the promoters of PCK1 and G6PC (2–5).
On the other hand, when glucose is directly available, gluconeogenesis is dispensable and consequently needs to be shut off. Insulin is the most important hormone that inhibits hepatic gluconeogenesis, acting predominantly by suppressing PCK1 and G6PC expression. Hepatocytes respond to insulin by halting gluconeogenesis through phosphorylation of protein kinase B (PKB), also known as AKT (6–8). AKT phosphorylates and inhibits FoxO1 translocation from the cytoplasm to the nucleus, thereby reducing PCK1 and G6PC transcription levels and inhibiting glucose output from the liver (9, 10).
Another important effect of insulin in the liver is the activation of SREBP1c, a basic helix-loop-helix transcription factor that controls the expression of genes that regulate lipid metabolism. The SREBP family consists of three isoforms: SREBP1a and -1c, encoded by SREBP1, and SREBP2, encoded by SREBP2 (11–13). SREBP2 is induced by sterol deprivation and regulates genes involved in cholesterol synthesis and uptake, whereas SREBP1c is the major dominant insulin-stimulated isoform in the liver, responsible for inducing fatty acid synthesis and lipid accumulation (14). In primary hepatocytes, insulin increases the SREBP1c mRNA expression level and processing in parallel with the mRNAs of its target genes (14–18). Conversely, glucagon or cAMP decreases the SREBP1c mRNA expression level and its associated lipogenic target genes. In addition to the regulation of lipid synthesis, the activation of SREBP1c results in a significant suppression of the genes involved in glucose synthesis, including PCK1 (19, 20). However, the mechanism by which SREBP1c regulates hepatic gluconeogenesis after insulin stimulation remains unclear.
In addition to the classical transcription-dependent processes, several recent reports have shown the critical role of specific microRNAs (miRNAs) in regulating insulin production and sensitivity, including miRNAs 103 and 107 (miR-103/107), miR-375, and let-7 (21–24). miRNAs are small (∼23-nucleotide) single-stranded RNAs that control the expression of protein-encoding genes by acting primarily as sequence-specific inhibitors of mRNA. They are processed as primary transcripts in the nucleus and cytoplasm by the sequential actions of Drosha and Dicer enzymes, respectively. Once in the cytoplasm, mature miRNAs are incorporated into the RNA-induced silencing complex (RISC) and bind to partially complementary target sites in the 3′ untranslated region (3′UTR) of specific mRNAs, resulting in target mRNA destabilization, repression of translation, or both (25–27).
We and others have previously identified a highly conserved miRNA family, miR-33, embedded within intronic sequences of the SREBP genes (28–32). Two miR-33 genes are present in humans: miR-33a, which is harbored in the intron of SREBP2, and miR-33b, which is harbored in the intron of SREBP1. In mice, there is only one miR-33 gene, which is the ortholog of human miR-33a in the mouse Srebp2 gene. Metabolic stimuli that activate expression of Srebp2 and Srebp1 also regulate miR-33a/b expression, indicating that miR-33a and miR-33b are coexpressed with their host genes. Both miRNAs target genes involved in regulating cellular cholesterol export and fatty acid oxidation, including ABCA1, ABCG1, NPC1, CPT1A, CROT, and HADHB, thereby suggesting that the SREBP transcription factors and miR-33a/b may cooperate in a negative-feedback loop to regulate cholesterol and fatty acid metabolism (28–32).
Given that the insulin-mediated activation of SREBP1c results in the suppression of gluconeogenic enzymes, we wondered whether miR-33b may cooperate with its host gene to regulate hepatic glucose production. Very interestingly, we found that miR-33b directly repressed the rate-limiting enzymes of hepatic gluconeogenesis (PCK1 and G6PC) as well as several transcriptional activators of this process, such as SRC1, RORα, and CREB1. Importantly, overexpression of miR-33b inhibited PCK1 and G6PC expression and reduced glucose production in human hepatic cell lines. Of note, stimulation of hepatic SREBP1c expression in nonhuman primates resulted in a concomitant increase in the miR-33b expression level, suggesting that this genomic locus is coregulated in vivo. Conversely, miR-33b target genes were downregulated under these conditions. Taken together, these findings suggest that miR-33 may contribute to the regulation of glucose homeostasis by regulating the expression of genes involved in hepatic glucose production.
MATERIALS AND METHODS
Materials.
Chemicals were obtained from Sigma unless otherwise noted. A mouse monoclonal antibody against ABCA1 and a rabbit polyclonal antibody against PCK1 were purchased from Abcam, and a mouse monoclonal HSP90 antibody was obtained from BD Bioscience. Goat polyclonal antibodies against G6PC and RORα and rabbit polyclonal antibodies against CREB1 and PCG1α were obtained from Santa Cruz Biotech. A mouse monoclonal antibody against SRC1 and a rabbit polyclonal antibody against AMPKα were obtained from Cell Signal Technology. A rabbit polyclonal antibody against SIRT6 was obtained from Novus. Secondary fluorescently labeled antibodies were obtained from Molecular Probes (Invitrogen).
Cell culture and treatments.
Human hepatic HepG2 cells, obtained from the American Type Culture Collection, were maintained in Dulbecco's modified Eagle medium (DMEM) supplemented with 10% fetal bovine serum (FBS), 2% penicillin-streptomycin, and l-glutamine in 10-cm2 dishes at 37°C in 5% CO2. For gluconeogenesis induction, cells were grown in glucose-free DMEM (Cellgro) supplemented with 0.5% bovine serum albumin (BSA), 20 mM sodium lactate, and 2 mM sodium pyruvate in the presence of 100 nM dexamethasone (DXM) and 100 μM 2′-O-dibutyryladenosine 3′-5′-monophosphate (Bt2-cAMP) or 1 μM glucagon during 8 and 12 h. For some experiments, 100 nM insulin was added to the cells after 12 h of gluconeogenesis induction for 8 and 12 additional hours.
Transfection of miRNA mimics and miRNA inhibitors.
Cells (50 to 70% confluence) were transfected with 40 nM miRIDIAN miRNA mimic (miR-33b) or with 60 nM miRIDIAN miRNA inhibitor (Inh-miR-33b) (Dharmacon) by utilizing RNAimax (Invitrogen) and studied 48 h later. In all experiments, an equal concentration of a nontargeting control mimic (CM) sequence (Con-miR) or inhibitor negative control (CI) sequence (Con-Inh) was used as a control for non-sequence-specific effects in miRNA experiments. Verification of miR-33 overexpression and knockdown was determined by using quantitative PCR (qPCR), as described below.
3′UTR luciferase reporter assays.
cDNA fragments corresponding to the 3′UTRs of human G6PC, PCK1, CREB1, PGC1α, SRC1, and RORα were amplified by reverse transcription-PCR from total RNA extracted from HepG2 cells with XhoI and NotI linkers. The PCR products were directionally cloned downstream of the Renilla luciferase open reading frame in the psiCHECK2TM vector (Promega), which also contains a constitutively expressed firefly luciferase gene, which is used to normalize transfections. Site-directed mutations in the seed region of predicted miR-33 sites within the 3′UTRs were generated by using Multisite-QuikChange (Stratagene) according to the manufacturer's protocol. All constructs were confirmed by sequencing. COS-7 cells were plated into 12-well plates and cotransfected with 1 μg of the indicated 3′UTR luciferase reporter vectors and the miR-33b mimic or negative CM (Dharmacon) by using Lipofectamine 2000 (Invitrogen). Luciferase activity was measured by using the Dual-Glo luciferase assay system (Promega). Renilla luciferase activity was normalized to the corresponding firefly luciferase activity and plotted as a percentage of the control (CM). Experiments were performed in triplicate at least three times.
Hepatic glucose production.
HepG2 cells were grown in 6-well dishes and transfected with miR-33b mimic or negative control mimic; during 48 h, culture medium was replaced with 0.5 ml of glucose-free DMEM (Cellgro) supplemented with 0.5% BSA, 20 mM sodium lactate, and 2 mM sodium pyruvate in the presence of 100 nM DXM and 100 μM Bt2-cAMP. The glucose concentration in the culture medium was measured at 8 and 12 h by using the glucose-6-phosphate dehydrogenase-based method from Invitrogen. Glucose values were normalized to the total protein content and expressed as fold change versus control (CM) cells at time zero (T0).
Measurement of glycogen content.
HepG2 cells were grown in 6-well dishes and transfected with miR-33b mimic or negative control mimic; 48 h later, cells were cultured in glucose-free DMEM (Cellgro) supplemented with 0.5% BSA, without sodium lactate or sodium pyruvate, in the presence of 100 nM DXM and 100 μM Bt2-cAMP during 4 and 6 h. After removal of culture medium, distilled water was added to the cells, and cells were lysed with a handheld sonicator. Lysed supernatants were incubated at 55°C for 30 min in 10 mM acetic acid in the presence or absence of amyloglucosidase (7 mU/ml), which digests glycogen to glucose. After the reaction, the samples were deproteinized with 3% (wt/vol) perchloric acid and neutralized with 5 M KOH. Glucose contents of these samples were measured as described above. The glycogen contents were determined by subtracting the glucose levels of the undigested sample from those of the digested samples.
RNA isolation and quantitative real-time PCR.
Total RNA was isolated by using TRIzol reagent (Invitrogen) according to the manufacturer's protocol. For mRNA quantification, cDNA was synthesized by using iScript RT Supermix (Bio-Rad) according to the manufacturer's protocol. Quantitative real-time PCR (qRT-PCR) was performed in triplicate by using iQ SYBR green Supermix (Bio-Rad) on a Real-Time Detection system (Eppendorf). The mRNA level was normalized to glyceraldehyde-3-phosphate dehydrogenase (GAPDH) as a housekeeping gene. The following human primer sequences were used: 5′-GGTTTGGAGATGGTTATACAATAGTTGT-3′ and 5′-CCCGGAAACGCAAGTCC-3′ for ABCA1, 5′-CTAGCTTGGCGCGGAATCCGTGA-3′ and 5′-CACGGGCTAGAGGAGGGGTCCA-3′ for ALDO, 5′-CCCCTTTGCAGATGTATTGCTGTC-3′ and 5′-TCCCACAGTTCCGAGCTTCCTC-3′ for 2,3-biphosphoglycerate mutase (BPGM), 5′-ATGCCGGGAGAACTCTAACTCCC-3′ and 5′-GTCGATGGACGTCTCGTGCTC-3′ for C/EBPα, 5′-GGCACCCGCCGCGTTCATGCAA-3′ and 5′-CCAAGGAGTCCGCCTCGTAGT-3′ for c/EBPβ, 5′-TCGCACAGCACCCACTAGCA-3′ and 5′-CACTCTCGAGCTGCTTCCCTGT-3′ for CREB1, 5′-TCCTGGTGGGGAGGAGTCATACCAGG-3′ and 5′-TGTTAGTTGGCTTGTCACGGTGCG-3′ for fructose-1,6-biphosphatase/fructose-1-phosphate (FBP/FPK), 5′-AACTTTGGCATTGTGGAAGG-3′ and 5′-ACACATTGGGGGTAGGAACA-3′ for GAPDH, 5′-TGAATGGCTGCAGTGACCCAGATA-3′ and 5′-TGGATGTGGAGCCAGTGGAAGAAT-3′ for G6PC, 5′-AGGGAATGCTTGCCGACTCG-3′ and 5′-TGCTCTACCTTCTCCTTCTTGGCG-3′ for glucokinase (GCK), 5′-CCCGGCATTTAAAGTGTTTGGTGC-3′ and 5′-GAAGCCACAAGAGAAAGCCAGTGT-3′ for GYG, 5′-ACACCGCACGCACCGAAATT-3′ and 5′-CACGGCGCTCTTCAATTGCCT-3′ for PGC1α, 5′-CCAGGCGTACCAGGACCAGAA-3′ and 5′-CGATAACCAAGCGACCGATCCCG-3′ for phosphoglucomutase (PGM), 5′-TCCTGATTGGGGCTCCAGGAGGG-3′ and 5′-GGAGCGAGATGCCCCGATG-3′ for pyruvate kinase (PKRL), 5′-CGACAAGTGCCCCAAGAGGGTAT-3′ and 5′-TGCAAGTCCCAGGGTTGCCAT-3′ for glycogen phosphorylase (PYGL), 5′-ATGTCAACTGGTTCCGGAAGGACA-3′ and 5′-TTTCAGGTTCAGGGCATCCTCCTT-3′ for PCK1, 5′-TCGCACAGCACCCACTAGCA-3′ and 5′-TCCAGGAACAACAGACGCCAGTA-3′ for RORα, 5′-ACCACTTTGTCTGTCGAGCCTGA-3′ and 5′-TCCAGGCTCAGGTTTGGAGTTGAT-3′ for SRC1, 5′-CCCAGCCAAAACAGGGAGGCAT-3′ and 5′-GGGAAAACGGGGGCCTTCTG-3′ for SRC2, 5′-TCAGCGAGGCGGCGGCTTTGGAGCAG-3′ and 5′-CATGTCTTCGATGTCGGTCAG-3′ for SREBP1c, 5′-CAAGATGCACAAGTCTGGCG-3′ and 5′-GCTTCAGCACCATGTTCTCCTG-3′ for SREBP2, and 5′-AGCTATCAATCTGTCAATCCTGTC-3′ and 5′-GCTTAATTTGACTCAACACGGGA-3′ for 18S. The following monkey primer sequences were used for SREBP1c: 5′-CAACGCTGGCCGAGATCTAT-3′ and 5′-TCCCCATCCACGAAGAAACG-3′. For miRNA quantification, total RNA was reverse transcribed by using the RT2 miRNA First Strand kit (SABiosciences). Primers specific for human miR-33b (SABiosciences) were used, and values were normalized to the levels of SNORD38B mRNA as a housekeeping gene. For miR-33 primary transcript (pri-miRNA) quantification, cDNA was synthesized by using TaqMan reverse transcription reagents (Applied Biosystems) according to the manufacturer's protocol. Quantitative real-time PCR was performed in triplicate by using TaqMan universal master mix (Applied Biosystems) on a Real-Time PCR system (Applied Biosystems). For mouse tissues, total RNA from liver was isolated by using the Bullet Blender homogenizer (Next Advance) in TRIzol. One microgram of total RNA was reverse transcribed by using the using the RT2 miRNA First Strand kit (SABiosciences) for miR-33b quantification, and levels were normalized to those of SNORD66 by using quantitative PCR, as described above. For target mRNA quantification, cDNA was synthesized by using TaqMan reverse transcription reagents (Applied Biosystems) according to the manufacturer's protocol. Quantitative real-time PCR was performed in triplicate by using TaqMan Universal Master Mix (Applied Biosystems) on a real-time PCR system (Applied Biosystems).
Ribonucleoprotein immunoprecipitation.
Immunoprecipitation (IP) of endogenous Ago2-mRNA complexes was used to assess the association of endogenous Ago2 with endogenous target mRNAs. The assay was performed with 20 million cells as the starting material per condition, and lysate supernatants were precleaned for 30 min at 4°C by using 15 mg of IgG (Santa Cruz Biotech) and 50 ml of protein A-Sepharose beads (Sigma) that had been previously swollen in NT2 buffer (50 mM Tris [pH 7.4], 150 mM NaCl, 1 mM MgCl2, and 0.05% Nonidet P-40) supplemented with 5% BSA. Beads (100 ml) were incubated (16 h at 4°C) with 30 mg of antibody (either IgG [Santa Cruz Biotech] or anti-Ago2 [Abcam]) and then incubated for 3 h with 3 mg of cell lysate at room temperature. After extensive washes and digestion of proteins in the IP material, RNA was extracted and used for RNA quantification by qRT-PCR using the primers listed above.
Metabolic profiling.
Metabolomic studies were conducted at Metabolon Inc. by using a nontargeted platform that enables relative quantitative analysis of a broad spectrum of molecules with a high degree of confidence. The metabolic profiling analysis combined 3 independent platforms, ultra-high-performance liquid chromatography tandem mass spectrometry (UHPLC/MS-MS2), optimized for acidic species, and gas chromatography-mass spectrometry (GC-MS). The data represent means ± standard deviations (SD) and are representative of 5 experiments (asterisks indicate a P value of ≤0.05 by Welch's two-sample t test).
Western blot analysis.
HepG2 cells were lysed in ice-cold buffer containing 50 mM Tris-HCl (pH 7.5), 125 mM NaCl, 1% NP-40, 5.3 mM NaF, 1.5 mM NaP, 1 mM orthovanadate, 1 mg/ml of protease inhibitor cocktail (Roche), and 0.25 mg/ml AEBSF [4-(2-aminoethyl)benzenesulfonyl fluoride hydrochloride; Roche]. Cell lysates were rotated at 4°C for 1 h before the insoluble material was removed by centrifugation at 12,000 × g for 10 min. After normalizing for equal protein concentrations, cell lysates were resuspended in SDS sample buffer before separation by SDS-PAGE. Following overnight transfer of the proteins onto nitrocellulose membranes, the membranes were probed with the indicated antibodies, and protein bands were visualized by using the Odyssey infrared imaging system (Li-Cor Biotechnology). Densitometry analysis of the gels was carried out by using ImageJ software from the NIH (http://rsbweb.nih.gov/ij/).
Northern blot analysis.
Total RNA (10 μg) was resolved in a 15% polyacrylamide gel and blotted onto a Hybond-N+ nylon membrane (Amersham Biosciences). miRCURY LNA detection probe DNA oligonucleotides for hsa-miR-33b were purchased from Exiqon. The oligonucleotide sequence 5′-GCAATGCAACAGCAATGCAC-3′, which is complementary to the mature miRNA, was end labeled with [α-32P]ATP and T4 polynucleotide kinase (New England BioLabs) to generate highly-specific-activity probes. The oligonucleotide sequence for 5S rRNA was 5′-CAGGCCCGACCCTGCTTAGCTTCCGAGATCAGACGAGAT-3′. Hybridization was carried out according to Express Hyb (Bio-Rad) protocols. Probes were washed twice for 10 min at 25°C in 4× SSC (1× SSC is 0.15 M NaCl plus 0.015 M sodium citrate)–0.5% SDS.
Nonhuman primate studies.
Five male rhesus monkeys (Macaca mulatta) aged 14.3 ± 0.53 years (standard error of the mean [SEM]) were fasted overnight and anesthetized with ketamine (10 mg/kg of body weight); isoflurane gas maintained the anesthesia plane. An ultrasound-guided needle biopsy specimen of the liver was collected at baseline and flash frozen. For the glucose tolerance test (GTT), an intravenous (i.v.) catheter was placed into the saphenous vein. Following the collection of 4 baseline blood samples (3 ml each), a dose of 300 mg/kg of 50% dextrose (Hospire Inc., Lake Forest, IL) was delivered i.v. over 30 s. Blood samples were then collected at 1, 5, 10, 15, 30, and 60 min after injection. Glucose values were promptly measured in whole blood by using an Ascensia Breeze 2 blood glucose-monitoring system (Bayer HealthCare LLC, Mishawaka, IN), and additional serum samples were stored at −80°C for subsequent analysis. A second liver biopsy specimen was collected immediately following the 60-min time point and again 6 h after glucose infusion. Animal procedures were approved by the Animal Care and Use Committee of the Biogerontology Research Center, National Institute on Aging. Liver RNA was isolated by using the Bullet Blender homogenizer (Next Advance) with TRIzol. For mRNA quantification, 1 μg of total RNA was reverse transcribed by using iScript RT Supermix (Bio-Rad) and iQ SYBR green Supermix (Bio-Rad). Quantification of miR-33b and miR-33a was performed by using the RT2 miRNA First Strand kit (SABiosciences), as described above.
Statistics.
All data are expressed as means ± SEM. Statistical differences were measured by either a t test or two-way analysis of variance (ANOVA) with Bonferroni correction for multiple comparisons when appropriate. A P value of ≤0.05 was considered statistically significant. Data analysis was performed by using Prism (Statistical Graphics).
RESULTS
Srebp/miR-33 expression is coregulated during gluconeogenesis.
It is well established that agonists of LXR, such as oxysterols or insulin, lead to the hepatic induction of SREBP1c and more recently miR-33b (28). Conversely, gluconeogenic stimuli, such as glucagon and Bt2-cAMP, have been shown to inhibit SREBP1c expression in primary hepatocytes (14). To determine whether gluconeogenesis induction affects miR-33 expression, we treated human hepatic cells with dexamethasone (DXM) and 2′-O-dibutyryladenosine 3′-5′-monophosphate (Bt2-cAMP) or glucagon. qRT-PCR analysis showed decreases of SREBP1c mRNA levels as well as miR-33b levels after gluconeogenic stimuli, consistent with their coregulation (Fig. 1A). We next examined the expression of the miR-33 primary transcript (pri-miRNA) and the mature form by Northern blotting. As shown in Fig. 1B, the expression levels of pri-miR33b (top band) and the miR-33 mature form (bottom band) decreased after treatment of HepG2 cells with DXM and Bt2-cAMP, suggesting that miR-33 expression is regulated at the transcriptional level. Similar results were observed when analyzing pri-miR-33 expression by qRT-PCR (data not shown). Conversely, the expressions of PCK1 and G6PC and other coregulators involved in the transcriptional regulation of these enzymes, such as PGC1α and SRC1, were significantly increased at the mRNA and protein levels upon gluconeogenesis induction (Fig. 1C and D). In contrast, treatment with insulin induced SREBP1c and miR-33b (Fig. 2A) but inhibited the expression of PCK1 and PGC1α mRNAs (Fig. 2B). Altogether, these results demonstrate that activation of the gluconeogenic genes correlates inversely with SREBP1c and miR-33b expression. Thus, we postulate that miR-33 may also cooperate with its host gene to regulate gluconeogenesis.
Fig 1.

Induction of glucose synthesis reduces SREBP1 and miR-33b expression levels. (A) qRT-PCR analysis of SREBP1c mRNA (left) and miR-33b (right) expression levels in HepG2 cells cultured in glucose-free medium in the presence of lactate-pyruvate (2 and 20 mM, respectively) and treated with dexamethasone (DXM) and 2′-O-dibutyryladenosine 3′-5′-monophosphate (Bt2-cAMP) or glucagon during 8 and 12 h. Data are presented as means ± SEM from 3 independent experiments performed in triplicate. ∗, P ≤ 0.05 versus untreated cells (T0). (B) Northern blot analysis of pri-miR-33b (precursor form) and miR-33b (mature form) in HepG2 cells cultured in glucose-free medium in the presence of lactate-pyruvate (2 and 20 mM, respectively) and treated with DXM and Bt2-cAMP during 8 and 12 h. 5S rRNA was used as a loading control. (C) qRT-PCR analysis of PCK1, G6PC, PGC1α, and SRC1 expression levels in HepG2 cells cultured in glucose-free medium in the presence of lactate-pyruvate (2 and 20 mM, respectively) and treated with DXM and Bt2-cAMP during 8 and 12 h. Data are presented as means ± SEM from 3 independent experiments performed in triplicate. ∗, P ≤ 0.05 versus nontreated cells (T0). (D) Representative Western blot analysis of SRC1, G6PC, and PCK1 expression levels in HepG2 cells cultured in glucose-free medium in the presence of lactate-pyruvate (2 and 20 mM, respectively) and treated with DXM and Bt2-cAMP during 8 and 12 h. HSP90 was used as a loading control.
Fig 2.
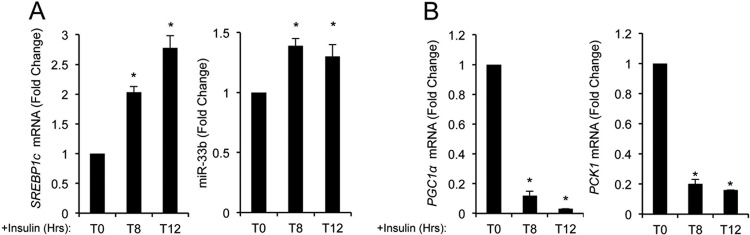
Inhibition of glucose synthesis induces SREBP1 and miR-33b expression. (A) qRT-PCR analysis of SREBP1c (left) and miR-33b (right) expression levels in HepG2 cells treated with insulin during 8 and 12 h. (B) qRT-PCR analysis of PCG1α (left) and PCK1 (right) expression levels in HepG2 cells treated with insulin during 8 and 12 h. Data are presented as means ± SEM from 3 independent experiments performed in triplicate. ∗, P ≤ 0.05 versus untreated cells (T0).
miR-33 regulates PCK1, G6PC, CREB1, SRC1, RORα, and PGC1α expression in human hepatic cells.
To investigate the potential target genes of miR-33, we used a combination of bioinformatic tools for miRNA target predictions (Targetscan [http://www.targetscan.org/] and miRanda [http://www.microrna.org/]). Interestingly, we found that miR-33 had predicted binding sites in many genes involved in glucose metabolism, including PCK1 and G6PC, the rate-limiting enzymes of gluconeogenesis (Table 1). We next determined whether or not miR-33 regulates the expression of PCK1 and G6PC by transfecting miR-33b oligonucleotides in HepG2 cells. As shown in Fig. 3A, overexpression of miR-33b increased its expression level 250-fold (data not shown) and significantly inhibited PCK1 and G6PC mRNA levels. Moreover, other predicted miR-33 target genes involved in glucose production, including CREB1, PGC1α, SRC1, SRC2, RORα, C/EBPα, and C/EBPβ, were also downregulated in miR-33b-transfected cells (Fig. 3A). Conversely, endogenous inhibition of miR-33b using anti-miR-33b oligonucleotides increased G6PC, CREB1, PGC1α, SRC1, and RORα expression levels (Fig. 3B). Similar effects were observed at the protein level (Fig. 3C and D). As expected for the conservation in the seed sequence, miR-33a overexpression also reduced the expressions of PCK1 and G6PC at the mRNA and protein levels (data not shown). Since both SREBP2 and SREBP1 are regulated by fasting/refeeding, it is likely that both miRNAs control the expression of genes involved in the regulation of lipid and glucose metabolism.
Table 1.
miR-33 predicted targets
| Gene | Presence of targeta determined by: |
||
|---|---|---|---|
| miRanda | miRwalk | Targetscan | |
| c/EBPα | X | X | |
| c/EBPβ | X | X | |
| CREB1 | X | X | |
| CREBBP | X | X | |
| G6PC | X | X | X |
| PCK1 | X | X | X |
| PGC1α | X | X | X |
| RORα | X | X | |
| SRC1 | X | X | |
| SRC2 | X | X | |
X, predicted binding site present.
Fig 3.

miR-33 controls expression of multiple genes involved in regulation of gluconeogenesis. (A and B) qRT-PCR analysis of PCK1, G6PC, CREB1, CREBBP, PGC1α, SRC1, SRC2, RORα, C/EBPα, C/EBPβ, and ABCA1 mRNA expression levels in HepG2 cells transfected with miR-33b mimic (miR-33b) or control mimic (CM) (A) or miR-33b inhibitor (Inh-miR-33b) or control inhibitor (CI) (B). Data are expressed as relative expression levels and correspond to the means ± SEM from 3 independent experiments performed in triplicate. ∗, significantly different from cells transfected with CM (normalized to 1) (A, dashed line) or CI (normalized to 1) (B, dashed line) (P ≤ 0.05). (C and D) Western blot analysis of PCK1, G6PC, CREB1, SRC1, RORα, PGC1α, ABCA1, and HSP90 in HepG2 cells transfected with miR-33b (C) or Inh-miR-33b (D). Right panels show the band densitometry analysis of the Western blots. Data are expressed as relative expression levels and correspond to means ± SEM from 3 experiments. ∗, significant differences from cells transfected with CM or CI (P ≤ 0.05). A.U., arbitrary units.
To assess directly the effects of miR-33b on the 3′UTRs of PCK1, G6PC, SRC1, RORα, and CREB1, we cloned the 3′UTRs of these genes into luciferase reporter plasmids (Fig. 4A). As shown in Fig. 4B, miR-33b significantly repressed PCK1, G6PC, SRC1, RORα, and CREB1 3′UTR activities. Mutation of the miR-33 target sites relieved miR-33 repression of the PCK1, G6PC, SRC1, RORα, and CREB1 3′UTR activities, consistent with a direct interaction of miR-33 with these sites (Fig. 4B). As expected by this direct interaction, overexpression of miR-33 in HepG2 cells significantly enriched the association of ABCA1, G6PC, SRC1, and CREB1 mRNAs with Ago-containing complexes (Fig. 4C).
Fig 4.

miR-33b binds to the 3′UTRs of PCK1, G6PC, SRC1, RORα, and CREB1. (A) PCK1, G6PC, SRC1, RORα, and CREB1 3′UTR sequences. Underlined sequences indicate the miR-33-binding sites. Nucleotides highlighted in red indicate the point mutations in the miR-33-binding sites. (B) Luciferase reporter activity in COS-7 cells transfected with control miRNA (CM) or miR-33 mimic (miR-33b) and the PCK1, G6PC, SRC1, RORα, or CREB1 3′UTR (wild type [WT]) or the constructs containing the indicated point mutations (MUT). DM indicates that the two miR-33-binding sites are mutated in the same construct. Data are expressed as relative luciferase activity compared to the activity in control samples cotransfected with an equal concentration of CM and correspond to the means ± SEM of 3 experiments performed in duplicate. ∗, significantly different from cells cotransfected with CM; #, significantly different from cells transfected with CM or miR-33b and the wild-type 3′UTR (P ≤ 0.05). (C) G6PC, PCK1, SRC1, CREB1, and ABCA1 mRNA levels determined by Ago IP relative to IgG IP were quantified by ribonucleoprotein immunoprecipitation followed by RT-qPCR analysis in Huh-7 cells transfected for 24 h with miR-33b. Results are the means ± SEM of 2 experiments performed in duplicate.
miR-33 regulates glucose production in human hepatic cells.
Gluconeogenesis is mainly responsible for the maintenance of blood glucose levels under prolonged fasting conditions in the presence of nonglycosidic intermediates. This process requires the induction of specific genes, such as PCK1, G6PC, and other specific downstream components that control these enzymes at the transcriptional level (2–5). Given that miR-33 regulates the expression of PCK1 and G6PC at the posttranscriptional level, we investigated the effects of miR-33b on gluconeogenesis-dependent gene induction. To this end, we transfected HepG2 cells with control mimic (CM) and miR-33b, and 48 h later, we cultured them in glucose-free medium containing lactate-pyruvate (20 and 2 mM, respectively), 100 nM DXM, and 100 μM Bt2-cAMP for 8 and 12 h. As expected, PCK1, G6PC, CREB1, SRC1 and RORα were induced after the treatment (Fig. 5A). Importantly, overexpression of miR-33b significantly reduced the induction of these genes at each time point (Fig. 5A). In another set of experiments, we analyzed the expression of PCK1, G6PC, SRC1, and RORα. As shown in Fig. 5B, overexpression of miR-33b resulted in significant reductions of PCK1, G6PC, SRC1, and RORα levels. SIRT6 and AMPKα, validated miR-33 targets, were used as positive controls in this set of experiments (Fig. 5B). To test directly whether miR-33b levels influence glucose production, we transfected HepG2 cells with miR-33b and analyzed the glucose content in the medium after DXM and Bt2-cAMP stimulation. In agreement with PCK1 and G6PC inhibition, overexpression of miR-33b significantly decreased glucose secretion (Fig. 5C). Conversely, miR-33 inhibition increased glucose production compared to that in cells transfected with the control inhibitor (data not shown). We further assessed whether the overexpression of G6PC and PCK1 rescues the effect of miR-33 on glucose production. To this end, we transfected HepG2 cells with G6PC and PCK1 cDNAs that lacked the 3′UTR sequences and were thus resistant to miR-33 inhibitory action. The results showed that expression of G6PC and PCK1 rescued glucose production in miR-33-overexpressing cells (Fig. 5D), suggesting that both target genes are critical for the miR-33 inhibitory effect on gluconeogenesis. We next analyzed whether SREBP1c expression during gluconeogenic stimulation was important for the inhibition of glucose production in miR-33-transfected cells. As shown in Fig. 5E, miR-33 overexpression significantly reduced glucose production in cells transfected with negative-control small interfering RNA (siRNA) and SREBP1 siRNA, suggesting that the inhibition of glucose production in HepG2 cells transfected with miR-33 is independent of SREBP1 expression. Altogether, these results suggest that miR-33 plays a role in regulating glucose synthesis and secretion.
Fig 5.

miR-33 regulates glucose production in HepG2 cells. (A) qRT-PCR analysis of PCK1, G6PC, CREB1, SRC1, and RORα expression levels in HepG2 cells transfected with control miRNA (CM) or miR-33b mimic (miR-33b) and treated with DXM and Bt2-cAMP during 8 and 12 h in glucose-free medium in the presence of lactate-pyruvate (2 and 20 mM, respectively). Data are presented as means ± SEM from 3 independent experiments performed in triplicate. ∗, P ≤ 0.05 versus untreated cells at each time point. (B) Western blot analysis of PCK1, G6PC, SRC1, RORα, AMPKα, SIRT6, and HSP90 expression levels in HepG2 cells transfected with CM or miR-33b and treated with DXM and Bt2-cAMP or glucagon in glucose-free medium in the presence of lactate-pyruvate (2 and 20 mM, respectively) during 8 and 12 h. Data correspond to a representative experiment among two that gave similar results. (C) Glucose production in HepG2 cells transfected with CM or miR-33 and stimulated with DXM and Bt2-cAMP in glucose-free medium in the presence of lactate-pyruvate (2 and 20 mM, respectively) during 8 and 12 h. Data are expressed as the fold change between glucose production at different time points and that in untreated cells ± SEM and are representative of ≥3 experiments. ∗, P ≤ 0.05. (D) Glucose production in HepG2 cells transfected with green fluorescent protein (GFP) or PCK1-GFP/G6PC-GFP in the presence of CM or miR-33 and stimulated with DXM and Bt2-cAMP in glucose-free medium in the presence of lactate-pyruvate (2 and 20 mM, respectively) during 8 and 12 h. Data are expressed as the fold change between glucose production at 8 h and that in untreated cells ± SEM and are representative of ≥3 experiments. ∗, P ≤ 0.05. Right panels show the transfection efficiency by immunofluorescence (top) and Western blotting (bottom). Immunofluorescence images and Western blot images are representative of 3 independent experiments that gave similar results. (E) Glucose production in HepG2 cells transfected with nontargeting siRNA (siRNA ctrl) or SREBP1 siRNA in the presence of CM or miR-33 and stimulated with DXM and Bt2-cAMP in glucose-free medium in the presence of lactate-pyruvate (2 and 20 mM, respectively) during 8 h. Data are expressed as the fold change between glucose production after 8 h of treatment and glucose production in untreated cells ± SEM and are representative of ≥3 experiments. ∗, P ≤ 0.05. Western blot insets show the siRNA transfection efficiency.
miR-33 also regulates glucose metabolism by inhibiting glycogen degradation.
Previous reports have demonstrated that SRC1 and RORα regulate the transcription of pyruvate carboxylase (PC), PCK1, and G6PC (33, 34). Specific knockdown of SRC1 reduced G6PC expression levels and glucose production in the liver (34). Moreover, the absence of SRC1 resulted in increased expression levels of glycolytic and glycogenosynthesis genes and decreased expression levels of genes involved in the degradation of glycogen in the liver (35). Since SRC1 and RORα are miR-33 target genes, we sought to analyze whether miR-33 may also contribute to the regulation of glycolysis and glycogen metabolism. As shown in Fig. 6A, qRT-PCR analysis revealed an increase in the expression level of glucokinase (GCK) mRNA in HepG2 cells transfected with miR-33b. miR-33 levels did not significantly affect the expression of other glycolytic genes, including the genes for aldolase A (ALDOA), 2,3-biphosphoglycerate mutase (BPGM), pyruvate kinase (PKRL), and fructose-1-phosphate/fructose-1,6-biphosphatase (FPK/FBP) (Fig. 6A). miR-33b overexpression also reduced the levels of several enzymes involved in glycogenolysis, including glycogen phosphorylase (PYGL) and phosphoglucomutase (PGM). Moreover, the expression of glycogenin (GLYG), an enzyme involved in the synthesis of glycogen, was not affected in HepG2 cells transfected with miR-33 oligonucleotides (Fig. 6B). To corroborate the effect of miR-33 on glycogenolysis, we transfected HepG2 cells with nontargeting control miRNA (CM) or miR-33b; 48 h later, cells were cultured in glucose-free medium with DXM and Bt2-cAMP for 2, 4, and 6 h in the absence of lactate-pyruvate. Under these conditions, we found that the PGM expression level was significantly reduced in miR-33b-transfected cells, suggesting that the lysis of glycogen may be affected by miR-33b (Fig. 6C). These results correlate with the increased glycogen content observed in HepG2 cells transfected with miR-33b compared with that of cells transfected with CM (Fig. 6D). Taken together, these results strongly suggest that miR-33b contributes to the regulation of glucose metabolism by reducing gluconeogenesis and glycogenolysis in human hepatic cell lines.
Fig 6.

miR-33 modulation of genes involved in glucose homeostasis. (A) qRT-PCR analysis of genes involved in glycolysis, including GCK, ALDO, BPGM, FBP/PFK, and PKLR, in HepG2 cells transfected with miR-33b. ABCA1 was included as a positive control. (B) qRT-PCR analysis of genes involved in glycogen metabolism, including GYG, PGM, and PYGL, in HepG2 cells transfected with miR-33b. Data are expressed as relative expression levels and correspond to the means ± SEM from 3 independent experiments performed in triplicate. ∗, significantly different from cells transfected with CM (normalized to 1) (dashed line). (C) qRT-PCR analysis of PGM expression in HepG2 cells transfected with control miRNA (CM) or miR-33b mimic (miR-33b) and treated with DXM and Bt2-cAMP during 2, 4, and 6 h in glucose-free medium in the absence of lactate or pyruvate. Data are presented as means ± SEM from 3 independent experiments performed in triplicate. ∗, P ≤ 0.05 versus untreated cells at each time point. (D) Glycogen content in HepG2 cells transfected with CM versus miR-33b. Data are presented as means ± SEM from 3 independent experiments performed in triplicate. ∗, significantly different from cells transfected with CM (P ≤ 0.05).
To further explore the role of miR-33 in regulating glucose metabolism, we next assessed the effect of miR-33 overexpression on the global metabolomics profile of human hepatic cells (Metabolon Inc.). The results indicate that miR-33 overexpression results in altered intracellular concentrations of 271 biochemicals (23 upregulated and 5 downregulated), with a P value of <0.05 by Welch's two-sample t test. Specifically, we observed that miR-33 overexpression increased levels of ribulose, lactate, and pyruvate and reduced levels of glucose-6-phosphate and fructose-6-phosphate (Fig. 7A). This accumulation of intermediates in the pentose phosphate pathway (PPP) (ribulose and ribulose-5-phosphate) suggests that in addition to inhibiting gluconeogenesis, miR-33 might enhance glycolysis in human hepatic cells (Fig. 7B).
Fig 7.

miR-33 overexpression decreases glucose-6-phosphate and fructose-6-phosphate levels and increases the accumulation of lactate, pyruvate, ribulose, and ribulose 5-phosphate. (A) Relative levels of glucose-6-phosphate, fructose-6-phosphate, lactate, pyruvate, ribulose, and ribulose 5-phosphate in HepG2 cells transfected with miR-33 compared to cells transfected with control miRNA (Ctrl-miR). The error bars represent means ± SD and are representative of 5 experiments. ∗, P ≤ 0.05 by Welch's two-sample t test. (B) Schematic representation of the metabolic effect of miR-33 on glucose metabolism. Green and red boxes represent metabolites that are accumulated or depleted in HepG2 cells transfected with miR-33 compared with cells transfected with control miRNA, respectively. DHAP, dihydroxyacetone phosphate; glucose 6-P, glucose-6-phosphate.
miR-33 regulates glucose metabolism in vivo.
The lack of conservation of miR-33b and the miR-33-binding sites in the mouse SIRT6, PCK1, and G6PC 3′UTRs makes it difficult to raise definitive conclusions about the role of miR-33 in regulating glucose metabolism by using rodent models. Therefore, we decided to analyze the expression of miR-33b and its target genes in rhesus monkeys. To this end, we acutely administered glucose intravenously and measured blood glucose and insulin levels at different time points. As expected, insulin levels were increased after 15 min of glucose infusion, leading to an enhancement of SREBP1c and miR-33b expression levels in the liver (Fig. 8A and B). Furthermore, the increase of plasma insulin levels did not affect SREBP2 and miR-33a expression (Fig. 6C). Most importantly, expression levels of PCK1 and G6PC mRNAs and the encoded proteins inversely correlated with miR-33b levels in the liver (Fig. 8D and E), suggesting that miR-33b may play an important role in regulating the expression of these genes at the posttranscriptional level. Taken together, these results strongly suggest that miR-33 may play an important role in regulating hepatic glucose production and also provide the first in vivo evidence of SREBP1/miR-33b coregulation upon physiological stimulation.
Fig 8.

SREBP1/miR-33b expression correlates inversely with PCK1 and G6PC levels in the liver of rhesus monkeys. (A) Blood glucose and insulin levels of rhesus monkeys fasted overnight and stimulated with glucose (dextrose, 300 mg/Kg). Measurements were performed after 5, 10, 15, 30, 60, and 360 min of intraperitoneal glucose injections. (B and C) qRT-PCR analysis of SREBP1c mRNA and miR-33b (B) and SREBP2 and miR-33a (C) expression levels in the liver of rhesus monkeys after 60 min of glucose stimulation. Data are presented as means ± SEM (n = 6). ∗, P ≤ 0.05 versus nontreated rhesus monkeys (T0). (D) qRT-PCR analysis of PCK1 and G6PC levels in the liver of rhesus monkeys after 60 min of glucose infusion. Data are presented as means ± SEM (n = 6). ∗, P ≤ 0.05 versus nontreated rhesus monkeys (T0). (E) Western blot analysis of PCK1 and G6PC expression levels in the liver of rhesus monkeys after 60 min of glucose stimulation. Data correspond to a representative experiment among three that gave similar results. (F) Schematic representation of the proposed regulation of hepatic gluconeogenesis by miR-33b. Red boxes represent the miR-33 target genes involved in hepatic glucose production.
DISCUSSION
In response to nutritional challenges, metabolic gene expression needs to be precisely controlled to maintain glucose and lipid homeostasis. This control is classically accomplished by a network of transcription factors and coactivators, which are responsible for connecting hormonal and nutrient signals to the transcriptional regulation of metabolic pathways. In this regard, miRNAs constitute an additional layer of regulation at the posttranscriptional level, which plays a crucial role in metabolic homeostasis.
We and others have previously established that during sterol/lipid-limited states, miR-33a and miR-33b are generated with SREBP2 and SREBP1 and target genes involved in cholesterol export and fatty acid degradation, such as ABCA1, ABCG1, HADHB, CROT, and CPT1α, suggesting a cooperative model to ensure lipid balance in the cell (28–32). In the current study, we demonstrate that miR-33b is coexpressed with its host gene in response to insulin and regulates the expression of a set of genes that control hepatic gluconeogenesis, including PCK1, G6PC, CREB1, SRC1, and RORα (3, 10, 36–38). We also show that miR-33b overexpression in human hepatic cells reduces glucose secretion and concomitantly inhibits the expression of the PCK1, G6PC, CREB1, SRC1, and RORα genes observed during the stimulation of gluconeogenesis. Most importantly, the induction of hepatic SREBP1c expression in rhesus monkeys after glucose infusion results in an increase of miR-33b levels and downregulation of the gluconeogenic miR-33 target genes PCK1 and G6PC.
In the liver, the control of lipid metabolism and the control of glucose metabolism are closely linked. A principal mechanism whereby insulin alters gene expression in this tissue is through transcriptional upregulation and processing of SREBP1c (39). Several lines of evidence indicate that SREBP1c not only is responsible for the lipogenic effects of insulin in the liver but also participates in the suppression of the gluconeogenic program by inhibiting PCK1 and G6PC expression. Interestingly, our results strongly suggest that miR-33b may cooperate with SREBP1c in regulating glucose production by directly targeting the PCK1 and G6PC 3′UTRs.
In addition to the above-mentioned transcriptional regulators, miR-33 also regulates the expression of SRC1 and SRC2, which have recently been described as important regulators of glucose metabolism. In response to starvation, SRC1 cooperates with c/EBPα to induce the expression of PC and PCK1 in the liver (34). Indeed, liver-specific knockdown of SRC1 impairs glucose production and causes hypoglycemia in mice (34). On the other hand, SRC2 coactivates RORα, which transcriptionally induces the levels of G6PC, an enzyme that serves as a terminal gatekeeper for hepatic glucose release into the plasma (33).
miR-33 also regulates the expression of genes involved in the regulation of glycogen metabolism. Overexpression of miR-33 in human hepatic cells results in significant inhibition of the levels of PGM as well as other enzymes involved in glycogen degradation. However, the direct effect of miR-33 on PGM expression remains to be explored. Another potential mechanism that may lead to glycogen accumulation in cells transfected with miR-33 oligonucleotides is the direct inhibition of RORα and G6PC. The latter serves as a common enzyme in the last steps of both gluconeogenesis and glycogenolysis, and its deficiency results in an increase of glycogen storage in the liver (40, 41). Taken together, these results suggest that miR-33 mimics the metabolic effects of insulin in the liver, i.e., the suppression of gluconeogenesis and glycogenosynthesis.
It is well established that the AKT signaling pathway is rapidly induced after insulin stimulation, but hepatic gluconeogenesis continues well into the later stages of refeeding, suggesting that the suppressive effects of insulin on gluconeogenesis are not immediate and that gluconeogenesis requires hours to be quantitatively suppressed. In addition to the classic insulin-mediated inhibition of gluconeogenesis by the phosphorylation of FoxO1, other novel players in the regulation of this process are starting to emerge. A recent report indicated that Cdc2-like kinase (Clk2), an insulin/AKT-induced gene, phosphorylates PGC1α, leading to a potent repression of gluconeogenic gene expression and hepatic glucose output (42). Moreover, the targets of rapamycin complex 2 (mTORC2) have been shown to be required for insulin suppression of hepatic gluconeogenesis in vivo, since chronic rapamycin treatment induces insulin resistance in liver (43). Thus, the identification of miR-33b as a suppressor of gluconeogenesis may represent an additional mechanism to ensure insulin inhibition of gluconeogenesis at the posttranscriptional level. In agreement with this hypothesis, it has recently been reported that metformin, a known antidiabetic drug that inhibits hepatic glucose production, induces the expression of miR-33 (44).
In summary, our results define a model whereby miR-33b and SREBP1 coordinately regulate the insulin signaling pathway and glucose metabolism at multiple points (Fig. 8F), a concept that is consistent with the hypothesis that miRNAs regulate signaling pathways by fine-tuning the production of a broad array of proteins rather than switching single components on or off (45). It is important to note that the contribution of miR-33 in regulating gluconeogenesis is missing in rodents because the conservation of miR-33b within intron 17 in the SREBP1 gene is lost. Therefore, future studies in nonhuman primates treated with miR-33b antisense oligonucleotides will be important to reveal the role of miR-33b in regulating the insulin-dependent SREBP1-mediated metabolic processes in the liver as well as in other metabolically active tissues.
ACKNOWLEDGMENTS
This work was supported by the National Institutes of Health (grants R01HL107953 and R01HL106063 to C.F.-H., R01HL105945 to Y.S., and 1F31AG043318-01 to L.G.), the American Heart Association (grant 12POST9780016 to C.M.R.), the Deutsche Forschungsgemeinschaft (to D.C.-S.), and the Ministerio de Educación (Programa Nacional de Movilidad de Recursos Humanos del Plan Nacional de I-D+i 2008-2011 [to N.R.]). R.D.C. was supported by the Intramural Research Program of the NIH National Institute on Aging.
Footnotes
Published ahead of print 28 May 2013
REFERENCES
- 1. Pilkis SJ, Granner DK. 1992. Molecular physiology of the regulation of hepatic gluconeogenesis and glycolysis. Annu. Rev. Physiol. 54:885–909 [DOI] [PubMed] [Google Scholar]
- 2. Herzig S, Long F, Jhala US, Hedrick S, Quinn R, Bauer A, Rudolph D, Schutz G, Yoon C, Puigserver P, Spiegelman B, Montminy M. 2001. CREB regulates hepatic gluconeogenesis through the coactivator PGC-1. Nature 413:179–183 [DOI] [PubMed] [Google Scholar]
- 3. Nakae J, Kitamura T, Silver DL, Accili D. 2001. The forkhead transcription factor Foxo1 (Fkhr) confers insulin sensitivity onto glucose-6-phosphatase expression. J. Clin. Invest. 108:1359–1367 [DOI] [PMC free article] [PubMed] [Google Scholar]
- 4. Rhee J, Inoue Y, Yoon JC, Puigserver P, Fan M, Gonzalez FJ, Spiegelman BM. 2003. Regulation of hepatic fasting response by PPARgamma coactivator-1alpha (PGC-1): requirement for hepatocyte nuclear factor 4alpha in gluconeogenesis. Proc. Natl. Acad. Sci. U. S. A. 100:4012–4017 [DOI] [PMC free article] [PubMed] [Google Scholar]
- 5. Yoon JC, Puigserver P, Chen G, Donovan J, Wu Z, Rhee J, Adelmant G, Stafford J, Kahn CR, Granner DK, Newgard CB, Spiegelman BM. 2001. Control of hepatic gluconeogenesis through the transcriptional coactivator PGC-1. Nature 413:131–138 [DOI] [PubMed] [Google Scholar]
- 6. Hall RK, Yamasaki T, Kucera T, Waltner-Law M, O'Brien R, Granner DK. 2000. Regulation of phosphoenolpyruvate carboxykinase and insulin-like growth factor-binding protein-1 gene expression by insulin. The role of winged helix/forkhead proteins. J. Biol. Chem. 275:30169–30175 [DOI] [PubMed] [Google Scholar]
- 7. Nakae J, Biggs WH, III, Kitamura T, Cavenee WK, Wright CV, Arden KC, Accili D. 2002. Regulation of insulin action and pancreatic beta-cell function by mutated alleles of the gene encoding forkhead transcription factor Foxo1. Nat. Genet. 32:245–253 [DOI] [PubMed] [Google Scholar]
- 8. Schmoll D, Walker KS, Alessi DR, Grempler R, Burchell A, Guo S, Walther R, Unterman TG. 2000. Regulation of glucose-6-phosphatase gene expression by protein kinase Balpha and the forkhead transcription factor FKHR. Evidence for insulin response unit-dependent and -independent effects of insulin on promoter activity. J. Biol. Chem. 275:36324–36333 [DOI] [PubMed] [Google Scholar]
- 9. Brunet A, Bonni A, Zigmond MJ, Lin MZ, Juo P, Hu LS, Anderson MJ, Arden KC, Blenis J, Greenberg ME. 1999. Akt promotes cell survival by phosphorylating and inhibiting a Forkhead transcription factor. Cell 96:857–868 [DOI] [PubMed] [Google Scholar]
- 10. Puigserver P, Rhee J, Donovan J, Walkey CJ, Yoon JC, Oriente F, Kitamura Y, Altomonte J, Dong H, Accili D, Spiegelman BM. 2003. Insulin-regulated hepatic gluconeogenesis through FOXO1-PGC-1alpha interaction. Nature 423:550–555 [DOI] [PubMed] [Google Scholar]
- 11. Brown MS, Goldstein JL. 1997. The SREBP pathway: regulation of cholesterol metabolism by proteolysis of a membrane-bound transcription factor. Cell 89:331–340 [DOI] [PubMed] [Google Scholar]
- 12. Horton JD, Goldstein JL, Brown MS. 2002. SREBPs: activators of the complete program of cholesterol and fatty acid synthesis in the liver. J. Clin. Invest. 109:1125–1131 [DOI] [PMC free article] [PubMed] [Google Scholar]
- 13. Osborne TF. 2000. Sterol regulatory element-binding proteins (SREBPs): key regulators of nutritional homeostasis and insulin action. J. Biol. Chem. 275:32379–32382 [DOI] [PubMed] [Google Scholar]
- 14. Foretz M, Guichard C, Ferre P, Foufelle F. 1999. Sterol regulatory element binding protein-1c is a major mediator of insulin action on the hepatic expression of glucokinase and lipogenesis-related genes. Proc. Natl. Acad. Sci. U. S. A. 96:12737–12742 [DOI] [PMC free article] [PubMed] [Google Scholar]
- 15. Foretz M, Pacot C, Dugail I, Lemarchand P, Guichard C, Le Liepvre X, Berthelier-Lubrano C, Spiegelman B, Kim JB, Ferre P, Foufelle F. 1999. ADD1/SREBP-1c is required in the activation of hepatic lipogenic gene expression by glucose. Mol. Cell. Biol. 19:3760–3768 [DOI] [PMC free article] [PubMed] [Google Scholar]
- 16. Owen JL, Zhang Y, Bae SH, Farooqi MS, Liang G, Hammer RE, Goldstein JL, Brown MS. 2012. Insulin stimulation of SREBP-1c processing in transgenic rat hepatocytes requires p70 S6-kinase. Proc. Natl. Acad. Sci. U. S. A. 109:16184–16189 [DOI] [PMC free article] [PubMed] [Google Scholar]
- 17. Shimomura I, Bashmakov Y, Ikemoto S, Horton JD, Brown MS, Goldstein JL. 1999. Insulin selectively increases SREBP-1c mRNA in the livers of rats with streptozotocin-induced diabetes. Proc. Natl. Acad. Sci. U. S. A. 96:13656–13661 [DOI] [PMC free article] [PubMed] [Google Scholar]
- 18. Shimomura I, Matsuda M, Hammer RE, Bashmakov Y, Brown MS, Goldstein JL. 2000. Decreased IRS-2 and increased SREBP-1c lead to mixed insulin resistance and sensitivity in livers of lipodystrophic and ob/ob mice. Mol. Cell 6:77–86 [PubMed] [Google Scholar]
- 19. Laffitte BA, Chao LC, Li J, Walczak R, Hummasti S, Joseph SB, Castrillo A, Wilpitz DC, Mangelsdorf DJ, Collins JL, Saez E, Tontonoz P. 2003. Activation of liver X receptor improves glucose tolerance through coordinate regulation of glucose metabolism in liver and adipose tissue. Proc. Natl. Acad. Sci. U. S. A. 100:5419–5424 [DOI] [PMC free article] [PubMed] [Google Scholar]
- 20. Yamamoto T, Shimano H, Nakagawa Y, Ide T, Yahagi N, Matsuzaka T, Nakakuki M, Takahashi A, Suzuki H, Sone H, Toyoshima H, Sato R, Yamada N. 2004. SREBP-1 interacts with hepatocyte nuclear factor-4 alpha and interferes with PGC-1 recruitment to suppress hepatic gluconeogenic genes. J. Biol. Chem. 279:12027–12035 [DOI] [PubMed] [Google Scholar]
- 21. Frost RJ, Olson EN. 2011. Control of glucose homeostasis and insulin sensitivity by the Let-7 family of microRNAs. Proc. Natl. Acad. Sci. U. S. A. 108:21075–21080 [DOI] [PMC free article] [PubMed] [Google Scholar]
- 22. Poy MN, Eliasson L, Krutzfeldt J, Kuwajima S, Ma X, Macdonald PE, Pfeffer S, Tuschl T, Rajewsky N, Rorsman P, Stoffel M. 2004. A pancreatic islet-specific microRNA regulates insulin secretion. Nature 432:226–230 [DOI] [PubMed] [Google Scholar]
- 23. Trajkovski M, Hausser J, Soutschek J, Bhat B, Akin A, Zavolan M, Heim MH, Stoffel M. 2011. MicroRNAs 103 and 107 regulate insulin sensitivity. Nature 474:649–653 [DOI] [PubMed] [Google Scholar]
- 24. Zhu H, Shyh-Chang N, Segre AV, Shinoda G, Shah SP, Einhorn WS, Takeuchi A, Engreitz JM, Hagan JP, Kharas MG, Urbach A, Thornton JE, Triboulet R, Gregory RI, Altshuler D, Daley GQ. 2011. The Lin28/let-7 axis regulates glucose metabolism. Cell 147:81–94 [DOI] [PMC free article] [PubMed] [Google Scholar]
- 25. Ambros V. 2004. The functions of animal microRNAs. Nature 431:350–355 [DOI] [PubMed] [Google Scholar]
- 26. Bartel DP. 2009. MicroRNAs: target recognition and regulatory functions. Cell 136:215–233 [DOI] [PMC free article] [PubMed] [Google Scholar]
- 27. Filipowicz W, Bhattacharyya SN, Sonenberg N. 2008. Mechanisms of post-transcriptional regulation by microRNAs: are the answers in sight? Nat. Rev. Genet. 9:102–114 [DOI] [PubMed] [Google Scholar]
- 28. Davalos A, Goedeke L, Smibert P, Ramirez CM, Warrier NP, Andreo U, Cirera-Salinas D, Rayner K, Suresh U, Pastor-Pareja JC, Esplugues E, Fisher EA, Penalva LO, Moore KJ, Suarez Y, Lai EC, Fernandez-Hernando C. 2011. miR-33a/b contribute to the regulation of fatty acid metabolism and insulin signaling. Proc. Natl. Acad. Sci. U. S. A. 108:9232–9237 [DOI] [PMC free article] [PubMed] [Google Scholar]
- 29. Gerin I, Clerbaux LA, Haumont O, Lanthier N, Das AK, Burant CF, Leclercq IA, MacDougald OA, Bommer GT. 2010. Expression of miR-33 from an SREBP2 intron inhibits cholesterol export and fatty acid oxidation. J. Biol. Chem. 285:33652–33661 [DOI] [PMC free article] [PubMed] [Google Scholar]
- 30. Marquart TJ, Allen RM, Ory DS, Baldan A. 2010. miR-33 links SREBP-2 induction to repression of sterol transporters. Proc. Natl. Acad. Sci. U. S. A. 107:12228–12232 [DOI] [PMC free article] [PubMed] [Google Scholar]
- 31. Najafi-Shoushtari SH, Kristo F, Li Y, Shioda T, Cohen DE, Gerszten RE, Naar AM. 2010. MicroRNA-33 and the SREBP host genes cooperate to control cholesterol homeostasis. Science 328:1566–1569 [DOI] [PMC free article] [PubMed] [Google Scholar]
- 32. Rayner KJ, Suarez Y, Davalos A, Parathath S, Fitzgerald ML, Tamehiro N, Fisher EA, Moore KJ, Fernandez-Hernando C. 2010. miR-33 contributes to the regulation of cholesterol homeostasis. Science 328:1570–1573 [DOI] [PMC free article] [PubMed] [Google Scholar]
- 33. Chopra AR, Louet JF, Saha P, An J, Demayo F, Xu J, York B, Karpen S, Finegold M, Moore D, Chan L, Newgard CB, O'Malley BW. 2008. Absence of the SRC-2 coactivator results in a glycogenopathy resembling Von Gierke's disease. Science 322:1395–1399 [DOI] [PMC free article] [PubMed] [Google Scholar]
- 34. Louet JF, Chopra AR, Sagen JV, An J, York B, Tannour-Louet M, Saha PK, Stevens RD, Wenner BR, Ilkayeva OR, Bain JR, Zhou S, DeMayo F, Xu J, Newgard CB, O'Malley BW. 2010. The coactivator SRC-1 is an essential coordinator of hepatic glucose production. Cell Metab. 12:606–618 [DOI] [PMC free article] [PubMed] [Google Scholar]
- 35. Jeong JW, Kwak I, Lee KY, White LD, Wang XP, Brunicardi FC, O'Malley BW, DeMayo FJ. 2006. The genomic analysis of the impact of steroid receptor coactivators ablation on hepatic metabolism. Mol. Endocrinol. 20:1138–1152 [DOI] [PubMed] [Google Scholar]
- 36. Dentin R, Liu Y, Koo SH, Hedrick S, Vargas T, Heredia J, Yates J, III, Montminy M. 2007. Insulin modulates gluconeogenesis by inhibition of the coactivator TORC2. Nature 449:366–369 [DOI] [PubMed] [Google Scholar]
- 37. Li X, Monks B, Ge Q, Birnbaum MJ. 2007. Akt/PKB regulates hepatic metabolism by directly inhibiting PGC-1alpha transcription coactivator. Nature 447:1012–1016 [DOI] [PubMed] [Google Scholar]
- 38. Matsumoto M, Pocai A, Rossetti L, Depinho RA, Accili D. 2007. Impaired regulation of hepatic glucose production in mice lacking the forkhead transcription factor Foxo1 in liver. Cell Metab. 6:208–216 [DOI] [PubMed] [Google Scholar]
- 39. Horton JD, Shimomura I, Brown MS, Hammer RE, Goldstein JL, Shimano H. 1998. Activation of cholesterol synthesis in preference to fatty acid synthesis in liver and adipose tissue of transgenic mice overproducing sterol regulatory element-binding protein-2. J. Clin. Invest. 101:2331–2339 [DOI] [PMC free article] [PubMed] [Google Scholar]
- 40. Hiraiwa H, Pan CJ, Lin B, Moses SW, Chou JY. 1999. Inactivation of the glucose 6-phosphate transporter causes glycogen storage disease type 1b. J. Biol. Chem. 274:5532–5536 [DOI] [PubMed] [Google Scholar]
- 41. Lei KJ, Shelly LL, Pan CJ, Sidbury JB, Chou JY. 1993. Mutations in the glucose-6-phosphatase gene that cause glycogen storage disease type 1a. Science 262:580–583 [DOI] [PubMed] [Google Scholar]
- 42. Rodgers JT, Haas W, Gygi SP, Puigserver P. 2010. Cdc2-like kinase 2 is an insulin-regulated suppressor of hepatic gluconeogenesis. Cell Metab. 11:23–34 [DOI] [PMC free article] [PubMed] [Google Scholar]
- 43. Lamming DW, Ye L, Katajisto P, Goncalves MD, Saitoh M, Stevens DM, Davis JG, Salmon AB, Richardson A, Ahima RS, Guertin DA, Sabatini DM, Baur JA. 2012. Rapamycin-induced insulin resistance is mediated by mTORC2 loss and uncoupled from longevity. Science 335:1638–1643 [DOI] [PMC free article] [PubMed] [Google Scholar]
- 44. Blandino G, Valerio M, Cioce M, Mori F, Casadei L, Pulito C, Sacconi A, Biagioni F, Cortese G, Galanti S, Manetti C, Citro G, Muti P, Strano S. 2012. Metformin elicits anticancer effects through the sequential modulation of DICER and c-MYC. Nat. Commun. 3:865. 10.1038/ncomms1859 [DOI] [PubMed] [Google Scholar]
- 45. Small EM, Olson EN. 2011. Pervasive roles of microRNAs in cardiovascular biology. Nature 469:336–342 [DOI] [PMC free article] [PubMed] [Google Scholar]