

Abstract
This study examined the impact of oral exposure to antibiotic-resistant bacteria and antibiotic administration methods on antibiotic resistance (AR) gene pools and the profile of resistant bacteria in host gastrointestinal (GI) tracts using C57BL/6J mice with natural gut microbiota. Mice inoculated with a mixture of tet(M)-carrying Enterococcus spp. or blaCMY-2-carrying Escherichia coli were treated with different doses of tetracycline hydrochloride (Tet) or ampicillin sodium (Amp) and delivered via either feed or intravenous (i.v.) injection. Quantitative PCR assessment of mouse fecal samples revealed that (i) AR gene pools were below the detection limit in mice without prior inoculation of AR gene carriers regardless of subsequent exposure to corresponding antibiotics; (ii) oral exposure to high doses of Tet and Amp in mice inoculated with AR gene carriers led to rapid enrichment of corresponding AR gene pools in feces; (iii) significantly less or delayed development of AR in the GI tract of the AR carrier-inoculated mice was observed when the same doses of antibiotics were administered via i.v. injection rather than oral administration; and (iv) antibiotic dosage, and maybe the excretion route, affected AR in the GI tract. The shift of dominant AR bacterial populations in the gut microbiota was consistent with the dynamics of AR gene pools. The emergence of endogenous resistant bacteria in the gut microbiota corresponding to drug exposure was also observed. Together, these data suggest that oral administration of antibiotics has a prominent effect on AR amplification and development in gut microbiota, which may be minimized by alternative drug administration approaches, as illustrated by i.v. injection in this study and proper drug selection.
INTRODUCTION
The rapid emergence of antibiotic-resistant (ART) pathogens constitutes a major public health threat. Selective pressure from clinical applications, as well as growth-promotional use of antibiotics in food animal production, is known as the main reason for the problem seen today. Therefore, antibiotic resistance mitigation approaches have been focused primarily on limiting the applications of antibiotics in both humans and food animals in recent decades (1, 2). However, limiting the prophylactic use of antibiotics may increase health risks of bacterial infections in humans, such as disease development in cystic fibrosis-susceptible populations and postsurgical complications in patients. Missing the opportunity for effective elimination of a small amount of planktonic cells by prompt application of antibiotics may further lead to the development of chronic illnesses caused by microbial biofilms, which are naturally resistant to further antibiotic treatment (3, 4). Meanwhile, it is worth noting that despite its extensive medical use worldwide, including during World War II, penicillin remained an effective therapeutic agent for a long time. In China, for instance, penicillin was effective for infectious diseases until the early 1980s, 40 years after its initial application.
Mitigation of AR may be impossible without taking the ecosystem into consideration. Bacteria have been shown to utilize or alter existing parts of the metabolic machinery into resistance determinants. Efflux pumps or the immunity genes of antimicrobial-producing strains may become a convenient source of resistance determinants once acquired by other bacteria (5–7). Therefore, it would not be a surprise that certain ART pathogens, such as Staphylococcus, have been detected under selective pressure shortly after antibiotic application (8), and resistance determinants were detected from locations that had never been exposed to antibiotics (9). However, the presence of resistance in limited numbers of bacteria is very different from systematically elevated AR levels in the microbial ecosystem. While the application of antibiotics, especially in food animal production, has been considered a main contributing factor that changed the balance, we asked the following question: did we miss any other key risk factors (4)?
Previous studies reported the prevalence of AR in the food chain, particularly those carried by the large population of commensal bacteria in ready-to-consume products (10–12), and the potential of commensal bacteria as facilitators for AR dissemination (13). During the examination of the impact of food-borne AR on human gut microbiota, ART gut microbiota were found to be rapidly developed in infants shortly after birth without antibiotic and conventional food exposure (14, 15). After comparing the bacteria populations in skin, food (potential routes for oral exposure), and fecal samples, the study concluded that the host gastrointestinal (GI) tract plays a key role in significant amplification of the ART bacteria even without antibiotic selective pressure (15). This finding is consistent with data from a study at an organic swine farm, where considerable levels of ART bacteria were found in feces from swine subjects that were not exposed to antibiotic treatment (16). Since the host GI tract has a primary role in AR amplification, a follow-up study was conducted to examine the impact of antibiotic administration approaches, including oral delivery and intravenous injection, on AR development in host gut microbiota, using mice born germfree but inoculated with tetracycline-resistant (Tetr) bacteria and raised in a conventional animal facility. The results revealed a significant difference in the AR gene pools between the two drug delivering methods in mice treated with tetracycline, suggesting a key role of drug administration routes in AR amplification in the gastrointestinal tract (17). In this study, we conducted comprehensive experiments to examine the interaction of oral AR bacterial exposure and antibiotic administration routes in AR development and enrichment in host gut microbiota. We used conventional mice maintained in a standard laboratory animal facility and treated them with two antibiotics, tetracycline hydrochloride and ampicillin sodium (Amp). Both can be administered via oral delivery or intravenous injection but differ in excretion routes. The results provided critical information regarding key risk factors involved in the rapid surge of AR in the gut microbial ecosystem, with potentially significant implications for both human medicine and food animal production.
MATERIALS AND METHODS
Bacterial strains and culture preparation.
Table 1 lists the strains used in this study. The nine tet(M)-carrying Enterococcus strains were isolated from healthy infant fecal samples (15), and the three blaCMY-2-carrying Escherichia coli isolates were acquired from feces of a dog (L. Zhang and H. H. Wang, unpublished data). MICs were determined as described in a previous publication (12). All strains were incubated in Columbia broth (Becton, Dickinson and Company, Franklin Lakes, NJ) at 37°C. Cells from 1 ml of overnight culture of each strain were collected by centrifugation, washed once with saline, and resuspended in 1 ml of saline. Both inoculation cocktails were prepared by mixing the designated strains and then standardizing the mix to 106 CFU/ml per strain (confirmed by plate count method) in the final cocktail.
Table 1.
Inocula of AR gene-carrying strains used in the study
| Cocktail no. and strain name | Resistance | MIC (μg/ml) | AR gene | DGGE cluster |
|---|---|---|---|---|
| 1 | ||||
| Enterococcus sp. strain C4-32 | Tetr | 64 | tet(M) | 1 |
| Enterococcus sp. strain C11-1 | Tetr | 512 | tet(M) | 2 |
| Enterococcus sp. strain C11-4 | Tetr | 64 | tet(M) | 1 |
| Enterococcus sp. strain C14-26 | Tetr | 256 | tet(M) | 2 |
| Enterococcus sp. strain C15-26 | Tetr | 64 | tet(M) | 1 |
| Enterococcus sp. strain C17-7 | Tetr | 512 | tet(M) | 2 |
| Enterococcus sp. strain C19-11 | Tetr | 128 | tet(M) | 2 |
| Enterococcus sp. strain G1-37 | Tetr | 256 | tet(M) | 3 |
| Enterococcus sp. strain G6-13 | Tetr | 128 | tet(M) | 4 |
| 2 | ||||
| Escherichia coli TB1-3 | Ampr | 512 | blaCMY-2 | 5 |
| Escherichia coli TB2-14 | Ampr | 512 | blaCMY-2 | 5 |
| Escherichia coli TB2-16 | Ampr | 512 | blaCMY-2 | 5 |
The mouse model.
All procedures were approved by the Institutional Animal Care and Use Committee (protocol no. 2009A0167; The Ohio State University, Columbus, OH). One-month-old male C57BL/6J mice were acquired from The Jackson Laboratory (Bar Harbor, ME) and maintained at the University Laboratory Animal Resources (ULAR) facility (ventilated, with air filtered and materials sterilized). Antibiotic doses (50 and 30 mg/kg body weight per day for high Tet and Amp, respectively) were selected based on clinical administration levels. Mouse fecal samples were collected and examined for the presence of tet(M) and blaCMY-2 gene pools. Once the absence of tested AR gene pools was confirmed, mice were subjected to a 4-day inoculation of the bacteria cocktail, during which the 9-strain tet(M)-carrying Enterococcus species cocktail or the 3-strain blaCMY2-carrying Escherichia coli mixture were introduced via gavage feeding (18) using 20-gauge, 1.5-in animal feeding needles (Fine Science Tools, Foster City, CA). For each set of experiments, 0.2 ml of the corresponding bacterial cocktail was used to feed mice every 24 h for 4 consecutive days. Meanwhile, mice in noninoculated control groups were fed with 0.2 ml of saline in the same manner. Mice were then put in cages for 2 days before antibiotic was administered.
Antibiotic administration.
Mice were grouped and treated as listed in Table 2. Each of the two administration groups contained 5 inoculated mouse subjects, whereas the four control groups contained 3 mouse subjects per group. Antibiotics were administered via gavage feeding by following the procedure described above or by tail vein injection (19) using a TV-150 mouse tail vein restrainer (Braintree Scientific, Braintree, MA) and a 1-ml insulin syringe (Becton, Dickinson and Company, Franklin Lakes, NJ). Mice were exposed to the corresponding antibiotics or saline for 5 consecutive days. Fresh fecal sample from each mouse subject was collected onsite during antibiotic administration once a day, and collections were continued at certain intervals after withdrawal of antibiotics, up to 14 days from initial antibiotic exposure.
Table 2.
C57BL/6J mouse groups subjected to antibiotic administration treatments
| Group and antibiotic | AR carrier inoculation strain | Antibiotic administration route |
|||
|---|---|---|---|---|---|
| Drug |
Saline (control) |
||||
| Oral | i.v. | Oral | i.v. | ||
| Tet, 50 mg/kg | |||||
| Tet50-PO | Enterococcus spp. | + | − | − | − |
| Tet50-IV | Enterococcus spp. | − | + | − | − |
| Saline-POt50 | Enterococcus spp. | − | − | + | − |
| Saline-IVt50 | Enterococcus spp. | − | − | − | + |
| NI-Tet50-PO | + | − | − | − | |
| NI-Tet50-IV | − | + | − | − | |
| Tet, 2 mg/kg | |||||
| Tet2-PO | Enterococcus spp. | + | − | − | − |
| Tet2-IV | Enterococcus spp. | − | + | − | |
| Saline-POt2 | Enterococcus spp. | − | − | + | − |
| Saline-IVt2 | Enterococcus spp. | − | − | − | + |
| NI-Tet2-PO | + | − | − | − | |
| NI-Tet2-IV | − | + | − | − | |
| Amp, 30 mg/kg | |||||
| Amp30-PO | Escherichia coli | + | − | − | − |
| Amp30-IV | Escherichia coli | − | + | − | − |
| Saline-POa30 | Escherichia coli | − | − | + | |
| Saline-IVa30 | Escherichia coli | − | − | − | + |
| NI-Amp30-PO | + | − | − | − | |
| NI-Amp30-IV | − | + | − | − | |
Culture recovery of gut microbiota.
Columbia blood agar base (CBA; Becton, Dickinson and Company, Franklin Lakes, NJ) supplemented with 5% defibrinated sheep blood (Fisher Scientific, Hampton, NH) was used to recover fecal microbiota from the mouse GI tract. For ART bacterium recovery, CBA plates were supplemented with one of the following antibiotics: 16 μg/ml of tetracycline (Fisher Biotech, Fair Lawn, NJ) or 32 μg/ml of ampicillin sodium (Life Technologies, Grand Island, NY). Cycloheximide (Sigma-Aldrich) was added to all agar plates, at 100 μg/ml, to minimize the growth of fungi. Mouse fecal samples were serially diluted in saline and plated in duplicate on the corresponding bacterial agar plates. The plates were incubated under anaerobic conditions using a GasPak 150 anaerobic system and GasPak EZ anaerobe container system sachets (Becton, Dickinson and Company) at 37°C for 48 h. The presence of targeted AR genes and the identities of the representative AR bacteria recovered were confirmed by conventional PCR and partial 16S rRNA gene sequence analysis as described previously (12).
DNA extraction.
Total DNA from mice fecal samples for real-time quantitative PCR (qPCR) and denaturing gradient gel electrophoresis (DGGE) analyses were extracted by following published procedures (20).
Real-time quantitative PCR.
TaqMan real-time PCR was used to assess tet(M) and 16S rRNA gene pools in mouse fecal DNA extracts as described previously (15). A set of primers and probe was developed by following established procedures (21) to measure the blaCMY-2 gene pool in this study. The sequences of the primers were 5′-GCCGTTGATGATCGAATC-3′ for blaCMY-2-realF and 5′-GCGTATTGGCGATATGTAC-3′ for blaCMY-2-realR, with 5′-6-carboxyfluorescein-AGTTCAGCATCTCCCAGCCTAATCC-black hole quencher 1-3′ as the blaCMY-2 probe. The primers and probes used in the assessment were synthesized by Sigma-Aldrich (St. Louis, MO) and Biosearch Technology, Inc. (Novato, CA), respectively. Each sample was analyzed in duplicate on a CFX96 system (Bio-Rad, Hercules, CA).
DGGE analysis.
PCR primers (16S-357F-GC and 16S-518R) targeting the 16S rRNA V3 region were used to amplify the partial 16S rRNA gene by following the procedure of Muyzer et al. (22). PCR products were loaded onto an 8% acrylamide gel with a 30 to 70% urea gradient. Electrophoresis was performed at 60°C and 83 V for 16 h using the DCode system for DGGE (Bio-Rad, Hercules, CA). The gel was stained with 0.01% ethidium bromide and visualized using a ChemiDoc XRS system (Bio-Rad, Hercules, CA).
Statistics.
Mixed-model analysis of variance (ANOVA) was applied for comparing the impact of different antibiotic administration routes, as well as different doses of tetracycline, on the time-dependent development of corresponding AR gene pools in the mouse GI tract. Data were analyzed using SPSS (v. 20). P < 0.05 is regarded as statistically significant.
RESULTS
Colonization and persistence of ingested antibiotic-resistant bacteria in the absence of antibiotic selective pressure.
At the end of the tet(M) carrier inoculation period and before exposure to the antibiotic, 9.2 ± 0.4 and 6.5 ± 0.8 log CFU/g of cultivable total and Tetr bacteria, respectively, were recovered on the corresponding CBA plates from 14 mouse subjects examined (from groups Tet50-PO, Tet50-IV, Saline-POt50, Tet2-PO, Tet2-IV, and Saline-POt2) (Table 2). Meanwhile, 9.3 ± 1.0 and 6.1 ± 0.3 log CFU/g of total and Tetr bacteria, respectively, were found in noninoculated mouse feces (groups NI-Tet50-PO and NI-Tet2-PO)(Table 2). The data illustrate the presence of cultivable total and Tetr residential population in all mouse subjects used in this study. In addition, inoculation of tet(M) carriers (Table 1) did not significantly change the sizes of the total or Tetr population in the mouse GI tract. Correspondingly, the sizes of the 16S rRNA gene pools were found to be 11.8 ± 0.5 and 12.0 ± 0.2 log copies/g in inoculated and noninoculated mice examined, respectively, confirming that the total population of fecal microbiota remained unchanged after inoculation. The total bacteria recovered by the culturing method accounted for no more than 1% of the total population by real-time PCR targeting of the 16S rRNA gene (9.3 ± 1.0 versus 11.8 ± 0.5 log copies/g), indicating that the majority of the bacterial population was unculturable. After inoculation, cultured Tetr bacteria represented a fraction of the total Tetr subpopulation and no more than 0.001% of the total gut microbiota; thus, its dynamics had no detectable impact on the total bacterial population plot (Fig. 1B). The pools of the tet(M) gene were rarely found to be above the detection limit in any of the mouse fecal samples before or after inoculation without Tet exposure, suggesting the lack of significant amplification or colonization of the inoculated microbiota in the presence of a residential population in the mouse GI tract (Fig. 1A and C, day 0). This is further substantiated by DGGE analysis (Fig. 2, lanes 2 and 3) using total DNA extracts from mouse fecal samples. Very little difference in the profiles of predominant bacterial populations was detected between feces from mice before and after the inoculation.
Fig 1.

Real-time PCR quantification of AR gene pools in mice upon corresponding antibiotic exposure. The detection limit of AR gene pools in this study is 105 copies/g. If data were below the detection limit, they are presented as being at the detection limit. (A and C) tet(M) gene pool with Tet treatment at 50 (A) or 2 (C) mg/kg body weight/day. (E) blaCMY-2 gene pool with Amp treatment at 30 mg/kg body weight/day. (B, D, and F) 16S rRNA gene pool with Tet at 50 (B) or 2 (D) mg/kg body weight/day or Amp at 30 (F) mg/kg body weight/day. Data presented include ART bacteria-inoculated experimental groups with corresponding oral Tet (Tet50-PO, Tet2-PO), Amp (Amp30-PO), i.v. Tet (Tet50-IV, Tet2-IV), i.v. Amp (Amp30-IV); ART bacteria-inoculated control groups with saline instead of antibiotic treatment (saline-POt50, saline-POt2, saline-POa30, and saline-IVa30); control groups without bacterial inoculation but treated with antibiotics (NI-Tet50-PO, NI-Tet2-PO, NI-Amp30-PO, NI-Amp30-IV). Data are not shown for control groups saline-IVt50, NI-Tet50-IV, saline-IVt2, and NI-Tet2-IV, which are similar to those for saline-POt50, NI-Tet50-PO, saline-POt2, and NI-Tet2-PO groups, respectively. The error bars represent standard deviations of the data from animal subjects used in the study. The vertical dashed lines indicate the last day of antibiotic administration.
Fig 2.
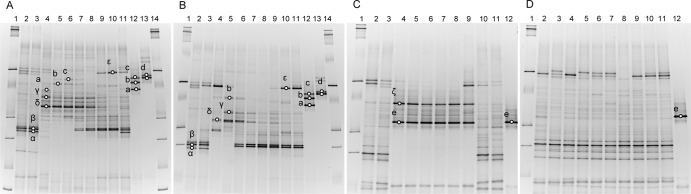
Denaturing gradient gel electrophoresis analysis of predominant 16S rRNA genes in total fecal DNA extracts from inoculated mice administered with antibiotics. Mouse subjects were exposed to 50 mg/kg body weight/day Tet via the oral (A) and i.v. (B) route or to 30 mg/kg body weight/day Amp via the oral (C) and i.v. (D) route. In panels A and B, fecal DNA of a mouse subject before inoculation with the strain cocktail (lane 2); after inoculation but before Tet administration (lane 3); 1, 2, 3, 4, and 5 days with Tet exposure (lanes 4 to 8); and 8, 10, and 14 days (Tet was lifted; lanes 9 to 11) were used as the template to amplify the 16S rRNA gene V3 region. Marker (lanes 1 and 14) and inoculated strain clusters (lanes 12 and 13) were included. In panels C and D, fecal DNA from a mouse subject before cocktail strain inoculation (lane 2); after inoculation but before Amp administration (lane 3); 1, 2, 3, 4, and 5 days with Amp administration (lanes 4 to 8); and 7, 11, and 15 days (Amp was lifted; lanes 9 to 11) were used to amplify the 16S rRNA gene V3 region. Lane 1, DNA ladder; lane 12, inoculated strain cluster. Residential strain symbols: α, β, and γ, uncultured bacteria; δ, Escherichia coli; ε, Lactobacillus species; ζ, Enterococcus species. Inoculated strains: a, strain cluster 3; b, strain cluster 2; c, strain cluster 1; d, strain cluster 4; e, strain cluster 5.
Meanwhile, the Ampr subpopulation was not detected from the initial mouse residential gut microbiota examined in this study, indicating that all Ampr microbiota observed in this study originated from external inoculation or developed after exposure to Amp (data not shown). After being inoculated with blaCMY-2-carrying Escherichia coli strains, 5.4 ± 1.6 log CFU/g of Ampr bacteria was isolated from mouse fecal samples (groups Amp30-PO, Amp30-IV, Saline-POa30, and Saline-IVa30), although total bacterial counts remained at 9 to 10 log CFU/g before and after the inoculation. Meanwhile, the 16S rRNA gene pool was found to be 1012 copies/g in all mouse fecal samples regardless of inoculation. The blaCMY-2 gene pool ranged from below the detection limit (105 copies/g) to 108 copies/g 2 days after inoculation, although it was below the detection limit in all mice examined before inoculation. The data illustrated that inoculation of blaCMY-2-carrying Escherichia coli (Table 1) did not affect the size of the total bacterial population in the mouse GI tract. However, it changed the constitution of mouse GI microbiota, so that the corresponding bacteria and AR gene pool are detectable by plate count and real-time PCR. Meanwhile, results from the DGGE analysis showed that the inoculated Ampr Escherichia coli population did not become a predominant member of the bacterial population before antibiotic administration. There were minimal differences in 16S-DGGE profiles of fecal DNA extracts from the same mice before and after the inoculation (Fig. 2C and D, lanes 2 and 3).
Effect of Tet administration on AR gene pool in mouse GI tract.
Figure 1A illustrated that exposure to high doses of Tet quickly induced significant amplification of the tet(M) gene pool in feces from inoculated mice in both the orally fed (from mostly below the detection limit before exposure to 8.7 ± 0.6 log copies/g 1 day after initial exposure) and the i.v. injection (from below the detection limit before exposure to 5.7 ± 1.0 log copies/g 1 day after initial exposure) groups throughout the 5-day administration period (day 0 through day 4) and up to 5 days after withdrawal of Tet administration (day 10). The tet(M) pool was found to be below the detection limit in inoculated mouse subjects exposed to saline and in noninoculated mouse subjects exposed to the same dose of Tet throughout the experimental period (Fig. 1A). The data suggested that the amplified tet(M) pool resulted from proliferation of previously seeded external tet(M) carriers upon Tet exposure. After Tet administration was ended on day 5, the amplified tet(M) pool gradually diminished. By day 14, 9 days after Tet exposure was removed, the tet(M) pool was found to be below the detection limit in all mouse subjects examined (Fig. 1A; also see the supplemental material for raw data plots and additional supporting evidence). As illustrated in Fig. 1B, no significant change in the 16S rRNA gene pool, an indicator of total bacteria population level, was observed in any of the treated groups.
A significant difference in the sizes of the tet(M) pools was observed between oral and i.v. administration groups by repeated-measures two-way ANOVA upon exposure to high doses of Tet (P < 0.05), even though similar sizes of the 16S rRNA gene pool were found in mouse subjects in these two groups. As illustrated in Fig. 1A, feces from mouse subjects in the oral group contained significantly larger tet(M) gene pools than those in the injection group during early stages (first 4 days) of Tet administration, with the maximal difference being observed shortly after initial exposure (day 1; 3 log difference in mean values). The differences in the sizes of the fecal tet(M) gene pool between oral and i.v. groups gradually diminished during high-dose Tet administration. By day 5, the difference became statistically insignificant (see the supplemental material for raw data plots). When mice were exposed to low doses of Tet, no significant change in the 16S rRNA gene pool was detected throughout the examination period in all experimental and control groups (Fig. 1D). Similar to high-dose groups, the sizes of the tet(M) gene pool in inoculated mice exposed to saline and noninoculated mice exposed to Tet remained below the detection limit throughout the examination period. The tet(M) gene pool in inoculated mouse subjects reached the highest level 3 days (oral group) and 5 days (i.v.) after initial Tet exposure. As illustrated in Fig. 1C, the tet(M) pool evolved sooner in samples from the orally administered group than from the i.v. group. By day 3, 4 out of 5 mouse subjects examined in the orally administered group had developed considerable tet(M) pools, averaging 6.3 log copies/g. Meanwhile, no mice in the injection group had detectable levels of the tet(M) pool at that point. At the end of antibiotic administration (day 5), 4 out of 5 mouse subjects in the oral group (average of 6.9 log copies/g) and 3 out of 5 mouse subjects in the injection group (average of 6.9 log copies/g) had detectable levels of tet(M) pools in their feces. Overall, with low-dose Tet, the differences in the sizes of the tet(M) gene pools between the oral and i.v. treatment groups were relatively small, but differences among subjects became obvious (see the supplemental material for raw data plots). The increased tet(M) pools in mouse fecal samples gradually diminished after Tet exposure was ended. By day 14, 9 days after Tet administration was terminated, the tet(M) pool was below the detection limit in most inoculated mouse subjects. It is also worth noting that one mouse subject in the injection group never developed a detectable tet(M) pool throughout the period of study.
Besides the observed difference in tet(M) pool development between Tet administration routes, the effect of Tet dose on the tet(M) pool was also assessed. The peak levels of the tet(M) pools were found to be significantly lower, and the development was slower, in mice exposed to low-dose Tet than those in mice exposed to high-dose Tet (6.6 ± 0.9 log copies/g in the low-dose oral group Tet2-PO on day 4 versus 8.7 ± 0.6 log copies/g in the high-dose oral group Tet50-PO on day 1). Tet dosage was identified as a significant between-subject factor by mixed-model ANOVA (P < 0.05) contributing to the difference in the sizes of the tet(M) pool observed in the different dosage groups.
Impact of Amp administration on AR gene pool in mouse GI tract.
The impact of antibiotic administration routes on AR in gut microbiota was further assessed by Amp. The sizes of the blaCMY-2 pool in all inoculated mouse subjects were similar (6.9 ± 0.9 log copies/g) before antibiotic administration (Fig. 1E), and Amp administration had minimal influence on the 16S rRNA gene pool in feces from inoculated mice throughout the antibiotic administration period and thereafter (Fig. 1F). The 16S rRNA (Fig. 1E) and blaCMY-2 gene pools (Fig. 1F) remained unchanged in inoculated mice exposed to saline throughout the experimental period. However, the antibiotic selective pressure quickly induced dramatic amplification of the blaCMY-2 gene pool (from 7.1 ± 0.5 log copies/g before exposure to 11.2 ± 0.1 log copies/g 1 day after initial exposure), which was maintained throughout the Amp administration period in the Amp oral dosing group and gradually diminished starting from 2 days (day 7) after Amp was discontinued (Fig. 1E). Meanwhile, the sizes of the blaCMY-2 pools remained unchanged throughout the period in mouse subjects exposed to Amp via the tail vein injection route. A significant difference between the oral and i.v. administration routes was again confirmed in fecal blaCMY-2 gene pool sizes in Amp-treated mice by mixed-model ANOVA (P < 0.05). Meanwhile, the difference in fecal blaCMY-2 gene pools between the i.v. administered Amp group and saline groups is statistically insignificant. At the end of the antibiotic withdrawal period, blaCMY-2 pools in all subjects resumed original levels (see the supplemental material for raw data plots and repeats).
Meanwhile, oral Amp administration reduced the 16S rRNA gene pools in feces from all 3 noninoculated mouse subjects, and the blaCMY-2 gene pools remained below the detection limit throughout the monitored period (Fig. 1E). The data indicated a reduction of total bacterial population after oral Amp exposure in noninoculated mice, likely due to the lack of a residential Ampr population and blaCMY-2 gene carriers in the GI tract of mouse subjects used in this study. The reduction in total bacterial population, as illustrated by the 16S rRNA gene pool, was quickly recovered (in 2 days) once the antibiotic administration was stopped.
Impact of Tet administration on GI bacterial population shift.
For the high-dose Tet experiment, plate count results showed that the total bacterial population remained largely unchanged throughout the experimental period in control and experimental mice. Tetr bacteria in inoculated mice increased from 6.5 ± 0.8 to 9.0 ± 0.3 and 8.4 ± 1.2 log CFU/g in the oral and i.v. groups, respectively, 1 day after initial Tet exposure, versus unchanged Tetr populations in inoculated mice exposed to saline. The data indicated that the exposure to high-dose Tet induced constitutional changes in microbiota populations in inoculated mouse subjects shortly after drug administration. The increase of Tetr population diminished following withdrawal of Tet exposure (from day 10, 5 days after the end of Tet administration). PCR screening of partial tet(M) carriers in Tetr populations showed that the level of tet(M) carriers was below the detection limit in inoculated mouse subjects before Tet exposure. In the oral Tet group, the average fecal Tetr bacterial levels of a subject were found to be 2.6 × 10⁶ [0% tet(M)+], 1.5 × 10⁹ [8% tet(M)+], 5.6 × 10⁸ [37% tet(M)+], 6.3 × 10⁷ [50% tet(M)+], and 1.8 × 10⁶ [0% tet(M)+] CFU/g, on days 0, 1, 3, 5, and 14 during the experiment. In the Tet-IV group, the average numbers for a subject were 3.6 × 10⁶ [0% tet(M)+], 7.9 × 10⁸ [0% tet(M)+], 5.1 × 10⁸ [4% tet(M)+], 1.5 × 10⁸ [83.3% tet(M)+], and 3.6 × 10⁷ [2% tet(M)+] CFU/g during the same period. DGGE analysis further illustrated that inoculated enterococcal strains in clusters 1, 2, and 3 (MICs ranged from 64 to 512 μg/ml) were significantly proliferated from day 1, indicating their contribution to the increase of the tet(M) pool in mouse feces (Fig. 2A). In agreement with the plate count, PCR, and quantitative PCR results, the residential Tetr population, including several feces-related Escherichia coli and Lactobacillus spp. and uncultured bacteria, were also significantly amplified in inoculated mice (Fig. 2A) and noninoculated mice (data not shown) upon Tet exposure. As illustrated in Fig. 2A and B, inoculation of the 9-strain enterococcal cocktail caused little change in the dominant gut microbiota in mouse subjects (lane 2 and 3), and inoculated strains were below the detection limit before Tet exposure. High-dose Tet exposure, regardless of administration route, induced a dramatic change of dominant gut microbiota profile in the mouse GI tract (lane 4 to 8). Two days after initial exposure, inoculated strain clusters 1, 2, and 3 (c, b, and a) were found to be part of the predominant GI microbiota in mouse exposed to Tet via the oral route. Strain cluster 2 was also detected 1 day after initial Tet exposure in the i.v. group. In both oral and i.v. groups, Tet exposure also triggered population shifts of endogenous gut microbiota. For instance, subpopulations γ and δ, identified as uncultured bacteria and Escherichia coli, respectively, were first amplified, and then some of their levels decreased (Fig. 2B, between lanes 6 to 8); meanwhile, α, β, and ε, identified as two uncultured bacterial species and Lactobacillus species, respectively, were first decreased, but some recovered afterwards (such as β). The dynamics could be due to the emergence of a resistant subpopulation (such as β) and relative fitness of the subpopulations under the specific environmental conditions. After Tet withdrawal, the amplified endogenous and inoculated subpopulations described above quickly diminished (lanes 9 to 11), while the inhibited subpopulations α, β, and ε recovered. Subpopulation β appeared even during Tet administration (Fig. 2A, lanes 7 and 8, and B, lanes 6 to 8), indicating the emergence of an endogenous resistant subpopulation due to Tet selective pressure.
In the experiment with low-dose Tet, the levels of total and Tetr bacterial populations remained largely unchanged throughout the experimental period by plate count. The difference in predominant bacterial profiles (genus and species) upon exposure to low-dose Tet between the oral and i.v. routes was hardly detectable by 16S rRNA PCR-coupled DGGE analysis (data not shown).
Impact of Amp administration on GI bacterial population shift.
The shifts in the sizes of the 16S rRNA and blaCMY-2 gene pools in mouse fecal samples associated with different Amp administration routes were also found to be consistent with results from total and Ampr population analyses. An increase of the Ampr population in samples from inoculated mice was observed after exposure to Amp (from 5.8 ± 0.6 log CFU/g before exposure to 10.1 ± 0.0 log CFU/g 1 day after initial exposure) through oral administration but remained unchanged in feces of inoculated mouse subjects receiving i.v. Amp. Further assessment by DGGE showed that initial inoculation of blaCMY-2-carrying E. coli did not significantly change the profile of mouse GI microbiota. Oral exposure to Amp induced amplification of inoculated E. coli strains (e) as well as endogenous residential strain (ζ; Enterococcus species) in the mouse GI tract, but it inhibited other Amps residential subpopulations during Amp administration (Fig. 2C). However, the profile of dominant GI microbiota in mouse subjects receiving Amp via injection remained mainly unchanged throughout Amp exposure, with no inoculated strains or endogenous strains being significantly amplified upon antibiotic administration, indicating minimal impact when the antibiotic was introduced through injection (Fig. 2D). Withdrawal of Amp led to a restoration of the initial profile of dominant microbiota in the mouse GI tract before Amp administration (Fig. 2C and D).
The Ampr population was not detected in mice without inoculation of the blaCMY-2-containing E. coli by plate counting. Similar to the observation for inoculated mouse subjects, plate count data showed that orally administered Amp significantly affected GI microbiota in noninoculated mice, reducing the total bacterial population significantly shortly after initial Amp exposure, whereas i.v. administered Amp did not change total bacterial populations in fecal samples from noninoculated mouse subjects. The results are in agreement with data from the 16S rRNA gene pool assessment. Similar to inoculated mice, DGGE analysis showed that the endogenous residential Enterococcus species (ζ) strain, but not the blaCMY-2-carrying Escherichia coli (e) strain, was significantly amplified in noninoculated mice upon oral exposure but not when Amp was introduced by injection (data not shown). Withdrawal of Amp induced similar restoration of residential microbiota in mouse fecal samples and annihilation of the amplified Enterococcus strain.
DISCUSSION
Antibiotics have helped us conquer bacterial infectious diseases in the past 70 years. However, the rapid emergence of AR since the 1980s has caused serious consequences to human health and social welfare. While the current AR mitigation approach, restricting the use of antibiotics in both clinical therapy and food animal production, may be helpful to some extent, it is inevitable that sick people and animals still need to be treated with antibiotics. The food animal industry is concerned that limiting the use of antibiotics in food animal production will compromise disease prevention and productivity. Meanwhile, there is a lack of knowledge regarding the actual cost of the current AR mitigation approach to both human and animal health, from postsurgical complications to the development of biofilm-related chronic diseases, without prompt application of antibiotics.
Besides the use of antibiotics, evidence from the past few years clearly presents a complicated picture of AR emergence, development, dissemination, and persistence, with multiple risk factors, some of which have yet to be recognized (10, 11, 23–28). By shifting the investigation and mitigation scope from limited numbers of pathogens to commensal populations and microbial ecosystems, we were able to reveal the contribution of the food chain as a main avenue in transmitting AR to humans (4, 12, 21, 29) and to discover the importance of the host GI tract in the amplification, dissemination, and circulation of AR in the global ecosystem, even without direct exposure to antibiotics (16, 26, 30, 31). Further, this study clearly demonstrated the impact of oral administration of antibiotics on resistance development in host gut microbiota. Without oral inoculation or preexistence of AR gene-containing bacteria, the corresponding AR gene pools were not detected after antibiotic exposure during the experimental period. The increase of resistant bacterial populations was mostly due to the amplification of orally introduced AR strains (a, b, c, d, and e) and the emergence of endogenous resistant populations (γ, δ, and ζ). The effect was especially prominent when antibiotics were introduced orally. As mentioned previously, conventional food intake is likely the most significant route of ART bacterial and AR gene exposure in the general public, while infants may also get ART bacteria via oral exposure through birth delivery, skin and environmental contact (e.g., breast-feeding), or other interactions (15). These findings are consistent with data from previous publications, such as the prevalence of AR in human and animal feces (14, 25, 32) as well as in lagoon wastes (6, –35), but with different research perspectives and interpretations of results.
Antibiotic application led to the rise of AR in gut microbiota, illustrated by both the increase of AR gene pool and AR bacterial population sizes during Tet or Amp administration in this study. After the lifting of antibiotic selective pressure, the AR gene pools and the resistant population gradually diminished in both cases. This result does not exclude the possibility that, when introduced, ART strains have certain niche fitness advantages beyond antibiotic resistance (this was not seen in this case) over the existing gut bacteria, and the resistant population may sustain and become part of the residential bacteria, contributing to increased AR in the gut microbiota. It is also evident that oral antibiotic administration has a significant effect on the rise of resistance in the residential gut microbiota. While the endogenous ART population gradually reduced after ceasing administration of the corresponding antibiotics in this study, it is well established that once they have emerged, certain ART bacteria, such as fluoroquinolone-resistant Campylobacter, can dominate and persist in host (chicken) gut microbiota due to niche fitness (36). Thus, it is plausible that antibiotic administration approaches have a critical influence on AR in gut microbiota, from emergence to amplification to persistence.
According to the CDC, the rapid rise of methicillin-resistant Staphylococcus aureus (MRSA) incidences started in the mid-1980s, and vancomycin-resistant enterococci (VRE) and incidences of fluoroquinolone-resistant Pseudomonas aeruginosa (FQRP) started in the early 1990s (http://www.idsociety.org/uploadedFiles/IDSA/Policy_and_Advocacy/Current_Topics_and_Issues/Antimicrobial_Resistance/10x20/Images/Bad%20Bugs%20no%20Drugs.pdf). For a long time, we believed that the problem resulted from the broad use of antibiotics in both clinics and food animal production. It is interesting that the timing of the AR climbing trend also coincided with the change in primary antibiotic delivery approach from injection to oral administration in human clinical therapy. In food animal production, antibiotics are delivered through feed or water for growth-promotional, prophylactic, and therapeutic purposes. Could the AR problem actually largely be due to how we have used antibiotics in the past 30 years? Oral antibiotic delivery exposed gut microbiota to unnecessary antibiotic selective pressure, and certain percentages of the antibiotics are absorbed by the GI tract. Therefore, higher drug doses are needed for oral therapy than for injection in order to achieve the same effective antibiotic concentration in the target sites. Practically similar or higher doses of antibiotics are often used in injection than in oral administration. However, most likely the high doses are due to the need to treat severe cases of infection by injection.
Results from our studies strongly supported the hypothesis described above by demonstrating that the rising of AR (magnitude and timing) in gut microbiota is directly correlated with (i) antibiotic application dosage, illustrated by both oral and injection administration in the case of tetracycline resistance, and (ii) antibiotic delivery approach, illustrated by oral and i.v. deliveries in the cases of both tetracycline and ampicillin. In addition, the difference in AR between oral and i.v. routes is much more significant for ampicillin than tetracycline. Part of this may be due to the difference in drug excretion routes. Ampicillin is excreted mainly by the renal route (37); therefore, gut microbiota will have minimum drug exposure if delivered by injection. However, tetracycline is excreted via both the kidney (glomerular filtration) and the GI tract (biliary elimination and directly) (38). Thus, even with injection, the gut microbiota will still be exposed to the drug and derivatives to some extent. As fecal waste from billions of human beings and animals are the most important source of ART bacteria and AR genes circulating in the global ecosystem, and due to the magnitude of oral antibiotic administration practices for both humans and animals in recent decades, our work may have revealed one of the most significant risk factors in the rapid rise of AR known to date. While further studies are needed to assess the impact of more antibiotics, as well as detailed parameters, such as drug administration intervals on AR developed in the host GI tract, recognizing that the current mainstream antibiotic administration practices is a key risk factor for AR is a major knowledge breakthrough. It provides a different yet rational interpretation of the magnitude of the AR problem seen today, and most importantly, it makes effective AR mitigation an achievable mission. Prudent use of antibiotics may need to be focused more on how, what, and when to use antibiotics (28). With ongoing research on options for effective drug delivery and rational selection of drugs for applications, regaining control of bacterial infectious diseases without sacrificing prompt disease treatment and prevention may become an achievable goal.
Supplementary Material
ACKNOWLEDGMENTS
We thank Normand St-Pierre, from OSU Animal Science, for valuable input on statistical data analysis.
This work was supported by an Ohio Agriculture and Research Development Center (OARDC) seed grant to H.H.W. and T.B., Pew Foundation project RF60034580 (OSU) to H.H.W., and Chinese Scholarship Council (CSC) fellowship to Y.H. and Y.Z.
Footnotes
Published ahead of print 20 May 2013
Supplemental material for this article may be found at http://dx.doi.org/10.1128/AAC.00670-13.
REFERENCES
- 1. Casewell M, Friis C, Marco E, McMullin P, Phillips I. 2003. The European ban on growth-promoting antibiotics and emerging consequences for human and animal health. J. Antimicrob. Chemother. 52:159–161 [DOI] [PubMed] [Google Scholar]
- 2. Tenover FC, McGowan JE., Jr 1996. Reasons for the emergence of antibiotic resistance. Am. J. Med. Sci. 311:9–16 [DOI] [PubMed] [Google Scholar]
- 3. Wang H, McEntire JC, Zhang L, Li X, Doyle M. 2012. The transfer of antibiotic resistance from food to humans: facts, implications and future directions. Rev. Sci. Tech. 31:249–260 [DOI] [PubMed] [Google Scholar]
- 4. Wang HH. 2009. Commensal bacteria, microbial ecosystems and horizontal gene transmission: adjusting our focus for strategic breakthroughs against antibiotic resistance, p 267–281 In Jaykus L, Wang HH, Schlesinger L. (ed), Foodborne microbes: shaping the host ecosystems, 1st ed ASM Press, Washington, DC [Google Scholar]
- 5. Jacoby GA. 2005. Mechanisms of resistance to quinolones. Clin. Infect. Dis. 41(Suppl. 2):S120–S126 [DOI] [PubMed] [Google Scholar]
- 6. Poole K. 2005. Efflux-mediated antimicrobial resistance. J. Antimicrob. Chemother. 56:20–51 [DOI] [PubMed] [Google Scholar]
- 7. Stein T, Heinzmann S, Solovieva I, Entian K. 2003. Function of Lactococcus lactis nisin immunity genes nisI and nisFEG after coordinated expression in the surrogate host Bacillus subtilis. J. Biol. Chem. 278:89–94 [DOI] [PubMed] [Google Scholar]
- 8. Livermore DM. 2000. Antibiotic resistance in staphylococci. Int. J. Antimicrob. Agents 16(Suppl. 1):S3–S10 [DOI] [PubMed] [Google Scholar]
- 9. Allen HK, Donato J, Wang HH, Cloud-Hansen KA, Davies J, Handelsman J. 2010. Call of the wild: antibiotic resistance genes in natural environments. Nat. Rev. Microbiol. 8:251–259 [DOI] [PubMed] [Google Scholar]
- 10. Duran GM, Marshall DL. 2005. Ready-to-eat shrimp as an international vehicle of antibiotic-resistant bacteria. J. Food Prot. 68:2395–2401 [DOI] [PubMed] [Google Scholar]
- 11. Li X, Alvarez V, Harper WJ, Wang HH. 2011. Persistent, toxin-antitoxin system-independent, tetracycline resistance-encoding plasmid from a dairy Enterococcus faecium isolate. Appl. Environ. Microbiol. 77:7096–7103 [DOI] [PMC free article] [PubMed] [Google Scholar]
- 12. Wang HH, Manuzon M, Lehman M, Wan K, Luo H, Wittum TE, Yousef A, Bakaletz LO. 2006. Food commensal microbes as a potentially important avenue in transmitting antibiotic resistance genes. FEMS Microbiol. Lett. 254:226–231 [DOI] [PubMed] [Google Scholar]
- 13. Luo H, Wan K, Wang HH. 2005. High-frequency conjugation system facilitates biofilm formation and pAMbeta1 transmission by Lactococcus lactis. Appl. Environ. Microbiol. 71:2970–2978 [DOI] [PMC free article] [PubMed] [Google Scholar]
- 14. Kinkelaar D, Wang H. 2008. Profiles of tetracycline resistant bacteria in the human infant digestive system. Masters thesis The Ohio State University, Columbus, OH [Google Scholar]
- 15. Zhang L, Kinkelaar D, Huang Y, Li Y, Li X, Wang HH. 2011. Acquired antibiotic resistance: are we born with it? Appl. Environ. Microbiol. 77:7134–7141 [DOI] [PMC free article] [PubMed] [Google Scholar]
- 16. Stanton TB, Humphrey SB, Stoffregen WC. 2011. Chlortetracycline-resistant intestinal bacteria in organically raised and feral swine. Appl. Environ. Microbiol. 77:7167–7170 [DOI] [PMC free article] [PubMed] [Google Scholar]
- 17. Zhang L, Wang H. 2011. Establishment and development of antibiotic resistant bacteria in human gastrointestinal tract: food, drug, or are we born with it? PhD dissertation The Ohio State University, Columbus, OH [Google Scholar]
- 18. Nguyen T, Hamby A, Massa SM. 2005. Clioquinol down-regulates mutant huntingtin expression in vitro and mitigates pathology in a Huntington's disease mouse model. Proc. Natl. Acad. Sci. U. S. A. 102:11840–11845 [DOI] [PMC free article] [PubMed] [Google Scholar]
- 19. Belur LR, Podetz-Pedersen K, Frandsen J, McIvor RS. 2007. Lung-directed gene therapy in mice using the nonviral Sleeping Beauty transposon system. Nat. Protoc. 2:3146–3152 [DOI] [PubMed] [Google Scholar]
- 20. Yu Z, Morrison M. 2004. Improved extraction of PCR-quality community DNA from digesta and fecal samples. Biotechniques 36:808–812 [DOI] [PubMed] [Google Scholar]
- 21. Manuzon MY, Hanna SE, Luo H, Yu Z, Harper WJ, Wang HH. 2007. Quantitative assessment of the tetracycline resistance gene pool in cheese samples by real-time TaqMan PCR. Appl. Environ. Microbiol. 73:1676–1677 [DOI] [PMC free article] [PubMed] [Google Scholar]
- 22. Muyzer G, de Waal EC, Uitterlinden AG. 1993. Profiling of complex microbial populations by denaturing gradient gel electrophoresis analysis of polymerase chain reaction-amplified genes coding for 16S rRNA. Appl. Environ. Microbiol. 59:695–700 [DOI] [PMC free article] [PubMed] [Google Scholar]
- 23. Bartoloni A, Bartalesi F, Mantella A, Dell'Amico E, Roselli M, Strohmeyer M, Barahona HG, Barron VP, Paradisi F, Rossolini GM. 2004. High prevalence of acquired antimicrobial resistance unrelated to heavy antimicrobial consumption. J. Infect. Dis. 189:1291–1294 [DOI] [PubMed] [Google Scholar]
- 24. Gilliver MA, Bennett M, Begon M, Hazel SM, Hart CA. 1999. Antibiotic resistance found in wild rodents. Nature 401:233–234 [DOI] [PubMed] [Google Scholar]
- 25. Gueimonde M, Salminen S, Isolauri E. 2006. Presence of specific antibiotic (tet) resistance genes in infant faecal microbiota. FEMS Immunol. Med. Microbiol. 48:21–25 [DOI] [PubMed] [Google Scholar]
- 26. Lancaster H, Ready D, Mullany P, Spratt D, Bedi R, Wilson M. 2003. Prevalence and identification of tetracycline-resistant oral bacteria in children not receiving antibiotic therapy. FEMS Microbiol. Lett. 228:99–104 [DOI] [PubMed] [Google Scholar]
- 27. Shen Z, Pu XY, Zhang Q. 2011. Salicylate functions as an efflux pump inducer and promotes the emergence of fluoroquinolone-resistant Campylobacter jejuni mutants. Appl. Environ. Microbiol. 77:7128–7133 [DOI] [PMC free article] [PubMed] [Google Scholar]
- 28. Wang HH, Schaffner DW. 2011. Antibiotic resistance: how much do we know and where do we go from here? Appl. Environ. Microbiol. 77:7093–7095 [DOI] [PMC free article] [PubMed] [Google Scholar]
- 29. Li X, Wang HH. 2010. Tetracycline resistance associated with commensal bacteria from representative ready-to-consume deli and restaurant foods. J. Food Prot. 73:1841–1848 [DOI] [PubMed] [Google Scholar]
- 30. Osterblad M, Norrdahl K, Korpimaki E, Huovinen P. 2001. Antibiotic resistance. How wild are wild mammals? Nature 409:37–38 [DOI] [PubMed] [Google Scholar]
- 31. Ready D, Bedi R, Spratt DA, Mullany P, Wilson M. 2003. Prevalence, proportions, and identities of antibiotic-resistant bacteria in the oral microflora of healthy children. Microb. Drug Resist. 9:367–372 [DOI] [PubMed] [Google Scholar]
- 32. Salyers AA, Gupta A, Wang Y. 2004. Human intestinal bacteria as reservoirs for antibiotic resistance genes. Trends Microbiol. 12:412–416 [DOI] [PubMed] [Google Scholar]
- 33. Chee-Sanford JC, Aminov RI, Krapac IJ, Garrigues-Jeanjean N, Mackie RI. 2001. Occurrence and diversity of tetracycline resistance genes in lagoons and groundwater underlying two swine production facilities. Appl. Environ. Microbiol. 67:1494–1502 [DOI] [PMC free article] [PubMed] [Google Scholar]
- 34. Lachmayr KL, Kerkhof LJ, Dirienzo AG, Cavanaugh CM, Ford TE. 2009. Quantifying nonspecific TEM beta-lactamase (blaTEM) genes in a wastewater stream. Appl. Environ. Microbiol. 75:203–211 [DOI] [PMC free article] [PubMed] [Google Scholar]
- 35. Smith MS, Yang RK, Knapp CW, Niu Y, Peak N, Hanfelt MM, Galland JC, Graham DW. 2004. Quantification of tetracycline resistance genes in feedlot lagoons by real-time PCR. Appl. Environ. Microbiol. 70:7372–7377 [DOI] [PMC free article] [PubMed] [Google Scholar]
- 36. Luo N, Pereira S, Sahin O, Lin J, Huang S, Michel L, Zhang Q. 2005. Enhanced in vivo fitness of fluoroquinolone-resistant Campylobacter jejuni in the absence of antibiotic selection pressure. Proc. Natl. Acad. Sci. U. S. A. 102:541–546 [DOI] [PMC free article] [PubMed] [Google Scholar]
- 37. Eickhoff T, Kislak J, Finland M. 1965. Sodium ampicillin: absorption and excretion of intramuscular and intravenous doses in normal young men. Am. J. Med. Sci. 249:163–171 [PubMed] [Google Scholar]
- 38. Fabre J, Milek E, Kalfopoulos P, Merier G. 1971. Kinetics of tetracyclines in human. II. Excretion, penetration into normal and inflamed tissues, behavior in a case of renal insufficiency and in hemodialysis. Schweiz. Med. Wochenschr. 101:625–633 [PubMed] [Google Scholar]
Associated Data
This section collects any data citations, data availability statements, or supplementary materials included in this article.