

Abstract
Saccharomyces cerevisiae and Candida albicans are model yeasts for biotechnology and human health, respectively. We used atomic force microscopy (AFM) to explore the effects of caspofungin, an antifungal drug used in hospitals, on these two species. Our nanoscale investigation revealed similar, but also different, behaviors of the two yeasts in response to treatment with the drug. While administration of caspofungin induced deep cell wall remodeling in both yeast species, as evidenced by a dramatic increase in chitin and decrease in β-glucan content, changes in cell wall composition were more pronounced with C. albicans cells. Notably, the increase of chitin was proportional to the increase in the caspofungin dose. In addition, the Young modulus of the cell was three times lower for C. albicans cells than for S. cerevisiae cells and increased proportionally with the increase of chitin, suggesting differences in the molecular organization of the cell wall between the two yeast species. Also, at a low dose of caspofungin (i.e., 0.5× MIC), the cell surface of C. albicans exhibited a morphology that was reminiscent of cells expressing adhesion proteins. Interestingly, this morphology was lost at high doses of the drug (i.e., 4× MIC). However, the treatment of S. cerevisiae cells with high doses of caspofungin resulted in impairment of cytokinesis. Altogether, the use of AFM for investigating the effects of antifungal drugs is relevant in nanomedicine, as it should help in understanding their mechanisms of action on fungal cells, as well as unraveling unexpected effects on cell division and fungal adhesion.
INTRODUCTION
The yeast cell wall is composed of 50 to 60% β-glucans (glucose residues attached by 1,3-β- and 1,6-β-linkages), 40 to 50% mannoproteins (highly glycosylated polypeptides), and 1 to 3% chitin (1, 2). It is an essential dynamic structure playing roles in maintaining cell shape and integrity, sensing the surrounding environment, and interacting with surfaces and other cells (3). The cell wall represents 15 to 25% of the cell dry mass, the chemical composition of which is well established. Saccharomyces cerevisiae, also called baker's yeast, is the best-characterized eukaryotic model for scientific and biomedical research. Although the chemical composition of the yeast cell wall is well known, its molecular ultrastructure (organization or assembly) has not been extensively studied at nanoscale (4, 5), although there are a few reports on the nanomechanical and adhesive properties of the yeast cell wall under native conditions or under stress conditions (6–8). As for Candida albicans, it is by far the most common human-pathogenic fungal species. It can cause a range of pathogenic effects, including painful superficial infections, severe surface infections, and life-threatening bloodstream infections (9). It is a major cause of morbidity and mortality in immunocompromised patients as a result of AIDS, cancer chemotherapy, or organ transplantation (10).
Given its medical relevance, C. albicans has been the subject of extensive research to find new antifungal drugs to fight it. To date, only three classes of antifungal drugs are available for systemic C. albicans infections: the polyenes (such as amphotericin B), the azoles (ketoconazole, itraconazole, fluconazole, and voriconazole), and flucytosine. Although many of these drugs have advanced the management of fungal infections, failure rates remain high (11), and the emergence of resistant fungal strains is a growing problem (12). In this context, a new class of antifungal drugs, the echinocandins, was very welcome in the biomedical domain (13). There are currently three drugs belonging to the class that are available for clinical use: caspofungin, micafungin, and anidulafungin. The echinocandins are large polypeptide molecules that inhibit β-1,3-glucan synthase, an enzyme involved in cell wall synthesis. The disruption of this polysaccharide results in the loss of cell wall integrity. The activity of echinocandins is generally opposite to that of the azoles in that they are fungicidal against yeasts and fungistatic against molds (13). As echinocandins have been used only recently in the clinic, the mechanism of resistance to the drugs is still poorly documented, although a few cases of resistant isolates from patients treated with the antifungal implicating mutations in the FKS1 gene encoding β1,3-glucan synthase (14–17) have been reported.
Whereas the target of echinocandins (i.e., β-1,3-glucan synthase) is well characterized, the global effects of this antifungal drug class on the cell wall of yeasts at nanoscale have not been studied. Such a study is now becoming feasible with the recent advances in atomic force microscopy (AFM) under liquid conditions. Since its invention in 1986 (18), AFM has proven to be a powerful tool in biology (19) for evaluating the effects of antimicrobial drugs against live bacteria or fungi (20, 21). In this study, we used AFM under liquid conditions to investigate nanomechanical effects caused by caspofungin on S. cerevisiae and C. albicans. Furthermore, we used biochemical methods to determine the cell wall composition in order to evaluate a potential correlation between these biophysical properties and cell wall modifications in response to caspofungin for the two yeast species.
MATERIALS AND METHODS
Yeast growth conditions.
S. cerevisiae strain BY4741 (MATa his3Δ1 leu2Δ10 met15Δ0 ura3Δ0) (22) and C. albicans (from ABC Platform Bugs Bank, Nancy, France) were stocked at −80°C, revivified on yeast extract-peptone-dextrose (YPD) agar (Difco; 242720-500g), and grown in yeast extract-peptone-dextrose broth (Difco; 242820-500g) for 20 h at 30°C under static conditions. For caspofungin treatment, caspofungin was added for 20 h before the experiments. Before AFM experiments were conducted, the yeasts were grown in yeast extract-peptone-dextrose broth containing caspofungin at a concentration of 0.063 μg/ml (0.5× MIC) and 0.5 μg/ml (4× MIC) for S. cerevisiae and 0.047 μg/ml (0.5× MIC) and 0.37 μg/ml (4× MIC) for C. albicans.
MIC determination for caspofungin.
The MIC values for caspofungin were determined using commercially available Etest strips containing a gradient of caspofungin (bioMérieux; 532400). For the diffusion test, a yeast solution (optical density at 590 nm [OD590] = 0.150) was applied to the yeast extract-peptone-dextrose agar plates. The plates were allowed to dry for 15 min before the Etest stripes were applied in a radial fashion onto the agar surface. The MIC was determined after 24 h at 30°C by the intersection of the lower part of the elliptical growth inhibition area with the Etest strip.
We chose to use Etest from bioMérieux, as it gave repeatable results compared to the EUCAST (23) or CLSI (24) method. It must be noted that EUCAST does not publish clinical breakpoints for caspofungin for C. albicans “due to significant interlaboratory variation in MIC ranges for caspofungin.”
We used yeast extract-peptone-dextrose agar (Difco; 242720-500g) and incubation at 30°C in order to determine the caspofungin MIC for the conditions under which we performed the AFM and biochemical experiments of the study. However, we also performed the Etest at 35°C for 24 h, and we found the same results for both S. cerevisiae and C. albicans as with incubation at 30°C. The common applications for the caspofungin Etest would be to use agar containing RPMI 1640, glucose, and MOPS (morpholinepropanesulfonic acid). However, under these conditions in liquid, the cells of C. albicans behave differently, since they form hyphae. In our study, we focused on cells with a spherical shape, the one that C. albicans assumes in bloodstream infections. This is why we performed all the experiments in YPD, and thus, we made the choice to determine the MICs in YPD also.
Sample preparation for AFM experiments.
Yeast cells were concentrated by centrifugation, washed two times in acetate buffer (18 mM CH3COONa, 1 mM CaCl2, 1 mM MnCl2, pH 5.2), resuspended in acetate buffer, and immobilized on polydimethylsiloxane (PDMS) stamps prepared as described by Dague et al. (25). Briefly, freshly oxygen-activated microstructured PDMS stamps were covered with a total of 100 μl of the solution of cells and allowed to stand for 15 min at room temperature. The cells were then deposited into the microstructures of the stamp by convective/capillary assembly. For S. cerevisiae cells treated with caspofungin at 4.0× MIC, polyethylenimine (PEI)-coated glass slides were used to immobilize the cells, as described previously (26). Briefly, freshly oxygen-activated glass slides were covered with a 0.2% PEI solution in deionized water and left for incubation overnight. Then, the glass slides were rinsed with 20 ml of Milli-Q water and nitrogen dried. A total of 1 ml of the yeast suspension was then applied to the PEI-coated glass slide, allowed to stand for 1 h, and rinsed with acetate buffer. Images were recorded in acetate buffer in quantitative-imaging mode (27, 28) with MLCT AUWH cantilevers (nominal spring constants, 0.01, 0.1, and 0.5 N/m). For imaging, cantilevers with a spring constant of 0.01 N/m were used. For force spectroscopy experiments, cantilevers with spring constants of 0.1 and 0.5 N/m were used. The applied force was kept at 0.5 nN for both imaging and force spectroscopy. For imaging and force spectroscopy, we used an AFM Nanowizard III (JPK Instruments, Berlin, Germany). The cantilevers' spring constants were determined by the thermal-noise method (29). For elasticity measurements, force maps of 32-by-32 force curves were recorded on a small area on top of the cells. The force-distance curves recorded were transformed into force-indentation curves by subtracting the cantilever deflection on a solid surface. The indentation curves were then fitted to the Hertz model, which links force (F) as a function of the Young modulus (E) and the square of the indentation (δ) for a conical indenter according to the following equation: F = [2E tanα/π(1 − ν2)]δ2, where α is the tip opening angle (17.5°) and ν is the Poisson ratio, assumed to be 0.5.
Isolation of cell walls for acid hydrolysis and chitinase assays.
Cells from three independent cultures were collected at the exponential phase, harvested by centrifugation (5 min; 4,500 × g; 4°C), and washed two times with sterilized water. The pellet was resuspended in 0.5 ml of cold water and transferred to lysing matrix tubes (MPBio; 6960-500) containing 0.5-mm glass beads. The cells were disrupted by 8 cycles of 20 s at 6.5 m/s using a Fastprep system (Mp Biomedicals). Cell walls were isolated by centrifugation and extensive washing, as described by Francois (2), and then lyophilized.
Determination of cell wall polysaccharides by acid hydrolysis and quantification by HPAEC-pulsed amperometric detection.
Sulfuric acid hydrolysis of the cell wall and quantification of glucosamine, glucose, and mannose residues released after chitin, β-glucan, and mannan hydrolysis were determined as described by Dallies et al. (30) with modifications according to the method of Francois (2). High-performance anionic chromatography (HPAEC) was carried out on an ICS 5000 system (Thermofisher Scientific, Courtaboeuf, France). Separation and quantification of the released monosaccharides were performed on a CarboPac PA10 analytical column (250 by 4 mm), with a CarboPac PA10 guard column, by isocratic elution of 18 mM NaOH at 25°C and a flow rate of 1 ml/min. Detection was performed on a pulsed amperometric system equipped with a gold electrode.
Chitin determination.
A solution of 200 μl of 50 mM potassium acetate, pH 5.0, was added to purify cell walls (10 mg dry mass). After incubation at 65°C for 5 min, 1 U of chitinase from Streptomyces griseus (Sigma-Aldrich; C6137) was added. The enzymatic mixture was then incubated for 16 h at 37°C. Chitin levels from yeast cell walls were determined by the colorimetric method, as described by Reissig et al. (31) and adapted for the micromethod (a method performed in a microtiter plate, i.e., 96-well plate), using N-acetylglucosamine (Sigma-Aldrich; A8625) as a standard. A volume of 125 μl of the enzymatic mixture was heated with 25 μl of 0.8 M potassium tetraborate, pH 9.0 (Sigma-Aldrich; P1463), at 100°C for 8 min. After cooling at room temperature, 750 μl of Reissig reagent diluted 10 times was added, and tubes were incubated for 40 min at 37°C. The absorbance was read at 585 nm.
RESULTS
Caspofungin affects the morphology and cell division of S. cerevisiae.
Our innovative method of cell trapping and immobilization in microstructured PDMS stamps (25) allowed us to image yeast cells and obtain morphological and mechanical properties at nanoscale (Fig. 1a and b). For each condition, five cells from three independent cultures were analyzed. The MIC determined with the Etest was 0.125 μg · ml−1. As shown in Fig. 1c, native cells of S. cerevisiae are roughly ovoid, with a mean diameter of 4.5 ± 0.2 μm (Fig. 1e). Upon treatment for 16 h with caspofungin at 0.5× MIC, the cells keep their round shape (Fig. 1b and d), and their mean size is decreased by about 25% ± 2.5% (Fig. 1f). A small dose of caspofungin, therefore, reduces the size of cells, apparently without any other modifications. When yeast cells were treated for 16 h with a high dose of caspofungin (4× MIC), the S. cerevisiae cells were no longer spherical but elongated, resembling Schizosaccharomyces pombe cells. The cross section taken along the line in Fig. 2b indicated a length of about 2.3 μm (Fig. 2f), which is 50% shorter than the untreated cells. However, two cells that remained connected are distinctly seen in Fig. 2d; they present a surprising feature on their surfaces, at the center of each one. When we took a closer look at this feature (Fig. 2e and g), we could visualize two rings that were 15 nm high and that were separated by a groove of approximately 200 nm. These results suggest that the morphology and cell division process of S. cerevisiae are altered at high doses of caspofungin. How can we explain such an effect?
Fig 1.

Images of S. cerevisiae cells (strain BY4147) trapped in microstructured PDMS stamps. (a and b) Optical images of live native cells (a) and of cells treated with caspofungin at 0.5× MIC (0.063 μg/ml) (b). (c and d) AFM height images of a native cell (c) and of a cell treated with caspofungin at 0.5× MIC (0.063 μg/ml) (d). (e and f) Cross sections taken along the lines on the height images.
Fig 2.

Images of S. cerevisiae (strain BY4741) cells treated with caspofungin at 4× MIC (0.5 μg/ml). (a) Optical image of living cells immobilized on a PEI-coated glass slide. (b) AFM height image (z range = 1.2 μm) of two cells. (c) Vertical-deflection image corresponding to the height image in panel b. (d) AFM height image of a single cell (z range = 1.2 μm). (e) Height image of the boxed area in panel d (z range = 20 nm). (f and g) Cross-sections taken along the lines in panels b (f) and e (g).
It is known that caspofungin is an inhibitor of β-1,3-glucan synthase (13). Thus, cells treated with this antifungal drug should present a reduced percentage of the cell wall polysaccharide. Accordingly, we found a reduction in the β-glucan content, from 54% of cell dry mass in untreated S. cerevisiae cells to 49 and 45% in cells treated with caspofungin concentrations of 0.5× and 4× MIC, respectively (Table 1). The reduction of glucans was compensated for by an increase of mannans, from 45% of dry mass in untreated cells to 50 and 53% in cells treated at 0.5× and 4× MIC, respectively (Table 1). This cell wall remodeling in response to caspofungin treatment was also accompanied by changes in chitin. However, only at high doses of caspofungin (4× MIC) was an increase in chitin content found, from 5% in untreated cells or cells treated with 0.5× MIC of caspofungin to 14% of cell wall mass with a caspofungin dose of 4× MIC (Table 1). These results are in agreement with previous works of Juchimiuk et al. (32), who showed that S. cerevisiae cells treated with 3.0 μg/ml caspofungin had their contents of β-1,3-glucans reduced by 50% and their chitin contents increased by 3- to 5-fold. These data are in agreement with the general view that the response of S. cerevisiae cells to cell wall stress results in a deep reorganization of the cell wall as a means to rescue cell wall integrity (33) and, in the case of antifungal stress, in the overproduction of mannans and reduction of β-glucans.
Table 1.
Biochemical analysis of glucans and mannans of the cell wall of yeasts by acid hydrolysis and of chitin by the Reissig methoda
| Component | Content (% dry mass ± SD) in cells treated with caspofungin at: |
|||||
|---|---|---|---|---|---|---|
|
S. cerevisiae |
C. albicans |
|||||
| 0× MIC | 0.5× MIC | 4× MIC | 0× MIC | 0.5× MIC | 4× MIC | |
| Glucans | 54.1 ± 4.9 | 48.5 ± 6.5 | 45.0 ± 7.6 | 52.0 ± 3.2 | 48.5 ± 5.5 | 30.9 ± 8.6 |
| Mannans | 45.3 ± 2.9 | 50.4 ± 6.2 | 53.7 ± 7.1 | 46.5 ± 3.3 | 44.2 ± 3.0 | 59.3 ± 7.5 |
| Chitin | 4.8 ± 0.2 | 5.1 ± 0.8 | 13.8 ± 5.2 | 6.6 ± 2.6 | 12.8 ± 4.1 | 17.9 ± 5.3 |
For each species and set of conditions, cells from 3 independent cultures were analyzed.
Nanomechanical properties of S. cerevisiae.
In view of the role of the cell wall in conferring rigidity and protection on the yeast cell, we next addressed the pertinent question of whether the observed changes in cell morphology and chitin content were correlated with modifications in cell wall mechanical properties. To this end, S. cerevisiae cells exposed to two different concentrations of caspofungin were probed using nanoindentation measurements. The results of this experiment are shown in Fig. 3. The images of the cells recorded in quantitative-imaging mode (27, 28) allow analysis of all the force curves recorded in a single image (n = 65,536). By applying a mask, thanks to the analysis software (OpenFovea [34, 35]), only the force curves corresponding to the cells are extracted, leading to the elasticity maps presented in Fig. 3a, b, and c. In all the elasticity maps presented in this study, each pixel corresponds to a force curve that has been converted into an indentation curve and fitted with a Hertz model, from which a Young modulus (YM) value was extracted. The redder the pixel, the higher the YM value. These elasticity maps showed artifacts due to the spherical shape of the cells; the edges of the cells seem to have decreased YM values compared to the centers of the cells. However, these elasticity maps give a global view of the elasticity of the whole cells, with untreated cells that appear to be softer than caspofungin-treated cells. These observations were confirmed by local nanoindentation measurements performed on a 1-μm2 area on the surface of each cell (Fig. 3d, e, and f). These areas on the tops of the cells are flatter, so the YM artifacts are avoided. Untreated cells had a YM value of 529 ± 265 kPa (Fig. 3g), whereas cells treated with caspofungin at 0.5× MIC and 4× MIC (Fig. 3h and i) had YM values that increased to 1,264 ± 567 and to 1,125 ± 468 kPa, respectively.
Fig 3.

Mapping of S. cerevisiae (strain BY4741) cell surface elasticity. (a to c) Elasticity maps (z range = 1.5 MPa) of a native cell (a), of a cell treated with caspofungin at 0.5× MIC (0.063 μg/ml) (b), and of a cell treated with caspofungin at 4× MIC (0.5 μg/ml) (c). (d, e, and f) Local elasticity maps (z range = 1.5 MPa) recorded on a 1-μm area (white dashed squares) on the tops of cells in panels a to c, respectively. (g, h, and i) Distributions of Young modulus values (n = 1,024) corresponding to the local elasticity maps in panels d to f, respectively.
Effects of caspofungin treatment on C. albicans.
Using the Etest assay, we determined a MIC of about 0.094 μg · ml−1. The doses that were used in this study (0.5× MIC and 4× MIC) were therefore lower than the one reported to induce paradoxical growth effects (36). Caspofungin treatment does not cause morphology modification in C. albicans; the cells are spherical, with a mean diameter of 4.1 ± 0.2 μm, as shown in Fig. 4a, b, and c. However, caspofungin treatment induced other modifications of the surfaces of C. albicans cells. The results presented in Fig. 4g, h, and i are adhesion images of the cells. Native cells are not adhesive, whereas cells treated with caspofungin at 0.5× MIC present adhesions homogeneously distributed over the surface of the cell, as indicated in the adhesion map presented Fig. 4h. However, cells treated with caspofungin at 4× MIC do not show adhesion at all, like native cells.
Fig 4.

Imaging of C. albicans cells trapped in microstructured PDMS stamps. (a to c) AFM height images of a native cell (a), of a cell treated with caspofungin at 0.5× MIC (0.047 μg/ml) (b), and of a cell treated with caspofungin at 4× MIC (0.376 μg/ml) (c). (d, e, and f) Cross sections taken along the lines on the images in panels a to c, respectively. (g, h, and i) adhesion images corresponding to the height images in panels a to c, respectively.
Probing the cell surface of C. albicans using nanoindentation measurements (Fig. 5), we unexpectedly found a YM value for the untreated C. albicans cells of 186 ± 89 kPa, which is three times lower than that of S. cerevisiae cells. Taking into account that the proportions of mannans, β-glucans, and chitin in the cell wall are very similar for the two yeast species (1, 37), a likely explanation for the difference in YM values may reside in a difference in the molecular architectures of the cell wall between the two yeast species, notably in cross-linking between the components. Treatment of C. albicans cells with caspofungin at 0.5× MIC or 4× MIC for 16 h resulted in an increase of the YM value to 399 ± 147 kPa and 1,326 ± 340 kPa, respectively (Fig. 5h and i). Quite remarkably, this increase in YM values was correlated with the increase in the chitin level in C. albicans cells upon treatment with caspofungin (Fig. 6b and Table 1). In addition, the rise of chitin in the walls of C. albicans cells treated with caspofungin was accompanied by a decrease in β-glucans and an increase of mannans, as already noticed for S. cerevisiae cells, but the effects of caspofungin were apparently more prominent. Notably, untreated cells displayed a β-glucan content of 52% of the cell wall mass. This proportion was reduced to 49% upon treatment with 0.5× MIC and to 31% when the cells were treated with 4× MIC of caspofungin. As for mannans, the proportion in untreated cells was close to 46% and increased to 59% when the cells were cultivated in the presence of a dose of 4× MIC of caspofungin.
Fig 5.

Mapping of C. albicans cell surface elasticity. (a to c) Elasticity maps (z range = 0.5 MPa) of a native cell (a), of a cell treated with caspofungin at 0.5× MIC (0.047 μg/ml) (b), and of a cell treated with caspofungin at 4× MIC (0.376 μg/ml) (c). (d, e, and f) Local elasticity maps (z range = 0.5 MPa) recorded on a 1-μm area (white dashed squares) on the tops of the cells in panels a to c, respectively. (g, h, and i) Distributions of Young modulus values (n = 1,024) corresponding to the local elasticity maps in panels d to f, respectively.
Fig 6.
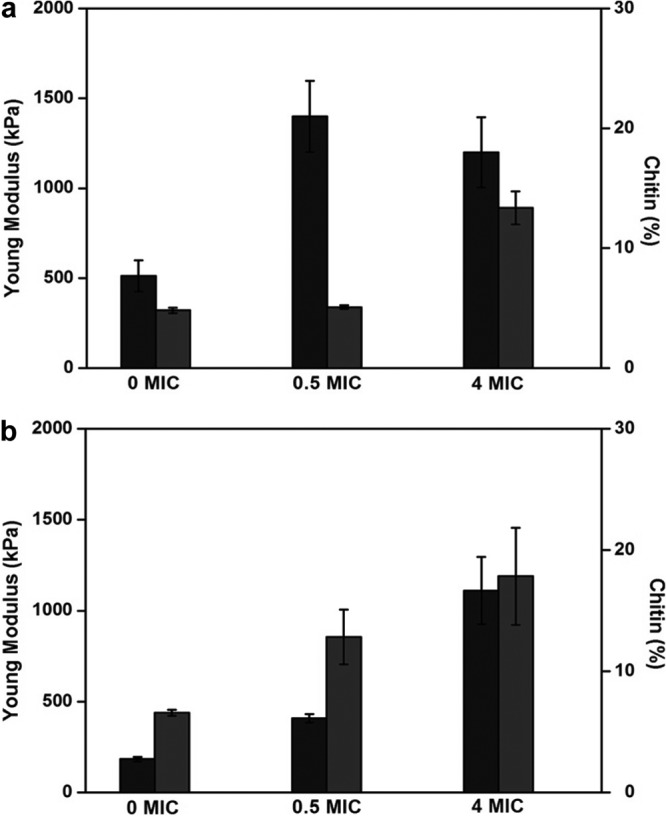
Quantitative analysis of chitin compositions of the yeast cell wall, correlated with Young modulus values. The histograms show Young modulus values (black bars) and chitin (gray bars) for S. cerevisiae (strain BY4741) (a) and for C. albicans (b) under different caspofungin conditions. The analyses for Young modulus values were performed on five cells from 3 independent cultures.
DISCUSSION
We used AFM to investigate the effects of caspofungin on the morphology and nanomechanical properties of two yeast species, S. cerevisiae and C. albicans. With respect to S. cerevisiae, our results indicated that caspofungin at high doses alters the cell division process by perturbing cytokinesis. These modifications were observed along with a diminution of the β-1,3-glucan content and an increase in the chitin content. Studies by Cabib and coworkers have shown the importance of chitin and β-1,3-glucans during the cell division of yeasts (38–40). Their work focused on the remodeling of the cell wall during cell division, and particularly on the neck at the mother-bud interface. This crucial region is the site where cytokinesis and septation take place (41). Cabib et al. showed that control of growth at the neck is exerted by a septin ring and a chitin ring present at the location. A defect in either one of the rings leads to only minor morphological abnormalities. However, when both are faulty, control of growth is lost, the neck widens, and cytokinesis does not take place (38). They also showed that the chitin ring at the neck is specifically bound to β-1,3-glucans (42) and that this linkage is necessary for the control of growth at the mother-daughter neck. As indicated in Fig. 2, the apparent impairment in cytokinesis in yeast treated with a high dose of caspofungin might be due to excess chitin that is present at the bud neck and that is not linked to β-1,3-glucans, as the content of the latter is reduced.
While the increase in the YM value of the cell wall of S. cerevisiae could be correlated with the increase in chitin induced at a high dose of caspofungin, this was not the case for a lower dose of caspofungin, for which the YM value was already the same as at the higher dose of the antifungal drug. These results suggest that the force measurements performed with atomic force microscopy are not solely linked to changes in the cell wall composition but may unravel deep reorganization of the cell wall architecture without significant change in its cell wall components (43). A recent study conducted by our team (43) focused on S. cerevisiae mutants defective in, among other things, β-glucan elongation (gas1Δ), chitin synthesis (chs3Δ), and cross-linkages between chitin and β-glucans (chr1chr2Δ). This AFM study showed that cell wall elasticity was mainly dependent on the architecture and molecular composition of the cell wall. Moreover, chitin was identified as playing an important role in the nanomechanical properties of the cell wall. Our results are therefore in line with this previous study, and the amount of chitin in the cell wall could be directly correlated with the increase in the YM values. The difference in the nanomechanical properties of the two yeast species suggests a difference in the molecular architectures of their cell walls, even though the cell wall compositions were seemingly comparable.
With respect to C. albicans cells, global morphology and cell division do not appear to be affected, even at high doses of caspofungin. The modifications induced by the treatment concern the adhesive properties of the cells. As we saw, cells treated with a low dose of caspofungin present adhesions on their surfaces. C. albicans cells display adhesion proteins on their surfaces when cultivated under particular conditions (44). A key adhesin family identified is the Als (for agglutinin-like sequence) family (45, 46), which includes eight large cell surface glycoproteins. Als proteins play major roles in the processes of infection and colonization of the host. Since their discovery, many studies have been dedicated to understanding their functions and localization on the surfaces of cells. A recent study by Alsteens et al. (47) has characterized the localization of Als5 at the surface of mutant strains of S. cerevisiae using atomic force microcopy; in 2012, Beaussart et al. (48) characterized the localization of Als3 on the surfaces of C. albicans cells during morphogenesis. Their work provides confirmation that Als proteins can be mapped at the surfaces of living cells. Among these proteins is Als1p, which is involved in different processes, such as adherence to endothelial cells, flocculation, and filamentation (49). Gregori et al. (50) showed that Als1 is a critical factor required for caspofungin-induced flocculation. The authors show that cells treated by caspofungin present levels of ALS1 mRNA that are strongly upregulated. Following these sets of data, we could hypothesize that the adhesion shown in Fig. 3h is due to expression of Als1. However, at high doses, the expression of the gene could be inhibited, leading us to think that the expression of Als1 under antifungal stress is a complex dynamic process that needs further study. Perhaps, at high doses of caspofungin, either the cells are dying or the transcriptional and translational machinery at this level of drug is strongly impaired, so that synthesis of new components at the cell wall, such as adhesion proteins, is inhibited. This hypothesis awaits further work, for instance, by measuring the expression of genes encoding some of these adhesion proteins in C. albicans cells challenged at different concentrations of caspofungin. These results were recorded on living cells of wild-type C. albicans, which gives us an insight into the physiological localization of the protein. Further work must be done to probe these adhesions with functionalized AFM tips under different conditions of growth and stress.
ACKNOWLEDGMENTS
E.D. is a researcher of the Centre National de la Recherche Scientifique (CNRS). This work was supported by a grant from the Young Scientist Program of ANR (Agence Nationale de la Recherche), project ANR-11-JSV5-001-01, no. (SD) 30 02 43 31, and by a grant from Region Midi Pyrenees (project no. 10051296) to J.M.F. C.F. is supported by a grant from Direction Générale de l'Armement (DGA) for her 3-year Ph.D. study and M.S. by Lallemand SAS.
We thank Charles Roduit for providing us with updated Fovea software. We thank Merck for providing caspofungin and Claire Murzeau for her help in the experiments.
C.F., R.E.D., J.M.F, and E.D. designed the experiments. C.F., M.S., H.M.-Y., and E.D. performed the experiments. C.F. and E.D. wrote the paper. Critical analysis and discussion of the results were carried out by all the authors, who also helped in critical reading of the manuscript and approved its final version.
Footnotes
Published ahead of print 13 May 2013
REFERENCES
- 1. Lipke PN, Ovalle R. 1998. Cell wall architecture in yeast: new structure and new challenges. J. Bacteriol. 180:3735–3740 [DOI] [PMC free article] [PubMed] [Google Scholar]
- 2. Francois JM. 2006. A simple method for quantitative determination of polysaccharides in fungal cell walls. Nat. Protoc. 1:2995–3000 [DOI] [PubMed] [Google Scholar]
- 3. Chaffin WL. 2008. Candida albicans cell wall proteins. Microbiol. Mol. Biol. Rev. 72:495–544 [DOI] [PMC free article] [PubMed] [Google Scholar]
- 4. Dague E, Gilbert Y, Verbelen C, Andre G, Alsteens D, Dufrêne YF. 2007. Towards a nanoscale view of fungal surfaces. Yeast 24:229–237 [DOI] [PubMed] [Google Scholar]
- 5. Dufrêne YF. 2010. Atomic force microscopy of fungal cell walls: an update. Yeast 27:465–471 [DOI] [PubMed] [Google Scholar]
- 6. Alsteens D, Dupres V, McEvoy K, Wildling L, Gruber HJ, Dufrene YF. 2008. Structure, cell wall elasticity and polysaccharide properties of living yeasts cells, as probed by AFM. Nanotechnology 19:384005. 10.1088/0957-4484/19/38/384005 [DOI] [PubMed] [Google Scholar]
- 7. Adya AK, Canetta E, Walker GM. 2006. Atomic force microscopic study of the influence of physical stresses on Saccharomyces cerevisiae and Schizosaccharomyces pombe. FEMS Yeast Res. 6:120–128 [DOI] [PubMed] [Google Scholar]
- 8. Canetta E, Adya AK, Walker GM. 2006. Atomic force microscopic study of the effects of ethanol on yeast cell surface morphology. FEMS Microbiol. Lett. 255:308–315 [DOI] [PubMed] [Google Scholar]
- 9. Sudbery P, Gow N, Berman J. 2004. The distinct morphogenic states of Candida albicans. Trends Microbiol. 12:317–324 [DOI] [PubMed] [Google Scholar]
- 10. Gow NA, Hube B. 2012. Importance of the Candida albicans cell wall during commensalism and infection. Curr. Opin. Microbiol. 15:406–412 [DOI] [PubMed] [Google Scholar]
- 11. Denning DW. 1998. Invasive aspergillosis. Clin. Infect. Dis. 26:781–803 [DOI] [PubMed] [Google Scholar]
- 12. Sanglard D, Odds FC. 2002. Resistance of Candida species to antifungal agents: molecular mechanisms and clinical consequences. Lancet Infect. Dis. 2:73–85 [DOI] [PubMed] [Google Scholar]
- 13. Denning DW. 2003. Echinocandin antifungal drugs. Lancet 362:1142–1151 [DOI] [PubMed] [Google Scholar]
- 14. Park S, Kelly R, Kahn JN, Robles J, Hsu M-J, Register E, Li W, Vyas V, Fan H, Abruzzo G, Flattery A, Gill C, Chrebet G, Parent SA, Kurtz M, Teppler H, Douglas CM, Perlin DS. 2005. Specific substitutions in the echinocandin target Fks1p account for reduced susceptibility of rare laboratory and clinical Candida sp. isolates. Antimicrob. Agents Chemother. 49:3264–3273 [DOI] [PMC free article] [PubMed] [Google Scholar]
- 15. Balashov SV, Park S, Perlin DS. 2006. Assessing resistance to the echinocandin antifungal drug caspofungin in Candida albicans by profiling mutations in FKS1. Antimicrob. Agents Chemother. 50:2058–2063 [DOI] [PMC free article] [PubMed] [Google Scholar]
- 16. Garcia-Effron G, Park S, Perlin DS. 2009. Correlating echinocandin MIC and kinetic inhibition of fks1 mutant glucan synthases for Candida albicans: implications for interpretive breakpoints. Antimicrob. Agents Chemother. 53:112–122 [DOI] [PMC free article] [PubMed] [Google Scholar]
- 17. Garcia-Effron G, Lee S, Park S, Cleary JD, Perlin DS. 2009. Effect of Candida glabrata FKS1 and FKS2 mutations on echinocandin sensitivity and kinetics of 1,3-β-d-glucan synthase: implication for the existing susceptibility breakpoint. Antimicrob. Agents Chemother. 53:3690–3699 [DOI] [PMC free article] [PubMed] [Google Scholar]
- 18. Binnig G, Quate CF, Gerber C. 1986. Atomic force microscope. Phys. Rev. Lett. 56:930–934 [DOI] [PubMed] [Google Scholar]
- 19. Müller DJ, Dufrêne YF. 2011. Atomic force microscopy: a nanoscopic window on the cell surface. Trends Cell Biol. 21:461–469 [DOI] [PubMed] [Google Scholar]
- 20. Formosa C, Grare M, Jauvert E, Coutable A, Regnouf-de-Vains JB, Mourer M, Duval RE, Dague E. 2012. Nanoscale analysis of the effects of antibiotics and CX1 on a Pseudomonas aeruginosa multidrug-resistant strain. Sci. Rep. 2:575. [DOI] [PMC free article] [PubMed] [Google Scholar]
- 21. Formosa C, Grare M, Duval RE, Dague E. 2012. Nanoscale effects of antibiotics on P. aeruginosa. Nanomedicine 8:12–16 [DOI] [PubMed] [Google Scholar]
- 22. Baker Brachmann C, Davies A, Cost GJ, Caputo E, Li J, Hieter P, Boeke JD. 1998. Designer deletion strains derived from Saccharomyces cerevisiae S288C: a useful set of strains and plasmids for PCR-mediated gene disruption and other applications. Yeast 14:115–132 [DOI] [PubMed] [Google Scholar]
- 23. EUCAST 18 February 2012. Document E.DEF 7.2. Method for the determination of broth dilution of antifungal agents for fermentative yeasts; revised March 2012. EUCAST, Basel, Switzerland [Google Scholar]
- 24. CLSI 2008. Reference method for broth dilution antifungal susceptibility. Testing of yeasts. Approved standard, 3rd ed CLSI document M27-A3, vol. 28, no. 14 CLSI, Wayne, PA [Google Scholar]
- 25. Dague E, Jauvert E, Laplatine L, Viallet B, Thibault C, Ressier L. 2011. Assembly of live micro-organisms on microstructured PDMS stamps by convective/capillary deposition for AFM bio-experiments. Nanotechnology 22:395102. 10.1088/0957-4484/22/39/395102 [DOI] [PubMed] [Google Scholar]
- 26. Francius G, Tesson B, Dague E, Martin-Jézéquel Dufrêne VYF. 2008. Nanostructure and nanomechanics of live Phaeodactylum tricornutum morphotypes. Environ. Microbiol. 10:1344–1356 [DOI] [PubMed] [Google Scholar]
- 27. JPK Instruments 2011. QITM mode-quantitative imaging with the NanoWizard 3 AFM. http://www.jpk.com/afm.230.en.html
- 28. Chopinet L, Formosa C, Rols MP, Duval RE, Dague E. 2013. Imaging living cells surface and quantifying its properties at high resolution using AFM in QITM mode. Micron 48:26–33 [DOI] [PubMed] [Google Scholar]
- 29. Hutter JL, Bechhoefer J. 1993. Calibration of atomic-force microscope tips. Rev. Sci. Instruments 64:1868–1873 [Google Scholar]
- 30. Dallies N, François J, Paquet V. 1998. A new method for quantitative determination of polysaccharides in the yeast cell wall. Application to the cell wall defective mutants of Saccharomyces cerevisiae. Yeast 14:1297–1306 [DOI] [PubMed] [Google Scholar]
- 31. Reissig JL, Strominger JL, Leloir LF. 1955. A modified colorimetric method for the estimation of N-acetylamino sugars. J. Biol. Chem. 217:959–966 [PubMed] [Google Scholar]
- 32. Juchimiuk M, Pasikowska M, Zatorska E, Laudy AE, Smoleńska-Sym G, Palamarczyk G. 2010. Defect in dolichol-dependent glycosylation increases sensitivity of Saccharomyces cerevisiae towards anti-fungal drugs. Yeast 27:637–645 [DOI] [PubMed] [Google Scholar]
- 33. Ram AFJ, Kapteyn JC, Montijn RC, Caro LHP, Douwes JE, Baginsky W, Mazur P, Van den Ende H, Klis FM. 1998. Loss of the plasma membrane-bound protein Gas1p in Saccharomyces cerevisiae results in the release of β1,3-glucan into the medium and induces a compensation mechanism to ensure cell wall integrity. J. Bacteriol. 180:1418–1424 [DOI] [PMC free article] [PubMed] [Google Scholar]
- 34. Radotić K, Roduit C, Simonović J, Hornitschek P, Fankhauser C, Mutavdžić D, Steinbach G, Dietler G, Kasas S. 2012. Atomic force microscopy stiffness tomography on living Arabidopsis thaliana cells reveals the mechanical properties of surface and deep cell-wall layers during growth. Biophys. J. 103:386–394 [DOI] [PMC free article] [PubMed] [Google Scholar]
- 35. Roduit C, Saha B, Alonso-Sarduy L, Volterra A, Dietler G, Kasas S. 2012. OpenFovea: open-source AFM data processing software. Nat. Methods 9:774–775 [DOI] [PubMed] [Google Scholar]
- 36. Bizerra FC, Melo ASA, Katchburian E, Freymüller E, Straus AH, Takahashi HK, Colombo AL. 2011. Changes in cell wall synthesis and ultrastructure during paradoxical growth effect of caspofungin on four different Candida species. Antimicrob. Agents Chemother. 55:302–310 [DOI] [PMC free article] [PubMed] [Google Scholar]
- 37. Chaffin WL, López-Ribot JL, Casanova M, Gozalbo D, Martínez JP. 1998. Cell wall and secreted proteins of Candida albicans: identification, function, and expression. Microbiol. Mol. Biol. Rev. 62:130–180 [DOI] [PMC free article] [PubMed] [Google Scholar]
- 38. Schmidt M, Varma A, Drgon T, Bowers B, Cabib E. 2003. Septins, under Cla4p regulation, and the chitin ring are required for neck integrity in budding yeast. Mol. Biol. Cell 14:2128–2141 [DOI] [PMC free article] [PubMed] [Google Scholar]
- 39. Cabib E, Blanco N, Arroyo J. 2012. Presence of a large β(1–3)glucan linked to chitin at the Saccharomyces cerevisiae mother-bud neck suggests involvement in localized growth control. Eukaryot. Cell 11:388–400 [DOI] [PMC free article] [PubMed] [Google Scholar]
- 40. Blanco N, Reidy M, Arroyo J, Cabib E. 2012. Cross-links in the cell wall of budding yeast control morphogenesis at the mother-bud neck. J. Cell Sci. 125:5781–5789 [DOI] [PMC free article] [PubMed] [Google Scholar]
- 41. Lippincott J, Li R. 1998. Sequential assembly of myosin II, an IQGAP-like protein, and filamentous actin to a ring structure involved in budding yeast cytokinesis. J. Cell Biol. 140:355–366 [DOI] [PMC free article] [PubMed] [Google Scholar]
- 42. Cabib E, Durán A. 2005. Synthase III-dependent chitin is bound to different acceptors depending on location on the cell wall of budding yeast. J. Biol. Chem. 280:9170–9179 [DOI] [PubMed] [Google Scholar]
- 43. Dague E, Bitar R, Ranchon H, Durand F, Yken HM, François JM. 2010. An atomic force microscopy analysis of yeast mutants defective in cell wall architecture. Yeast 27:673–684 [DOI] [PubMed] [Google Scholar]
- 44. Sundstrom P. 2002. Adhesion in Candida spp. Cell. Microbiol. 4:461–469 [DOI] [PubMed] [Google Scholar]
- 45. Hoyer LL, Green CB, Oh S-H, Zhao X. 2008. Discovering the secrets of the Candida albicans agglutinin-like sequence (ALS) gene family—a sticky pursuit. Med. Mycol. 46:1–15 [DOI] [PMC free article] [PubMed] [Google Scholar]
- 46. Hoyer LL. 2001. The ALS gene family of Candida albicans. Trends Microbiol. 9:176–180 [DOI] [PubMed] [Google Scholar]
- 47. Alsteens D, Garcia MC, Lipke PN, Dufrêne YF. 2010. Force-induced formation and propagation of adhesion nanodomains in living fungal cells. Proc. Natl. Acad. Sci. U. S. A. 107:20744–20749 [DOI] [PMC free article] [PubMed] [Google Scholar]
- 48. Beaussart A, Alsteens D, El-Kirat-Chatel S, Lipke PN, Kucharíková S, Van Dijck P, Dufrêne YF. 2012. Single-molecule imaging and functional analysis of Als adhesins and mannans during Candida albicans morphogenesis. ACS Nano. 6:10950–10964 [DOI] [PMC free article] [PubMed] [Google Scholar]
- 49. Coleman DA, Oh S-H, Zhao X, Hoyer LL. 2010. Heterogeneous distribution of Candida albicans cell-surface antigens demonstrated with an Als1-specific monoclonal antibody. Microbiology 156:3645–3659 [DOI] [PMC free article] [PubMed] [Google Scholar]
- 50. Gregori C, Glaser W, Frohner IE, Reinoso-Martín C, Rupp S, Schüller C, Kuchler K. 2011. Efg1 controls caspofungin-induced cell aggregation of Candida albicans through the adhesin Als1. Eukaryot. Cell 10:1694–1704 [DOI] [PMC free article] [PubMed] [Google Scholar]