

Abstract
Hepatitis C virus (HCV) infection is believed to begin with interactions between cell-free HCV and cell receptors that include CD81, scavenger receptor B1 (SR-B1), claudin-1 (CLDN1), and occludin (OCLN). In this study, we have demonstrated that HCV spreading from infected hepatocytes to uninfected hepatocytes leads to the transfer of HCV and the formation of infection foci and is cell density dependent. This cell-cell contact-mediated (CCCM) HCV transfer occurs readily and requires all these known HCV receptors and an intact actin cytoskeleton. With a fluorescently labeled replication-competent HCV system, the CCCM transfer process was further dissected by live-cell imaging into four steps: donor cell-target cell contact, formation of viral puncta-target cell conjugation, transfer of viral puncta, and posttransfer. Importantly, the CCCM HCV transfer leads to productive infection of target cells. Taken together, these results show that CCCM HCV transfer constitutes an important and effective route for HCV infection and dissemination. These findings will aid in the development of new and novel strategies for preventing and treating HCV infection.
INTRODUCTION
Approximately 170 million people, 3% of the world's population, are currently infected with hepatitis C virus (HCV) (1). The infection frequently leads to hepatitis and liver steatosis and is considered a leading cause of life-threatening chronic liver diseases, such as liver fibrosis, cirrhosis, and hepatocellular carcinoma (2). In the United States and Europe, HCV infection has become the primary cause for liver transplantation (3). Despite intensive research efforts during the last 2 decades, no HCV vaccines have become available (4, 5). The first two HCV-specific antivirals, the HCV protease NS3/NS4 inhibitors telaprevir and boceprevir, were approved by the FDA in 2011, yet combinatorial treatment with these inhibitors and pegylated alpha interferon and ribavirin has improved the response rate by only 50% to 70% in HCV genotype 1-infected patients (6, 7). It is evident that a better understanding of HCV infection and pathogenesis is required to enable the development of new anti-HCV therapeutic strategies.
The current prevailing model for cell-free HCV infection stipulates that tetraspanin CD81, scavenger receptor-B1 (SR-B1), and tight-junction proteins claudin-1 (CLDN1) and occludin (OCLN) are required for cell-free HCV entry into cells. CD81 and SR-B1 directly interact with HCV glycoprotein E2 and function in the early steps of HCV entry (8–10). In contrast, CLDN1 and OCLN have not been found to bind HCV envelope proteins, but CLDN1 associates with CD81 and functions with OCLN to mediate cell-free HCV entry in a postbinding late step (11–13). HCV is highly capable of evading the immune system, which leads to establishment of chronic infection in about 80% of infected people (14). Neutralizing antibodies (nAbs) are the main effectors of the humoral response against viral infection and one of the most important defense mechanisms in controlling viral spreading within a host. However, nAbs often fail to control the infection, albeit they are generated in chronic HCV patients (15). Frequent alterations of HCV epitopes have been proposed to contribute to viral escape from recognition and elimination by the immune system (16, 17), yet it is highly conceivable that other mechanisms for evading the immune system are involved.
Cell-cell contact-mediated (CCCM) viral infection and transmission have been demonstrated in several viruses and have been proposed to be responsible for immune escape of these viruses (18). Human immunodeficiency virus type 1 (HIV-1) and human T cell leukemia virus type 1 (HTLV-1) induce the formation of virological synapses between infected and uninfected cells that subsequently facilitate CCCM viral infection and transmission (19, 20). HIV-1 also travels along nanotubes and conduits for up to 300 μm to infect a distant cell (21). Similarly, herpes simplex virus (HSV) passes through tight junctions to infect a neighboring cell (22), and vaccinia virus (VV) induces the formation of actin tails to project progeny viruses or viruses adhered to the surface of infected cells to uninfected cells (23). Compared to cell-free infection, CCCM viral infection and transmission usually occur much faster and are less sensitive to nAbs. Viruses that utilize CCCM transfer often capitalize on one or more cellular processes to accomplish the transfer, and in most cases, the infected cell determines the processes that become appropriated. HIV-1 and HTLV-1 subvert the immunological synapse machinery in the infected cells and induce cytoskeleton reorganization and polarized viral budding toward uninfected receptor-expressing cells in a structure named virological synapses (24, 25). HIV-1 also hijacks the tunneling nanotubes in macrophages and T cells for intercellular virus transfer (21, 26), while HSV exploits the tight junctions among epithelial cells for viral spreading (22).
In this study, we established a coculture assay, demonstrated CCCM HCV infection in hepatocytes, including primary human hepatocytes (PHHs), and characterized the roles of known HCV receptors and cytoskeletal structures in this process. In addition, we adapted the tetracysteine (Tc)-biarsenical dye labeling strategy in combination with three-dimensional (3D) live-cell fluorescence microscopic imaging and dissected the spatial and temporal details of the transfer process. We confirmed the transfer of micrometer-sized HCV core protein puncta into target cells in real time and illustrated the four steps in CCCM HCV transfer: donor cell (D)-target cell (T) contact, formation of viral puncta-target cell conjugation, transfer of viral puncta, and posttransfer.
MATERIALS AND METHODS
Cells and reagents.
Huh7.5.1 cells were obtained from the laboratory of Charles Rice of Rockefeller University, New York, NY; HepG2 cells were from the American Type Culture Collection (Manassas, VA); NKNT3 and CYNK10 human hepatoma cells were kindly provided by Ira Fox of the University of Pittsburgh School of Medicine, Pittsburgh, PA. These cells were maintained in Dulbecco modified Eagle medium (DMEM) supplemented with 10% heat-inactivated fetal bovine serum (FBS) and 1% penicillin–streptomycin–l-glutamine. Huh7.5.1 cells stably expressing green fluorescent protein (GFP) (Huh7.5.1-GFP cells) were expanded from a single stable clone selected from pEGFP-N3 (Clontech, Mountain View, CA)-transfected Huh7.5.1 cells in the presence of 400 μg/ml G418 (Santa Cruz Biotechnologies, Santa Cruz, CA) and maintained in DMEM, as described above, containing 200 μg/ml G418. Cryopreserved human primary hepatocytes (CC-2591; Lonza, Walkersville, MD) were plated on rat-tail type I collagen (BD Bioscience, Bedford, MA)-coated plates and maintained in hepatocyte culture medium (PHHs; CC-3198; Lonza), as instructed. The following antibodies were used in the study: mouse anti-HCV core protein (MA1-080; Affinity Bioreagents, Golden, CO), mouse anti-CD81 1.3.3.22 (sc-7637; Santa Cruz), mouse anti-SR-B1 (610882; BD Bioscience), rabbit anti-CLDN1 (51-9000; Zymed/Invitrogen), mouse anti-OCLN (33-1500; Invitrogen, Carlsbad, CA), rabbit anti-OCLN (42-2400; Invitrogen), mouse anti-β-actin (A1978; Sigma, St. Louis, MO), mouse antitubulin (Sigma), mouse normal IgG (Santa Cruz), monoclonal human anti-E2 clone CBH-5 and isotype-matched control human anticytomegalovirus (anti-CMV) monoclonal antibody R04 (both kindly provided by Steve Foung of Stanford University, Stanford, CA), goat anti-mouse IgG-phycoerythrin (PE; Santa Cruz), goat anti-mouse IgG-Alexa 488 (Invitrogen), goat anti-mouse IgG-Alexa 555 (Invitrogen), sheep anti-mouse IgG-horseradish peroxidase (HRP; Sigma), and donkey anti-rabbit IgG-HRP (Sigma). DAPI (4′,6-diamidino-2-phenylindole), cytochalasin D, nocodazole, phalloidin-tetramethyl rhodamine isocyanate (TRITC), polyethylene glycol 8000 (PEG 8000), and the PKH26 cell labeling kit were purchased from Sigma. The 5-chloromethylfluorescein diacetate (CMFDA) cell labeling dye, the ReAsH TC tag labeling kit, and TRIzol and TRIzol LS reagents were from Invitrogen.
Plasmids and siRNAs.
pcDNA3-CD81 and pcDNA3-SR-B1 were constructed by PCR amplification of human CD81 and SR-B1 open reading frames from pOTB1-CD81 and pOTB7-SR-B1 (Open Biosystems, Lafayette, CO), respectively, followed by cloning into pcDNA3 (Invitrogen). pCMV-SPORT-Claudin1 was purchased from Open Biosystems. pJFH1-TCcore was constructed by mutagenesis of pJFH1 (kindly provided by Takaji Wakita, Japan) as described below. The 3-kb sequence from the 5′ untranslated region (5′ UTR) to nonstructural protein 2 (NS2) on pJFH1 was cloned into pBlueScript KSII (Stratagene, California) using EcoRI and NotI to obtain the intermediate cloning vector pBS-core-NS2. A full-length (FLNCCPGCCMEP) TC tag (27) was inserted into the pBS-core-NS2 plasmid right after the third amino acid of the core protein (28) using a QuikChange mutagenesis kit (XLII; Stratagene) with the forward primer 5′-GAC CGT GCA CCA TGA GCA CAT TTC TCA ATT GTT GTC CTG GCT GTT GTA TGG AAC CTA ATC CTA AAC CTC AAA GAA AAA CC-3′ and the reverse primer 5′-GGT TTT TCT TTG AGG TTT AGG ATT AGG TTC CAT ACA ACA GCC AGG ACA ACA ATT GAG AAA TGT GCT CAT GGT GCA CGG TC-3′ (the TC tag is shown in bold). The region from the 5′ UTR to NS2 containing the TC-core protein (TCcore) was then cloned back into the pJFH1 plasmid using EcoRI and NotI to obtain pJFH1-TCcore. All recombinant plasmids were verified by sequencing. SiGENOME SMARTPool small interfering RNAs (siRNAs) against human CD81 (siCD81), SR-B1 (siSR-B1), CLDN1 (siCLDN1), and OCLN (siOCLN) and scrambled control siRNA (siCtrl) were purchased from Dharmacon (Lafayette, CO).
Viral RNA preparation and siRNA/plasmid/viral RNA transfections.
pJFH1 and pJFH1-TCcore were linearized by XbaI and used as the templates to transcribe viral RNAs in vitro using a MEGAscript kit (Ambion, CA). The synthesized viral RNA was purified by acidic phenol-chloroform extraction. Viral RNA transfection into Huh7.5.1 cells, siRNA transfection of Huh7.5.1 cells, pcDNA3-CD81 transfection of HepG2 cells, and pCMV-CLDN1 transfection of NKNT3/CYNK10 cells were performed with the Lipofectamine 2000 reagent (Invitrogen) according to the manufacturer's instructions. Media were replaced at 6 h posttransfection. 293T cells were transfected with pcDNA3-CD81 and pcDNA3-SR-B1 using the standard calcium phosphate transfection method, and media were replaced after an overnight incubation. Transfection efficiencies of plasmid DNA were monitored by pEGFP-N3 transfection and were 80 to 90% for 293T cells, 40 to 50% for HepG2 cells, and 50 to 60% for NKNT3 and CYNK10 cells.
Virus production and titration.
Huh7.5.1 cells were either transfected with viral RNAs (JFH1 or JFH1-TCcore) as described above or inoculated with JFH1 viral stock (a generous gift from Wenzhe Ho of Temple University, Philadelphia, PA) at a multiplicity of infection (MOI) of 0.2 to 1. Supernatants containing HCV virions were collected at 30 to 40 days posttransfection or 5 days postinfection, cell debris was removed by low-speed centrifugation (1,000 × g, 4°C, 10 min), and the supernatants were passed through a 0.22-μm-pore-size filter and stored at −70°C. The filtered culture supernatant was concentrated by the addition of a 1/5 volume of 40% PEG 8000 to make a final concentration of 8%, and virus was precipitated at 4°C overnight, followed by centrifugation at 3,500 × g and 4°C for 30 min. The precipitated virus was suspended, titrated as described below, and stored frozen at −70°C. To titrate the virus stock, 10-fold serially diluted stock was added to Huh7.5.1 cells, and medium was changed after 2 h. At 72 h postinfection, immunostaining against HCV core protein was performed. The number of foci formed at the highest dilution was used to calculate the virus titer, which was expressed as the number of focus-forming units per milliliter of supernatant (FFU/ml). The titers of our JFH1 viral stock were usually in the range of 104 to 106 FFU/ml.
Coculture assay and transwell assay.
In the coculture assay, Huh7.5.1 cells were infected with HCV for 3 days and used as the donor cells. The donor cells or the target cells were first labeled with PKH26 or CMFDA according to the manufacturer's instructions. Briefly, cells were trypsinized and labeled with 2 μM PKH26 for 5 min at room temperature, followed by incubation with 1% FBS–phosphate-buffered saline (PBS) to stop the labeling reaction and four extensive washes to remove any residual dye. Alternatively, media containing 1.25 μM (for flow cytometry) or 5 μM (for confocal imaging) CMFDA were directly added to cells growing in culture dishes. The cells were labeled at 37°C and 5% CO2 for 30 min, followed by a medium change to normal growth medium and an extra 30 min of incubation. The labeled donor cells/target cells were counted (or trypsinized and counted for CMFDA-labeled cells) and mixed with unlabeled target/donor cells and seeded to a 24- or 12-well plate at >90% confluence. Unless stated otherwise, the donor cells/target cells were allowed to coincubate for approximately 20 h, followed by collection for immunostaining and flow cytometry or confocal analysis. The transwell assay was carried out in a similar fashion, except that neither donor nor target cells were labeled and the donor and target cells were seeded into the upper and lower chambers of the transwell (Corning, Lowell, MA), respectively.
Flow cytometry.
Cells from the coculture assay or the target cells from the transwell assay were trypsinized and fixed with 4% paraformaldehyde at room temperature for 10 min, followed by permeabilization with 50 μg/ml saponin at room temperature for 15 min. Staining was performed with mouse anti-core protein primary antibody (2 μg/ml) at room temperature for 60 min, followed by goat anti-mouse IgG-PE (4 μg/ml, for the CMFDA-labeled or Huh7.5.1-GFP cell coculture) or goat anti-mouse IgG-Alexa 488 (2 μg/ml, for the PKH26-labeled coculture) secondary antibody at room temperature for 60 min. Cells were then suspended in PBS and subjected to flow cytometry analysis (with a BD FACSCalibur or BD Accuri C6 flow cytometer). For the detection of CD81 surface expression, siRNA-transfected Huh7.5.1 cells or pcDNA3/CD81-transfected HepG2 cells were removed from culture dishes with 0.5 mM EDTA-PBS and stained with mouse normal IgG (2 μg/ml) or mouse anti-CD81 (2 μg/ml), followed by goat anti-mouse IgG-PE or goat anti-mouse IgG-Alexa 488. Cells were suspended in PBS and immediately analyzed by flow cytometry. Between each step, the cells were extensively washed with PBS.
Confocal microscopy.
Cells from the coculture assay were fixed with 4% paraformaldehyde on coverslips, permeabilized with saponin, and blocked in 1% FBS-PBS at room temperature for 30 min. Cells were stained with mouse anti-core protein primary antibody at room temperature for 60 min, followed by goat anti-mouse IgG-Alexa 488 or -Alexa 555 (2 μg/ml) secondary antibody at room temperature for 60 min. The nuclei were stained with 0.25 μg/ml DAPI in PBS at room temperature for 15 min. The coverslips were mounted with Fluoromount G medium (Southern Biotech, Birmingham, AL), and microscopic images were taken using a Zeiss Axiovert 200 microscope for epifluorescence images or a Zeiss LSM510 microscope for confocal images. For the detection of OCLN, siCtrl- or siOCLN-transfected Huh7.5.1 cells were fixed, permeabilized, and stained with mouse normal IgG (2.5 μg/ml) or mouse anti-OCLN (2.5 μg/ml), followed by goat anti-mouse IgG-Alexa 555 secondary antibody. For F-actin staining, cells from the coculture assay were fixed and permeabilized as described above and then stained with 1 μg/ml phalloidin-TRITC in PBS at room temperature for 30 min. For the visualization of microtubules, cells from the coculture assay were fixed with −20°C methanol for 3 min and then permeabilized and stained with mouse antitubulin (2 μg/ml), followed by Alexa 555-conjugated secondary antibody. Cells were washed three times with PBS between each step.
Western blotting.
Cell lysates were prepared at 48 h posttransfection or 72 h postinfection using a standard radioimmunoprecipitation assay buffer (50 mM Tris-HCl, pH 8.0, 0.5% NP-40, 2 mM EDTA, 137 mM NaCl, 10% glycerol) and separated on a 12% (for HCV core protein or CLDN) or 8% (for SR-B1 or OCLN) polyacrylamide-SDS gel. The proteins were transferred onto nitrocellulose membranes, probed with appropriate primary antibodies (1 μg/ml for mouse anti-HCV core protein and rabbit anti-CLDN1 antibodies, 2 μg/ml for mouse anti-SR-B1 and rabbit anti-OCLN antibodies, 0.5 μg/ml for anti-β-actin antibody) and HRP-conjugated secondary antibodies (0.5 μg/ml), and visualized by the use of homemade enhanced chemiluminescence reagents.
RNA extraction and qRT-PCR for HCV RNA.
RNA was isolated from cells or cell debris-free culture supernatants (50 to 200 μl) using the TRIzol or TRIzol LS reagent, respectively, according to the manufacturer's instructions and used for quantitative real-time reverse transcription-PCR (qRT-PCR) amplification with a TaqMan one-step RT-PCR kit (Applied Biosystems, Foster City, CA) and HCV-specific primers and probe, which were described previously (29). qRT-PCR was performed on a C1000 Touch thermal cycler (Bio-Rad, CA), and signal detection was with a CFX96 real-time system (Bio-Rad). The PCR program was as follows: 48°C for 30 min, 95°C for 10 min, and then 40 cycles at 95°C for 15 s and 60°C for 1 min. Serially diluted in vitro-transcribed JFH1 RNA was included as a standard in parallel and used to calculate the absolute level of HCV RNA.
ReAsH labeling of JFH1-TCcore and live-cell imaging.
Culture supernatants were collected from JFH1-TCcore-transfected Huh7.5.1 cells at day 42 posttransfection, concentrated 30-fold by using PEG 8000 precipitation, and titrated as described above. Huh7.5.1 cells were infected with the concentrated JFH1-TCcore virus (MOI = 0.15) and labeled with ReAsH according to the instructions provided in the TC tag detection kit (Invitrogen). These labeled cells were then used as donor cells. Specifically, at day 3 postinfection, cells were washed once with Opti-MEM medium (Invitrogen) and labeled with the ReAsH dye (final concentration, 1 μM) in Opti-MEM medium. Cells were incubated at 37°C for 30 min and then washed twice with 1× 2,3-dimercapto-1-propanol (BAL) wash buffer (supplied in the kit; Invitrogen) in Opti-MEM medium for 5 min each time. The wash buffer was removed, and the cells were washed once with PBS, trypsinized, and mixed at a 1:1 ratio with the Huh7.5.1-GFP target cells. The mixed cells were seeded onto polylysine-coated 35-mm glass-bottom dishes to 90% confluence, and the media were replaced with DMEM without phenol red at 2 h postseeding. Live-cell imaging was set up after the medium change. Images were taken starting at 9 h postseeding and continued for 18 h. All images were acquired with a Zeiss LSM 510 confocal microscope fitted with a ×20 air objective and a thermostatic stage incubator set at 37°C in 5% CO2. ReAsH-labeled TCcore was visualized with filter sets with excitation at 561 nm and emission at 620/80 nm, and the GFP in the target cells was detected using filter sets with excitation at 488 nm and emission at 528/45 nm. A 13-slice by 0.9-μm Z stack was taken at each selected field every 18 min using LSM 510 LUO software. Images were later processed and analyzed with the ImageJ 1.45s program. Unless otherwise specified, all red/green fluorescence images were Z projections (maximum intensity projection) from the original stack, and all differential interference contrast (DIC) images were the most focused slice from the Z stack (the 7th slice).
Data analysis.
Where appropriate, values are expressed as the mean ± standard deviation of triplicate experiments. All statistical analyses were done by one-way and two-way analyses of variance followed by post hoc tests (with the Bonferroni correction or Dunnett's test). A P value of <0.05 was considered statistically significant, a P value of <0.01 was considered highly significant, and a P value of <0.001 was considered strongly significant. All data are representative of multiple repeated experiments.
RESULTS
Formation of HCV infection foci in a cell density-dependent manner.
We repeatedly noticed that during the production and titration of HCV JFH1 virus in Huh7.5.1 cells, more distinct infection foci (clustered HCV-infected cells, usually with 10 to 50 cells) were present at the lower MOI (Fig. 1a, right) and fewer foci were present at the higher MOI and gave rise to approximately 80 to 90% HCV core protein-positive cells (Fig. 1a, middle). Formation of these infection foci at the lower MOI could result from division and proliferation of HCV-infected cells. Alternatively, it could be due to the close proximity of uninfected cells to HCV-infected cells and subsequent CCCM HCV transfer to the neighboring uninfected cells, resulting in infection. To distinguish these two possibilities, we infected Huh7.5.1 cells with JFH1 virus at a lower MOI, removed the excess virus, and then replated the cells at different cell densities. Following 3 days of continued culturing, the cells were processed for analysis of expression of the HCV core protein, a marker widely used for HCV infection. We reasoned that if infection focus formation resulted from proliferation of HCV-infected cells, there would be no correlation between the number of infection foci and cell density; if infection focus formation resulted from CCCM HCV transfer, there would be a positive correlation between the number of foci formed and cell density. To ensure the validity of the data, we assessed HCV core protein-positive cells by Western blotting for HCV core protein, immunofluorescence staining for HCV core protein followed by immunofluorescence microscopic imaging, manual counting of HCV core protein-positive cells under an immunofluorescence microscope, or flow cytometry analysis. Western blotting showed that the level of HCV core protein expression exhibited a gradual increase with a higher cell density (Fig. 1b). Immunostaining of these cells for HCV core protein followed by immunofluorescence microscopic imaging showed an apparent increase in the number and intensity of core protein-positive cells with increased cell density (Fig. 1c). The formation of core protein-positive cell foci appeared to occur only at higher cell densities. Manual quantitation of core protein-positive cells showed a positive correlation between the number of core protein-positive cells and cell density (Fig. 1d). The positive correlation was further quantified by flow cytometry analysis of core protein-positive cells (Fig. 1e), and a two-variable linear regression analysis gave rise to a correlation coefficient of 0.9883. In addition, we further showed that this positive correlation between the percentage of infected cells and cell density was dependent on the MOI; i.e., as the MOI increased, the correlation between the two parameters decreased (data reviewed but not shown). Taken together, these results suggest that HCV is capable of infecting target cells via a cell-to-cell mechanism, i.e., CCCM HCV infection and transmission.
Fig 1.
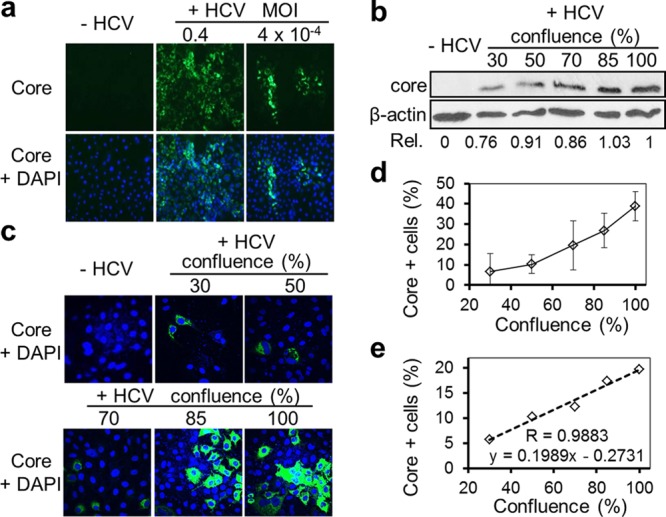
Formation of HCV infection foci and density-dependent HCV transfer. (a) Huh7.5.1 cells were inoculated with culture medium (−HCV), JFH1 virus at a high MOI of 0.4 (+HCV), or JFH1 virus at a low MOI of 4 × 10⁻⁴ (+HCV), cultured for 3 days, and immunostained for HCV core protein (green), followed by DAPI counterstaining (blue, for nuclei). (b to e) Huh7.5.1 cells were inoculated with culture medium (−HCV) or HCV JFH1 stock (+HCV) at an MOI of 0.05. At day 1 postinfection, the infected cells were replated at different densities, which gave rise to 30%, 50%, 70%, 85%, and 100% confluence at 3 days postreplating, at which time the cells were harvested and analyzed by Western blotting against HCV core protein (b), immunostained for HCV core protein (green) and DAPI (blue) (representative images) (c), counted for core protein-positive cells under a fluorescence microscope (d), or analyzed by flow cytometry for core protein-positive cells (correlation coefficient [R] = 0.9883, which was derived from a standard two-variable mathematical regression analysis: cell confluence versus percentage of core-positive cells) (e). Rel., relative values (core expression in relation to the loading control β-actin and the value of HCV-infected cells at the 100% confluence was set as 1).
CCCM HCV transfer to Huh7.5.1 and PHHs.
To characterize CCCM HCV infection, we devised a coculture assay that involved incubation of HCV-infected Huh7.5.1 donor cells with uninfected Huh7.5.1 cells for a certain period of time and determination of the number of core protein-positive target cells from CCCM HCV transfer by immunostaining. CCCM viral transmission requires different lengths of coincubation for different viruses and is often dependent on the ratio of donor cells (D) to target cells (T) (18, 30). Therefore, we started the coculture assay with a D/T ratio of 1:1 and a coincubation time of 20 h for HCV. To distinguish target cells from donor cells, several cell-labeling strategies were exploited. First, we established a GFP-expressing Huh7.5.1 stable cell line with more than 95% GFP-positive cells, as determined by flow cytometry (data reviewed but not shown), and used cells of this cell line as the target cells in the coculture assay. Incubation of these cells with HCV-infected Huh7.5.1 cells gave rise to core protein-positive and GFP-positive target cells (Fig. 2a, panels i, v, and ix, arrowheads). We also labeled naive Huh7.5.1 cells with a thiol-reactive cell-tracking dye, CMFDA (31), and used these cells as the target cells in the coculture assay. Incubation of CMFDA-labeled cells with HCV-infected Huh7.5.1 cells showed core protein-positive and CMFDA-positive target cells (Fig. 2a, panels ii, vi, and x, arrowheads). Similar results were obtained using a membrane-labeling dye, PKH26, to label the target cells (Fig. 2a, panels iii, vii, and xi, arrowheads). We also labeled HCV-infected cells with CMFDA and used them as the donor cells and naive Huh7.5.1 cells as the target cells for the coculture assay. The results showed core protein-positive and CMFDA-negative target cells (Fig. 2a, panels iv, viii, and xii, arrowheads). Quantitation analysis by flow cytometry showed a comparable level of CCCM HCV transfer, i.e., about 20% of the target cells, among the different labeling strategies (Fig. 2b). Noticeably, in both the GFP and CMFDA labeling strategies, the target cells exhibited less intense core protein staining than the donor cells (Fig. 2a), potentially explained by the directionality of HCV transfer. To ascertain that CCCM HCV transfer occurred in PHHs, we performed the coculture assay with CMFDA-labeled HCV-infected Huh7.5.1 cells as the donor cells and PHHs as the target cells. The results showed core protein-positive and CMFDA-negative PHH targets (Fig. 3a, arrowheads), which were equivalent to approximately 20% of the total target cell population, as determined by flow cytometry (Fig. 3b). Taken together, these results confirmed CCCM HCV transfer in both human hepatoma cells and primary hepatocytes.
Fig 2.
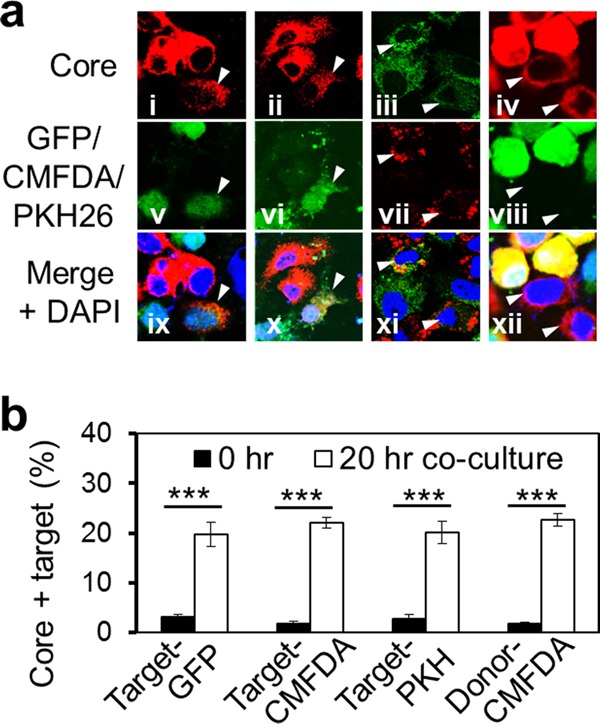
CCCM HCV transfer among Huh7.5.1 cells. Huh7.5.1 cells were infected with JFH1 virus at an MOI of 0.01, cultured for 3 days, and cocultured with GFP-expressing Huh7.5.1 target cells (a, panels i, v, and ix), CMFDA-labeled Huh7.5.1 target cells (a, panels ii, vi, and x), or PKH26-labeled Huh7.5.1 target cells (a, panels iii, vii, and xi). Alternatively, JFH1-infected cells were labeled with CMFDA (a, panels iv, viii, and xii) and cocultured with unlabeled Huh7.5.1 target cells. The donor cell/target cell ratio was 1. After 20 h of coculturing, the cell mixture was subjected to immunostaining against HCV core protein, followed by confocal imaging (newly transferred target cells are marked by arrowheads) (a) or flow cytometry analysis (b). Nuclei were counterstained with DAPI. ***, P < 0.001.
Fig 3.
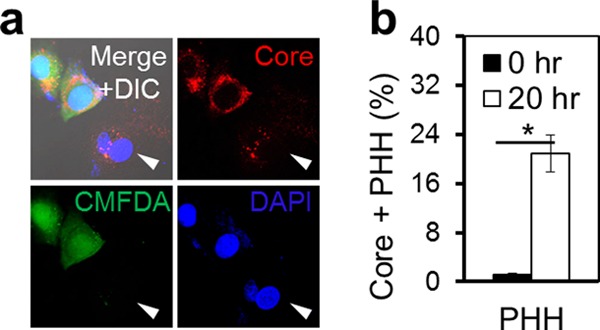
CCCM HCV transfer between Huh7.5.1 cells and PHHs. Human PHHs were cocultured with JFH1-infected CMFDA-labeled Huh7.5.1 cells at a 1:1 ratio for 20 h. The mixed culture was immunostained for HCV core protein and subjected to confocal imaging (a) or flow cytometry (b). The human primary hepatocytes with CCCM HCV transfer are marked with an arrowhead in panel a. *, P < 0.05.
CCCM HCV transfer versus cell-free HCV infection.
The core protein-positive target cells that were detected following 20 h of coculturing (Fig. 2 and 3) could also result from infection of target cells with cell-free HCV from HCV-infected donor cells. To address this possibility, we determined the kinetics of CCCM HCV transfer and compared it to that of cell-free HCV infection. We labeled uninfected Huh7.5.1 target cells with PKH26 and performed the coculture assay at a D/T ratio of 1:1 for 0, 3, 6, 9, and 20 h. Flow cytometry analysis showed that core protein-positive and PKH26-positive target cells began to emerge within 3 h of coincubation and gradually increased in number up to 20 h (Fig. 4a). In parallel, we set up a transwell assay (Fig. 4b), in which HCV-infected Huh7.5.1 donor cells were seeded on a 0.4-μm-pore-size permeable membrane on the transwell insert in the upper chamber and uninfected Huh7.5.1 cells were seeded in the lower chamber of the transwell. The 0.4-μm-pore-size permeable membrane functions as a physical barrier to separate the donor cells from the target cells and therefore allows only cell-free HCV to diffuse from the upper chamber of the transwell insert into the lower chamber of the transwell to infect cells and at the same time excludes CCCM HCV infection. As the surface area of the insert is only half of that of the bottom of the lower chamber, a D/T ratio of 1:2 was used to achieve a comparable cell confluence between the upper and lower chambers. The cells in the lower chamber were harvested at the same time points as those in the coculture assay, i.e., 0, 3, 6, and 20 h, and stained for HCV core protein expression. Compared to the results of the coculture assay, the transwell assay gave rise to very few core protein-positive target cells in the lower chamber of the transwell during the same time points (Fig. 4c). Therefore, the core protein-positive target cells detected within 20 h of coculturing (Fig. 2 and 3) likely resulted from CCCM HCV infection and not from cell-free infection. To ascertain that cell-free HCV can freely diffuse through the membrane on the insert, the transwell assay was extended to 48 and 72 h. HCV-infected cells in the lower chamber were similarly determined using core protein immunostaining. Core protein-positive cells in the lower chamber began to emerge only at 24 h and increased at 48 h and 72 h (Fig. 4d, line graph); the kinetics was very similar to that of the cell-free HCV infection of Huh7.5.1 cells by direct inoculation (Fig. 4e), which was routinely performed in the laboratory. These results not only support the notion that cell-free HCV infection takes a longer time than CCCM HCV infection but also confirm that cell-free HCV is capable of passing through the membrane and infecting target cells in the lower chamber. In addition, qRT-PCR was performed to compare the HCV RNA levels between the upper and lower chambers at 24, 48, and 72 h. No differences of HCV RNA levels were found (Fig. 4d, bar graph), further confirming that HCV can diffuse through the 0.4-μm-pore-size permeable membrane on the insert and that CCCM infection and not cell-free infection is solely responsible for the newly infected target cells in the 20-h coculture assay. Next, we determined whether CCCM HCV transfer was dependent on the D/T ratio. We performed the coculture assay with the same coincubation time (20 h) and the same total number of donor and target cells but with different D/T ratios. The results showed that the percentage of core protein-positive target cells increased with increasing D/T ratios (Fig. 4f), suggesting that a higher D/T ratio likely provided more opportunities for the target cells to be in contact with the HCV-infected donor cells. The increase in HCV CCCM transfer over the D/T ratio appeared to be modest, likely due to an already higher number (density) of starting cells in the coculturing assay. In addition, our subsequent imaging data showed that CCCM HCV transfer did not necessarily occur between one donor cell and one target cell. Furthermore, in this coculturing experiment, the same total number of cells was maintained when the D/T ratio was increased. Thus, an increase in the D/T ratio does not necessarily translate to a proportional increase in the contact between donor cells and target cells. In other words, there would be more cell-cell contact and CCCM transfer among the donor cells themselves at a higher D/T ratio. However, this type of CCCM transfer was not accounted for in our experimental setting. Taken together, these results showed that CCCM HCV infection occurred more readily than cell-free infection and was dependent on direct cell-cell contact.
Fig 4.

CCCM HCV transfer versus cell-free virus infection. (a) JFH1-infected Huh7.5.1 donor cells were cocultured with PKH26-labeled Huh7.5.1 target cells at a 1:1 ratio for 0, 3, 6, 9, or 20 h, followed by immunostaining for HCV core protein and flow cytometry analysis. The HCV core protein-positive and PKH26-positive cells in the upper right quadrant represent cells with CCCM HCV transfer; they were expressed as the percentage of the total number of cells and shown in the upper right quadrant in each dot plot. (b) JFH1-infected Huh7.5.1 donor cells were seeded on top of a 0.4-μm virus-permeable membrane in a transwell insert, and Huh7.5.1 target cells were seeded in the lower chamber of the transwell. The cells were cultured for 20 h with the same total number of cells used in the coculturing assay. The cells in the lower chambers were collected, immunostained for core protein, and analyzed by flow cytometry. (c) CCCM HCV transfer kinetics in coculturing and transwell assays at the same 1:2 ratio of D/T. (d) Similar transwell experiments were performed as described for panel b, except that extended culturing times were used. The HCV RNA in the upper and lower chambers was determined by qRT-PCR (left y axis, bar graph), whereas the percentage of core protein-positive cells in the lower chamber was determined by immunostaining for core protein, followed by flow cytometry (right y axis, dotted line). vge, viral genome equivalents. (e) Cell-free HCV infection kinetics. Huh7.5.1 cells were infected with HCV JFH1 (MOI = 1); cells were harvested at the indicated times, and core protein-positive cells were determined by immunostaining for core protein, followed by flow cytometry. (f) Similar coculturing experiments were performed as described for panel a with different ratios of donor cells/target cells. ***, P < 0.001; NS, not significant.
Indispensable roles of CD81, SR-B1, CLDN1, and OCLN in CCCM HCV transfer.
CD81, SR-B1, CLDN1, and OCLN have been shown to be involved in cell-free HCV infection (32–35). As an alternative route to cell-free infection, CCCM viral infection and transmission often require viral entry receptors that were originally defined for cell-free infection (30, 36, 37). Thus, we determined the roles of these four major HCV receptors in CCCM HCV transfer. First, we knocked down expression of each receptor individually with siRNA in Huh7.5.1 cells and used these cells as target cells in the coculture assay. A maximal knockdown of each receptor by siRNA was predetermined using different methods based on the availability of antibodies: 80% for CD81 by flow cytometry (Fig. 5a), 50% for SR-B1 and CLDN1 by Western blotting (Fig. 5b), and 70% for OCLN by both Western blotting and confocal imaging (Fig. 5b, arrow, and c). We labeled these siRNA-transfected Huh7.5.1 cells and used them to perform a 20-h coculture assay with HCV-infected Huh7.5.1 donor cells. Compared to the siRNA control, knockdown of CD81, SR-B1, CLDN1, and OCLN led to decreases in CCCM HCV transfer by 72%, 68%, 46%, and 63%, respectively (Fig. 5d). In addition, we also used siRNA to knock down all four receptors simultaneously in the target cells and performed the coculture assay. Comparable knockdown efficiencies were achieved for each of these receptors without apparent cytotoxicity or genotoxicity (data reviewed but not shown). Interestingly, CCCM HCV transfer was almost completely abolished in target cells with decreased levels of all four receptors (Fig. 5e). Taken together, these data suggest that CD81, SR-B1, CLDN1, and OCLN are all indispensable for CCCM HCV transfer and provide evidence that they may function in a coordinated manner.
Fig 5.

Expression of CD81, SR-B1, CLDN1, and OCLN and CCCM HCV transfer. Huh7.5.1 cells were transfected with 100 nM siRNAs specific for CD81, SR-B1, CLDN1, and OCLN. Preexperiments were performed to determine which siRNA concentration allowed maximal knockdown. At 48 h posttransfection, cells were collected for analysis of CD81 expression by flow cytometry (a), SR-B1, CLDN1, and OCLN expression by Western blotting (WB) (b), and OCLN expression by immunofluorescence staining and imaging (c). At 48 h posttransfection, the siRNA-transfected cells were labeled with PKH26 and then cocultured with JFH1-infected Huh7.5.1 cells at a 1:1 ratio for 20 h. The mixed cells were then immunostained for HCV core protein and analyzed by flow cytometry for target cells with CCCM HCV transfer (d). (e) Huh7.5.1 cells that were transfected with all four siRNAs for CD81, SR-B1, CLDN1, and OCLN (50 nM each) were evaluated for CCCM HCV transfer. siRNA control and isotype staining controls were included in each set of experiments, as indicated. **, P < 0.01; ***, P < 0.001.
To further analyze the roles of these receptors in CCCM HCV transfer, we took advantage of a panel of human cell lines that constitutively express varied levels of HCV receptors and determined the relationships between HCV receptor expression and cell-free HCV infection or CCCM HCV transfer. The human hepatoma cell lines HepG2, NKNT3, and CYNK10 were used. HepG2 cells lack CD81 expression but express medium to high levels of the other three major HCV receptors (38–41). NKNT3 and CYNK10 cells both express very low levels of CLDN1 but have medium to high levels of the other HCV receptors (42, 43). We also included the HCV-susceptible Huh7.5.1 cell line and the nonhepatoma fibroblast cell line 293T as controls. Huh7.5.1 cells expressed all four HCV receptors at a moderate to high level, while 293T cells expressed very high levels of CD81 and OCLN but a low level of SR-B1 and no CLDN1. Expression of all four receptors in these cells was confirmed (Table 1 and data reviewed but not shown). Of all cell lines, only Huh7.5.1 cells were susceptible to cell-free HCV infection (Table 1 and data reviewed but not shown). When each cell line was cocultured with HCV-infected Huh7.5.1 cells, no CCCM HCV transfer was detected in cells other than Huh7.5.1 cells at 24 h after coculturing (Table 1 and data reviewed but not shown). These results confirmed the important roles of all four HCV receptors in both cell-free and CCCM HCV infection. We then introduced into the cells the receptor(s) that was not expressed and/or expressed at a lower level by ectopic expression and assessed the possibility of CCCM HCV susceptibility in those cells. Ectopic expression of CD81 in HepG2 cells (Fig. 6a) gave rise to little CCCM HCV transfer from HCV-infected Huh7.5.1 cells (Fig. 6b). Similarly, ectopic expression of CLDN1 in NKNT3 cells (Fig. 6c) gave rise to little CCCM HCV transfer from HCV-infected Huh7.5.1 cells (Fig. 6d); ectopic expression of CLDN1 in CYNK10 cells gave rise to little CCCM HCV transfer from HCV-infected Huh7.5.1 cells (data reviewed but not shown); ectopic expression of both SR-B1 and CLDN1 in 293T cells (Fig. 6e) gave rise to little CCCM HCV transfer from HCV-infected Huh7.5.1 cells (Fig. 6f). Taken together, these results suggest that expression of all four major HCV receptors, CD81, SR-B1, CLDN1, and OCLN, is essential but not sufficient for CCCM HCV infection.
Table 1.
Expression of HCV receptors in different cell lines and their permissiveness to cell-free HCV infection
| Cell | Expressiona |
Cell-free HCV infectiona,d | |||
|---|---|---|---|---|---|
| CD81b | SR-B1c | CLDNc | OCLNc | ||
| Huh7.5.1 | ++ | +++ | +++ | +++ | +++ |
| 293T | +++ | + | − | +++ | − |
| HepG2 | − | ++ | +++ | ++ | − |
| CYNK10 | ++ | ++ | + | ++ | − |
| NKNT3 | ++ | ++ | + | ++ | − |
−, no expression or infection; +, low expression or infection; ++, medium expression or infection; +++, high expression or infection.
Determined by immunostaining and flow cytometry.
Determined by Western blotting.
Determined by cell-free JFH1 infection and immunostaining for core expression at 3 days postinfection.
Fig 6.
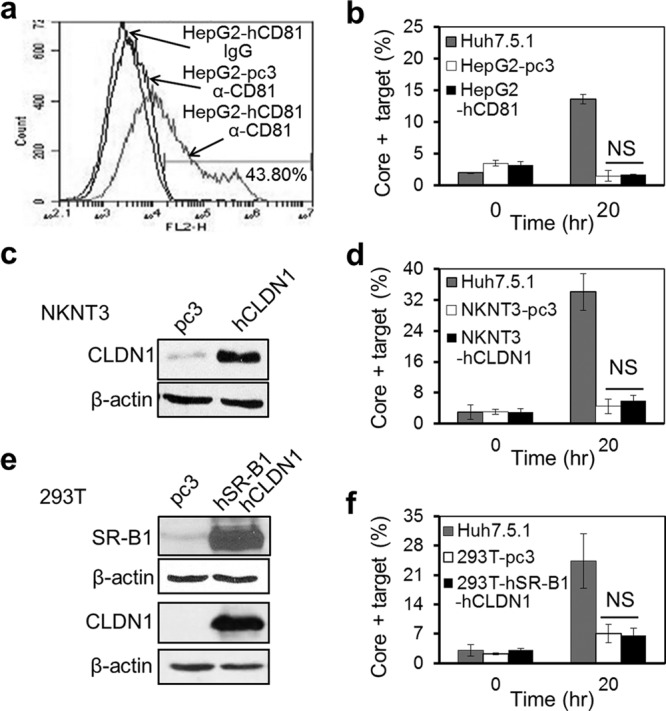
No CCCM HCV transfer from Huh7.5.1 cells to cells of other hepatoma and nonhepatoma cell lines. HepG2 cells were transfected with pcDNA3-CD81, NKNT3 cells were transfected with pCMV-CLDN1, and 293T cells were transfected simultaneously with both pcDNA3-SR-B1 and pCMV-CLDN. At 48 h posttransfection, the transfected cells were collected for analysis of CD81 expression in HepG2 cells by flow cytometry (a), CLDN1 expression in NKNT3 cells by Western blotting (c), or SR-B1 and CLDN1 expression in 293T cells by Western blotting (e). Simultaneously, these receptor-expressing HepG2, NKNT3, or 293T cells were labeled with PKH26 or CMFDA and cocultured with JFH1-infected Huh7.5.1 cells at a 1:1 ratio for 20 h. The mixed cultures were immunostained for HCV core protein and analyzed by flow cytometry for target cells with CCCM HCV transfer (b, d, and f). Naive Huh7.5.1 cells and pcDNA3-transfected 293T, HepG2, and NKNT3 cells were included as controls in these experiments. hCD81, human CD81; hSR-B1, human SR-B1; NS, not significant.
Roles of intact actin but not the microtubule cytoskeleton in CCCM HCV transfer.
To determine the roles of cytoskeleton in CCCM HCV transfer, we performed the coculturing experiments in the presence of the actin polymerization inhibitor cytochalasin D (44, 45). The effects of cytochalasin D on actin polymerization were confirmed by immunofluorescence staining of F actin. As expected, in the absence of cytochalasin D treatment, all of the F-actin filaments were along the boundaries of adjacent cells, where they made contact with each other (Fig. 7a). When the cells were treated with 0.625 μM cytochalasin D, F-actin filaments were polymerized on the tips of filopodia instead of being expressed at cell-cell contacts. When the cytochalasin D concentration was further increased to 2.5 μM or 10 μM, F-actin filaments formed aggregates in the cytoplasm and filopodia were not present. In parallel experiments, a significant decrease in CCCM HCV transfer occurred in the coculture treated with 0.625 μM cytochalasin D and a complete abrogation of CCCM HCV transfer was apparent in the cocultures treated with 2.5 μM and 10 μM cytochalasin D (Fig. 7b). We also performed similar experiments in the presence of the microtubule-depolymerizing agent nocodazole (46, 47) and determined its effects on CCCM HCV transfer. As expected, nocodazole treatment disrupted the microtubule cytoskeleton in a dose-dependent manner, as determined by antitubulin immunofluorescence staining, beginning with a gradual loss of the microtubule network, followed by more diffuse tubulin staining patterns in the cytoplasm (Fig. 7c). However, nocodazole-induced disruption of microtubules did not lead to significant changes in the level of CCCM HCV transfer (Fig. 7d). The inhibition of CCCM HCV transfer by cytochalasin D treatment (Fig. 7b) was not due to the cytotoxicity of cytochalasin D (48; our unpublished data) or any adverse effects of cytochalasin D on cell-free HCV infection (data reviewed but not shown). Therefore, these results suggest that an intact actin network but not the microtubule cytoskeleton may be required for CCCM HCV transfer.
Fig 7.

Actin and microtubule cytoskeletons and CCCM HCV transfer. JFH1-infected Huh7.5.1 donor cells were mixed with CMFDA-labeled target Huh7.5.1 cells at a 1:1 ratio and seeded. At 2 h postseeding, cytochalasin D (a and b) or nocodazole (c and d) was added to the cultures at the indicated concentrations and the cells were cultured for an additional 18 h. Cytochalasin D (Cyto D)-treated cocultures were stained with phalloidin-TRITC followed by DAPI (a), while nocodazole-treated cocultures were immunostained with a mouse antitubulin antibody followed by goat anti-mouse IgG-Alexa 555 and DAPI (c). Both cytochalasin D-treated (b) and nocodazole-treated (d) cocultures were immunostained for HCV core protein and analyzed by flow cytometry to determine the percentage of core protein-positive target cells. The percentage of core protein-positive target cells within the initial 2-h postseeding period was determined and subtracted from that after the 20-h coculturing. *, P < 0.05; **, P < 0.01; NS, not significant.
Live-cell imaging of the CCCM HCV transfer process in Huh7.5.1 cells from conjugate formation to transfer.
To directly dissect the spatial and temporal details of CCCM HCV transfer, we attempted to construct a fluorescently labeled HCV clone to characterize viral transfer in live cells. We first attempted to generate GFP-labeled HCV by introducing GFP in frame with the HCV core protein gene in JFH1 but were unsuccessful (data reviewed but not shown). This was likely due to the large size of the foreign GFP protein and subsequent alterations in HCV assembly. We therefore turned to the TC tag-biarsenical dye labeling system that has successfully been used to label and study several viruses in live cells (reviewed in reference 49), including HCV (28, 50). Compared to the GFP-core protein fusion protein strategy, this system requires insertion of only a short nucleotide sequence encoding a peptide of 12 amino acids, including the tetracysteine (TC) tag (-CCXXCC-), into the viral genome without affecting virus translation, replication, assembly, production, and infectivity (28, 49, 50). The presence of the TC tag allows the tagged HCV core protein in the cells or in HCV to be detected live by microscopic imaging through its covalent binding to the cell membrane-permeant nonfluorescent biarsenical compound and its ensuing fluorophore. We constructed the HCV-TC clone in the context of JFH1, subsequently referred to as JFH1-TCcore (Fig. 8a). We transfected Huh7.5.1 cells with an equal amount of in vitro-transcribed full-length JFH1 RNA or JFH1-TCcore RNA and monitored HCV replication and production using qRT-PCR. Compared to JFH1, JFH1-TCcore showed a slightly delayed viral replication (Fig. 8b) and virus production (Fig. 8c) and a 2- to 4-fold lower maximal level of virus production (Fig. 8c). Nevertheless, labeling of JFH1-TCcore-transfected and -infected cells with the biarsenical compound did not alter the HCV-TCcore infectivity (data reviewed but not shown) (50). We then determined the labeling specificity of the biarsenical compound (ReAsH) and the subcellular localization of the TC-tagged core protein. Huh7.5.1 cells were transfected with in vitro-transcribed full-length JFH1 or JFH1-TCcore RNA and stained with ReAsH and then HCV core protein using an anti-HCV core protein antibody. ReAsH labeled only JFH1-TCcore-transfected cells and not JFH1-transfected cells (Fig. 8d). There appeared to be a complete overlap of ReAsH labeling with HCV core protein staining, confirming that ReAsH specifically bound to the TC tag and that the tag did not alter the subcellular localization of HCV core protein. Taken together, these results demonstrate the feasibility of using the JFH1-TCcore and ReAsH labeling system to track HCV core protein in live cells.
Fig 8.
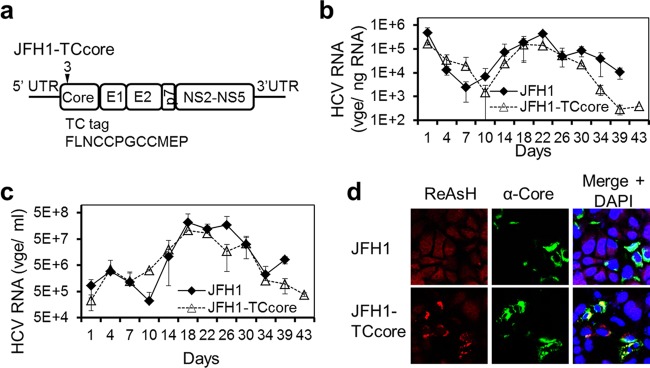
Characterization of recombinant JFH1-TCcore HCV. (a) JFH1-TCcore recombinant HCV clone. A TC tag-containing 12-amino-acid peptide was inserted after the third amino acid of the HCV JFH1 core protein. (b and c) Huh7.5.1 cells were transfected with an equal amount of in vitro-transcribed full-length HCV JFH1 RNA or HCV JFH-TCcore RNA. Transfection medium was replaced with fresh culture medium, and the cells were extensively washed 6 h after transfection. RNA was isolated from the cells and the culture supernatants at the indicated time points and was subjected to qRT-PCR to monitor HCV replication in the cells (b) and HCV production in the culture supernatants (c), respectively. (d) ReAsH labeling specificity of TCcore in JFH1-TCcore RNA-transfected Huh7.5.1 cells. Huh7.5.1 cells were transfected with JFH1 or JFH1-TCcore RNA. At 3 days posttransfection, the cells were first labeled with ReAsH and then immunostained for detection of the HCV core protein and stained with DAPI for detection of the nucleus.
We performed live-cell imaging to track CCCM HCV transfer with the JFH1-TCcore system. We infected Huh7.5.1 cells with JFH1-TCcore for 3 days and then labeled the cells with ReAsH. We used ReAsH-labeled cells as donor cells and Huh7.5.1 cells stably expressing GFP (Huh7.5.1-GFP cells) as target cells and performed the coculturing assay under live confocal imaging. Red (ReAsH)/green (GFP) fluorescence and DIC images in the selected fields were taken every 18 min throughout the 18-h coculturing period. A single HCV-infected ReAsH-labeled Huh7.5.1 donor cell (Fig. 9a, labeled D) had three recorded sequential transfer events (yellow arrowheads) to three contacted target Huh7.5.1-GFP cells (Fig. 9a, labeled T1, T2, and T3) during this time period (see Movie S1 in the supplemental material). For each transfer event, the donor cell either accumulated large numbers of viral puncta on the contact surface between the donor cell and the target cell (Fig. 9a, D and T1 above panels i and ii) or produced filopodia containing viral puncta at the contact site (Fig. 9a, D and T2 above panel III and D and T3 above panel iv) prior to the transfer. Simultaneous transfer of HCV from one single donor cell to multiple target cells was also recorded (Fig. 9b; see Movies S2 and S3 in the supplemental material). The orthogonal view (Fig. 9b) and 3D reconstruction of the transfer process (Fig. 9c; see Movies S3 and S4 in the supplemental material) confirmed that the transferred viral puncta were located inside the target cell, as the viral puncta were visualized as yellow rather than red. The sizes of the pretransfer viral puncta were estimated to be approximately 0.5 μm to 2 μm, suggesting that the puncta contained more than a single virus. The number of core protein puncta that were transferred from one donor cell to one target cell could reach up to 100 during the 18-h coculturing period. Tracking the transfer of a single viral puncta revealed four distinct steps in the CCCM HCV transfer process: donor cell-target cell contact, viral puncta-target cell conjugate formation, transfer of viral puncta, and posttransfer (Fig. 9d). The transfer began with contact initiated between the donor and target cells (Fig. 9d, panel i). Viral puncta were formed within the donor cell and transitioned to the contact site between the donor and the target cells (Fig. 9d, panel i). This was followed by formation of viral puncta-target cell conjugates (Fig. 9d, panel ii). The transfer took place when the viral puncta were localized in the target cell (Fig. 9d, panel iii). The viral puncta likely dissipated into a few smaller puncta in the target cell (Fig. 9d, panel iv) and presumably disappeared as viral uncoating took place. A single transfer event was estimated to take approximately 18 min to complete. To further understand the transfer process, we analyzed the transfer events in the entire tracked field (450 μm by 450 μm). There were a total of 33 ReAsH-positive donor cells and 160 Huh7.5.1-GFP target cells in the field at the beginning of tracking (time zero). During the 18 h of tracking, 13 cells (13/33 = 39%) formed conjugates with target cells, 7 donor cells showed transfer (7/33 = 21%), and a total of 8 transfer events occurred (Fig. 9e). Each of these processes was confirmed with 3D reconstruction, as shown in Fig. 9c and d. The average duration of viral puncta-target cell conjugation between a donor cell and a target cell was calculated to be 408 min, and the average time for the actual transfer was calculated to be 171 min. The latter was much longer than the 18 min for a single transfer event, as estimated above; this is because more than one viral punctum was transferred between one donor cell and one target cell. Taken together, these results provide the temporal and spatial details of CCCM HCV transfer and demonstrate the high efficiency of this transmission route.
Fig 9.

Live-cell imaging of CCCM HCV transfer. JFH1-TCcore-infected ReAsH-labeled Huh7.5.1 donor cells (red) and Huh7.5.1-GFP target cells (green) were cocultured and imaged live for 18 h. (a) CCCM HCV transfer from one ReAsH-positive TCcore-positive donor cell (labeled D) to three GFP-positive target cells (labeled T1, T2, and T3 and outlined) sequentially over 18 h of coculturing. The ReAsH, GFP, and DIC overlay is shown in the upper panels, from which the boxed area was magnified and examined in the middle (ReAsH only) and the lower (ReAsH and GFP overlay) panels. HCV transfer from the donor cell (D) to target cells T1 (i and ii) and T2 (iii), and T3 (vi) is indicated by yellow arrowheads. The yellow arrow (v) indicates T3's filopodia toward D after viral transfer. Times are shown in hours:minutes. (b) Concurrent HCV transfer from one donor cell (red) to two target cells (green). Orthogonal views are shown, and the positions of the perpendicular planes are indicated as notches. (c) 3D reconstruction of a transfer event between a donor cell and one target cell observed in panel b. This transfer event occurred at a time later than that shown in panel b. (d) Transfer of a viral punctum (circled in the lower panels) into a target cell: (i) donor cell-target cell in contact before conjugate formation; (ii) formation of viral puncta-target cell conjugation; (iii) transfer of viral puncta; and (iv) posttransfer. The lower panels are 3D reconstructions of the boxed area in the corresponding upper panels. (e) Tracking of transfer events in 13 donor cells in one imaging field; each line represents one donor cell-target cell pair.
CCCM HCV transfer and productive HCV infection.
To determine whether CCCM HCV transfer leads to productive HCV infection, we took advantage of a neutralizing HCV antibody (CBH-5) that has been shown to be very effective in blocking free HCV infection (51, 52). We first confirmed that CBH-5 blocked free HCV infection by over 99% at a concentration of 5 μg/ml (data reviewed but not shown). We then performed the above-mentioned coculture HCV transfer assay in the presence of 5 μg/ml CBH-5 or a control isotope-matched antibody (R04) (51, 52) and determined the percentage of HCV core protein-positive target cells at 24, 48, and 72 h of coculturing. The percentage of HCV core protein-positive target cells increased over time (Fig. 10a and b). Compared to the results obtained with the R04 control, CBH-5 treatment showed a slightly lower but still significant percentage of HCV core protein-positive cells and significant increases in the percentage of HCV core protein-positive cells over time. In addition, the mean fluorescence intensity of the core protein-positive cells exhibited increases over time in both R04- and CBH-5-treated cocultures (Fig. 10c). The increases in the percentage and the mean fluorescence intensity of HCV core protein-positive target cells over an extended period of time in the presence of the neutralizing HCV antibody CBH-5 suggest that CCCM HCV transfer leads to productive HCV infection and replication. Culture supernatants were collected from cocultures that were treated with each of the antibodies and tested for their infectivity. Very few HCV core protein-positive cells were detected with CBH-5-treated culture supernatants at each time point (Fig. 10d), confirming the HCV-neutralizing activity of the CBH-5 antibody.
Fig 10.

CCCM HCV transfer leads to productive HCV infection. (a to d) Infected Huh7.5.1 cells were cocultured with GFP-expressing Huh7.5.1 cells at a 1:4 ratio in the presence of 5 μg/ml neutralizing antibody CBH-5 or a control antibody, R04. The coculture was replated every 24 h, and fresh antibodies were added. Meanwhile, aliquots of cells were collected for core protein staining, followed by flow cytometry analysis for GFP-positive/core protein-positive cells (a to c); the supernatants were also collected and used to infect uninfected Huh7.5.1 cells, and their infectivity was determined by immunostaining and flow cytometry analysis for HCV core protein-positive cells at 3 days postinfection (d). (a) Representative kinetics of GFP-positive/core protein-positive cells; (b) data from multiple repeats; (c) difference in mean fluorescence intensity (dMFI) of core protein staining of GFP-positive cells from multiple repeats. (e to h) Infected Huh7.5.1 cells were cocultured with GFP-expressing Huh7.5.1 cells at a 1:4 ratio in the presence of 5 μg/ml neutralizing antibody CBH-5. GFP-expressing target cells were sorted out from the cocultures at day 1 (D1) and further cultivated for an extended period of time. Core protein-positive cells in the purified GFP-positive cell population were determined at day 4 (D4) and day 7 (D7) by immunostaining for the core protein. (e) Representative kinetics of GFP-positive/core protein-positive cells; (f) data from multiple repeats. D1#, cocultured cells prior to sorting. In addition, cells and their culture supernatants were collected at day 4 and day 7 and assayed for HCV RNA in the cell by qRT-PCR (g) or for the infectivity of the supernatant (h), respectively, as described for panel d. **, P < 0.01; ***, P < 0.001; NS, not significant.
To further ascertain the productive nature of CCCM HCV transfer, we set up CCCM HCV transfer using stable GFP-expressing Huh7.5.1 as the target cells in the coculture experiments. Following the initial 20-h coculturing in the presence of 5 μg/ml CBH-5 antibody, we used fluorescence-activated cell sorting (FACS) to sort out the GFP-positive target cells and then monitored HCV replication in these sorted cells. FACS yielded more than 97% GFP-positive cells, of which about 2% were HCV core protein-positive cells (Fig. 10e and f). Similarly, the percentage of HCV core protein-positive and GFP-positive cells showed increases over an extended period of time up to 7 days. In parallel, there was a significant increase of HCV RNA in these cells between day 4 and day 7 (Fig. 10g) and the infectivity of the culture supernatants between day 4 and day 7 (Fig. 10h). Similar results were also obtained by selective elimination of the HCV-infected Huh7.5.1 donor cells from the coculturing and monitoring of HCV infection and replication in the remaining target cells (data reviewed but not shown). Taken together, these results support the notion that CCCM HCV transfer leads to productive infection and replication.
DISCUSSION
Despite significant advances since the establishment of the JFH1-based HCV cell culture system in 2005 (53–55), the process of HCV transmission and spreading in the liver following infection remains poorly understood. The liver is one of the organs with an extremely high cell density (2 × 10⁵ to 3.0 × 10⁵ hepatocytes/cm2 [56]), which provides HCV with numerous cell-cell contact sites. In chronically HCV-infected liver, viral replication and the intrahepatic HCV RNA level are very low (7 to 64 genomic equivalents per cell) (57, 58), and nAbs and other immunological responses are often present (59). However, even with the presence of those nAbs that are capable of neutralizing cell-free infectivity in vitro (15), the prevalence of infected hepatocytes in the livers of chronically infected patients is normally high (57, 60). Our data show that cell-cell contact facilitates HCV spreading among hepatocytes (Fig. 1 and 2), including PHHs (Fig. 3). We further show that CCCM HCV infection is a rapid process compared to cell-free HCV infection (Fig. 4). Previous studies have shown that discrete, localized infectious foci and a gradient dispersion of the viral genome around the center of the foci are observed in patient liver biopsy specimens (58, 60, 61) and that CCCM HCV infection is relatively less sensitive to nAbs and neutralizing patient sera than cell-free HCV infection (62). Taken together, it is highly conceivable that CCCM HCV occurs in vivo, and it could even be more favorable than cell-free infection, given the compact nature of the liver. Thus, CCCM HCV transmission should be considered in designing any future anti-HCV vaccines and therapeutics.
CD81, the first discovered HCV receptor, was identified by screening for HCV E2 binding (33) and is believed to mediate HCV cell-free entry in both an early E2-binding step and a late postbinding step in association with CLDN1 (8, 12, 13). SR-B1, another E2-binding HCV receptor, also mediates cell-free HCV attachment and entry in an early step in this multistep entry process (63–66). The other two, CLDN1 and OCLN, are both tight-junction proteins recently identified to be HCV coreceptors by screening for cellular determinants able to confer HCV pseudotyped particle (HCVpp) entry into nonsusceptible cells (32, 34). To determine the role of each of these four HCV receptors in CCCM HCV infection, we first used an siRNA strategy to knock down the expression of each of them individually in Huh7.5.1 target cells and found between 46% and 72% decreases in CCCM HCV infection, suggesting a fundamental role of each of them in this process (Fig. 5). Furthermore, simultaneous knockdown of all of them almost completely abolished CCCM HCV infection, suggesting that they mediate CCCM HCV infection in a combinatorial mechanism. To further understand the roles of the four receptors in CCCM infection, we performed the coculture assay using CD81-negative HepG2 cells, NKNT3 and CYNK10 cells expressing low levels of CLDN1, and 293T cells expressing low levels of SR-B1 and no CLDN1 (Table 1 and data reviewed but not shown). All these cell lines are refractory to both cell-free and CCCM HCV infection (Table 1 and data reviewed but not shown). However, ectopic expression of the receptor(s) that was missing or expressed at a low level did not render these cells susceptible to CCCM HCV infection (Fig. 6). These results together suggest that all four HCV receptors are important for CCCM HCV infection. Consistent with our findings, previous studies have shown that SR-B1 antagonists and an anti-CLDN1 serum inhibit CCCM HCV infection (67). However, the roles of CD81 in CCCM HCV infection appear to be controversial in the literature. Using soluble CD81 and anti-CD81 antibody, one group has shown that CCCM HCV infection can be either CD81 dependent or CD81 independent (62). The same group later used a different HCV strain and concluded that CD81 is important for CCCM HCV infection (67). On the other hand, the other group used CD81 binding-deficient E2 mutant-containing JFH1 virus and showed that CD81 is not necessary for CCCM HCV infection (68). It is clear that the roles of CD81 in CCCM HCV infection merit further investigation.
CCCM infection has been shown in many different animal viruses, and its role in immune evasion and rapid viral dissemination has recently gained more attention (18). CCCM viral transmission in animal cells could occur in a variety of ways. Among the known ways are through virological synapses (HIV-1 and HTLV-1), nanotubules (HIV-1), viral transfer across tight junctions (HSV), and viral induction of actin tails (VV) (18). Interestingly, all the CCCM transmission routes described above involve actin and/or microtubule cytoskeletons. In addition, CCCM spreading has also been found to be very common in plant virus infection and usually involves targeting of a virus-encoded movement protein(s) (MP) to a plant-specific organelle, plasmodesmata (PD), which are narrow tunnels in the cell wall for intercellular communication (69). Movement strategies for CCCM viral spreading differ by virus and MP. In tobacco mosaic virus infection, MP binds and chaperons genomic RNA in the virus replication complexes (VRCs) and targets the whole VRC to PD for CCCM viral spreading (70). In the grapevine fanleaf virus infection, MP recruits the PD receptor plasmodesma-located protein to PD to mediate the formation of tubules through which the assembled virions traverse PD (so-called tubule-forming virus) (71). Interestingly, in virtually all CCCM plant virus infections, movement of MPs, VRCs, virions, or other essential cellular cofactors to and/or through PD requires an intact cytoskeleton, particularly the actomyosin motor system (70–73). Thus, we determined the roles of actin and/or microtubule cytoskeletons in CCCM HCV infection. The actin cytoskeleton has been shown to be involved in interaction with multiple steps of cell-free HCV infection, including viral entry (44, 74) and replication (75, 76). In agreement with these findings, our studies have shown that an intact actin network was required for CCCM HCV transfer, as treatment with actin polymerization inhibitor cytochalasin D in the coculturing assay prevented CCCM HCV transfer (Fig. 7a and b). Based on the known function of cytochalasin D and our finding that HCV secretion from infected cells was not affected by the treatment (data reviewed but not shown), we speculate that cytochalasin D likely inhibits the transfer process at the donor cell-target cell contact sites or the uptake of viral puncta by the target cells. On the other hand, we showed that treatment of the cells with a microtubule-depolymerizing agent, nocodazole, at a concentration which we showed to be sufficient to disassemble microtubules (Fig. 7c) (46) had few effects on CCCM HCV transfer (Fig. 7d). Contrary to our studies, other studies have found that nocodazole treatment inhibits microtubule-dependent transport of the HCV replication complex, initiation of productive HCV infection, and, as a result, HCV RNA replication (75, 77, 78). Moreover, two recent reports have shown that postassembly the vesicular HCV core protein puncta traffic via microtubules and that trafficking is inhibited by nocodazole treatment (28, 50). It is important to point out that all the above-mentioned studies used much higher concentrations of nocodazole that were mostly 10 to 20 times higher than the concentration that we used in our studies. The extremely high concentrations of nocodazole used in those studies could be the main reason for the discrepancies.
It is believed that cell-free HCV is released from infected cells through the secretion pathway (79). After translation and processing on the endoplasmic reticulum (ER) membrane, mature HCV core protein is relocated to the surface of lipid droplets (80). When the RNA genome from the replication complex on the membranous web and the envelope proteins (E1/E2) on the ER are complete, viral assembly/envelopment takes place on the ER outer membrane in close proximity to the lipid droplets, toward the ER lumen (50). These intracellular viruses become infectious upon envelopment and are thought to be loaded into secretory vesicles that egress via the ER-trans Golgi network secretory pathway and are released from the plasma membrane (28). However, the fusion of HCV-loaded vesicles with the plasma membrane (the actual release process) has never been captured with fluorescence or electron microscopy. Our live-cell imaging studies showed that during CCCM HCV transmission, large amounts of mobile viral puncta moved to the contacted surfaces between the donor and target cells and formed conjugates with the target cell, followed by transfer of the entire viral puncta (Fig. 9). These core protein puncta are micrometer sized and are unlikely to be single viral particles but are more likely to be vesicles loaded with virus particles (100 to 1,000 virions/punctum, on the basis of size) (28, 50). The transfer of a single core protein punctum took 18 min (Fig. 9d), and the transfer process lasted 171 min, on average (Fig. 9e). Moreover, the transfer events could occur at multiple donor cell-target cell contact sites (Fig. 9a, panel ii) or concurrently between one donor and multiple targets (Fig. 9b). Therefore, during the entire CCCM transfer process, a great number of viral puncta, which correspond to an even greater number of viral particles, can be delivered into the target cell, in contrast to the cell-free infection, in which one virion enters one target cell at a time. It is not guaranteed that each of the viral particles in each of the transferred puncta proceeds through the downstream viral life cycle in the target cell, yet the high input of CCCM viral transfer certainly leads to productive infection of the target cell (Fig. 10).
In summary, we showed that HCV infection occurs through CCCM transmission, resulting in efficient and productive infection and replication. In addition, we demonstrated the requirement of HCV receptors in CCCM infection and the involvement of the actin cytoskeleton in this process. Furthermore, the three-dimensional live-cell microscopic imaging showed the kinetics and process of transfer of intact core protein puncta from donor cells to target cells. These findings will add to our understanding of HCV infection and transmission and provide new avenues for the development of novel anti-HCV therapeutics.
Supplementary Material
ACKNOWLEDGMENTS
We thank Charles Rice of Rockefeller University, New York, NY, for Huh7.5.1 cells, Ira Fox of the University of Pittsburgh, Pittsburgh, PA, for NKNT3 and CYNK10 cells, Wenzhe Ho of Temple University, Philadelphia, PA, for the JFH1 virus stock, Takaji Wakita of the National Institute of Infectious Diseases, Japan, for JFH1 recombinant plasmid DNA, and Steve Foung of Stanford University, Stanford, CA, for antibodies CBH-5 and R04. We also thank Ignacy Gryzcynski, Rafal Fudala, and I-Fen Chang for their assistance on confocal imaging, Larry Oakford for his assistance on confocal data processing, and Andy (Qigui) Yu, Randy Brutkiewicz, Cheng Kao, and William Sullivan for their advice and input throughout the study.
Footnotes
Published ahead of print 29 May 2013
Supplemental material for this article may be found at http://dx.doi.org/10.1128/JVI.01062-13.
REFERENCES
- 1. Tang H, Grisé H. 2009. Cellular and molecular biology of HCV infection and hepatitis. Clin. Sci. 117:49–65 [DOI] [PubMed] [Google Scholar]
- 2. Poynard T, Bedossa P, Opolon P. 1997. Natural history of liver fibrosis progression in patients with chronic hepatitis C. The OBSVIRC, METAVIR, CLINIVIR, and DOSVIRC groups. Lancet 349:825–832 [DOI] [PubMed] [Google Scholar]
- 3. Brown RS. 2005. Hepatitis C and liver transplantation. Nature 436:973–978 [DOI] [PubMed] [Google Scholar]
- 4. Ip PP, Nijman HW, Wilschut J, Daemen T. 2012. Therapeutic vaccination against chronic hepatitis C virus infection. Antiviral Res. 96:36–50 [DOI] [PubMed] [Google Scholar]
- 5. Feinstone SM, Hu DJ, Major ME. 2012. Prospects for prophylactic and therapeutic vaccines against hepatitis C virus. Clin. Infect. Dis. 55(Suppl 1):S25–S32 [DOI] [PubMed] [Google Scholar]
- 6. Sarrazin C, Zeuzem S. 2010. Resistance to direct antiviral agents in patients with hepatitis C virus infection. Gastroenterology 138:447–462 [DOI] [PubMed] [Google Scholar]
- 7. Schinazi RF, Bassit L, Gavegnano C. 2010. HCV drug discovery aimed at viral eradication. J. Viral Hepat. 17:77–90 [DOI] [PMC free article] [PubMed] [Google Scholar]
- 8. Brazzoli M, Bianchi A, Filippini S, Weiner A, Zhu Q, Pizza M, Crotta S. 2008. CD81 is a central regulator of cellular events required for hepatitis C virus infection of human hepatocytes. J. Virol. 82:8316–8329 [DOI] [PMC free article] [PubMed] [Google Scholar]
- 9. Catanese MT, Ansuini H, Graziani R, Huby T, Moreau M, Ball JK, Paonessa G, Rice CM, Cortese R, Vitelli A, Nicosia A. 2010. Role of scavenger receptor class B type I in hepatitis C virus entry: kinetics and molecular determinants. J. Virol. 84:34–43 [DOI] [PMC free article] [PubMed] [Google Scholar]
- 10. Zeisel MB, Koutsoudakis G, Schnober EK, Haberstroh A, Blum HE, Cosset FL, Wakita T, Jaeck D, Doffoel M, Royer C, Soulier E, Schvoerer E, Schuster C, Stoll-Keller F, Bartenschlager R, Pietschmann T, Barth H, Baumert TF. 2007. Scavenger receptor class B type I is a key host factor for hepatitis C virus infection required for an entry step closely linked to CD81. Hepatology 46:1722–1731 [DOI] [PubMed] [Google Scholar]
- 11. Benedicto I, Molina-Jimenez F, Bartosch B, Cosset FL, Lavillette D, Prieto J, Moreno-Otero R, Valenzuela-Fernandez A, Aldabe R, Lopez-Cabrera M, Majano PL. 2009. The tight junction-associated protein occludin is required for a postbinding step in hepatitis C virus entry and infection. J. Virol. 83:8012–8020 [DOI] [PMC free article] [PubMed] [Google Scholar]
- 12. Harris HJ, Davis C, Mullins JG, Hu K, Goodall M, Farquhar MJ, Mee CJ, McCaffrey K, Young S, Drummer H, Balfe P, McKeating JA. 2010. Claudin association with CD81 defines hepatitis C virus entry. J. Biol. Chem. 285:21092–21102 [DOI] [PMC free article] [PubMed] [Google Scholar]
- 13. Harris HJ, Farquhar MJ, Mee CJ, Davis C, Reynolds GM, Jennings A, Hu K, Yuan F, Deng H, Hubscher SG, Han JH, Balfe P, McKeating JA. 2008. CD81 and claudin 1 coreceptor association: role in hepatitis C virus entry. J. Virol. 82:5007–5020 [DOI] [PMC free article] [PubMed] [Google Scholar]
- 14. Sharma SD. 2010. Hepatitis C virus: molecular biology & current therapeutic options. Indian J. Med. Res. 131:17–34 [PubMed] [Google Scholar]
- 15. Zeisel MB, Fafi-Kremer S, Fofana I, Barth H, Stoll-Keller F, Doffoel M, Baumert TF. 2007. Neutralizing antibodies in hepatitis C virus infection. World J. Gastroenterol. 13:4824–4830 [DOI] [PMC free article] [PubMed] [Google Scholar]
- 16. Petrovic D, Dempsey E, Doherty DG, Kelleher D, Long A. 2012. Hepatitis C virus—T-cell responses and viral escape mutations. Eur. J. Immunol. 42:17–26 [DOI] [PubMed] [Google Scholar]
- 17. Helle F, Duverlie G, Dubuisson J. 2011. The hepatitis C virus glycan shield and evasion of the humoral immune response. Viruses 3:1909–1932 [DOI] [PMC free article] [PubMed] [Google Scholar]
- 18. Sattentau Q. 2008. Avoiding the void: cell-to-cell spread of human viruses. Nat. Rev. Microbiol. 6:815–826 [DOI] [PubMed] [Google Scholar]
- 19. Hubner W, McNerney GP, Chen P, Dale BM, Gordon RE, Chuang FY, Li XD, Asmuth DM, Huser T, Chen BK. 2009. Quantitative 3D video microscopy of HIV transfer across T cell virological synapses. Science 323:1743–1747 [DOI] [PMC free article] [PubMed] [Google Scholar]
- 20. Igakura T, Stinchcombe JC, Goon PK, Taylor GP, Weber JN, Griffiths GM, Tanaka Y, Osame M, Bangham CR. 2003. Spread of HTLV-I between lymphocytes by virus-induced polarization of the cytoskeleton. Science 299:1713–1716 [DOI] [PubMed] [Google Scholar]
- 21. Kadiu I, Gendelman HE. 2011. Human immunodeficiency virus type 1 endocytic trafficking through macrophage bridging conduits facilitates spread of infection. J. Neuroimmune Pharmacol. 6:658–675 [DOI] [PMC free article] [PubMed] [Google Scholar]
- 22. Dingwell KS, Brunetti CR, Hendricks RL, Tang Q, Tang M, Rainbow AJ, Johnson DC. 1994. Herpes simplex virus glycoproteins E and I facilitate cell-to-cell spread in vivo and across junctions of cultured cells. J. Virol. 68:834–845 [DOI] [PMC free article] [PubMed] [Google Scholar]
- 23. Doceul V, Hollinshead M, van der Linden L, Smith GL. 2010. Repulsion of superinfecting virions: a mechanism for rapid virus spread. Science 327:873–876 [DOI] [PMC free article] [PubMed] [Google Scholar]
- 24. Jolly C, Kashefi K, Hollinshead M, Sattentau QJ. 2004. HIV-1 cell to cell transfer across an Env-induced, actin-dependent synapse. J. Exp. Med. 199:283–293 [DOI] [PMC free article] [PubMed] [Google Scholar]
- 25. Jolly C, Sattentau QJ. 2004. Retroviral spread by induction of virological synapses. Traffic 5:643–650 [DOI] [PubMed] [Google Scholar]
- 26. Sowinski S, Jolly C, Berninghausen O, Purbhoo MA, Chauveau A, Kohler K, Oddos S, Eissmann P, Brodsky FM, Hopkins C, Onfelt B, Sattentau Q, Davis DM. 2008. Membrane nanotubes physically connect T cells over long distances presenting a novel route for HIV-1 transmission. Nat. Cell Biol. 10:211–219 [DOI] [PubMed] [Google Scholar]
- 27. Martin BR, Giepmans BN, Adams SR, Tsien RY. 2005. Mammalian cell-based optimization of the biarsenical-binding tetracysteine motif for improved fluorescence and affinity. Nat. Biotechnol. 23:1308–1314 [DOI] [PubMed] [Google Scholar]
- 28. Coller KE, Heaton NS, Berger KL, Cooper JD, Saunders JL, Randall G. 2012. Molecular determinants and dynamics of hepatitis C virus secretion. PLoS Pathog. 8:e1002466. 10.1371/journal.ppat.1002466 [DOI] [PMC free article] [PubMed] [Google Scholar]
- 29. Takeuchi T, Katsume A, Tanaka T, Abe A, Inoue K, Tsukiyama-Kohara K, Kawaguchi R, Tanaka S, Kohara M. 1999. Real-time detection system for quantification of hepatitis C virus genome. Gastroenterology 116:636–642 [DOI] [PubMed] [Google Scholar]
- 30. Chen P, Hubner W, Spinelli MA, Chen BK. 2007. Predominant mode of human immunodeficiency virus transfer between T cells is mediated by sustained Env-dependent neutralization-resistant virological synapses. J. Virol. 81:12582–12595 [DOI] [PMC free article] [PubMed] [Google Scholar]
- 31. Lopez-Balderas N, Huerta L, Villarreal C, Rivera-Toledo E, Sandoval G, Larralde C, Lamoyi E. 2007. In vitro cell fusion between CD4(+) and HIV-1 Env(+) T cells generates a diversity of syncytia varying in total number, size and cellular content. Virus Res. 123:138–146 [DOI] [PubMed] [Google Scholar]
- 32. Evans MJ, von Hahn T, Tscherne DM, Syder AJ, Panis M, Wolk B, Hatziioannou T, McKeating JA, Bieniasz PD, Rice CM. 2007. Claudin-1 is a hepatitis C virus co-receptor required for a late step in entry. Nature 446:801–805 [DOI] [PubMed] [Google Scholar]
- 33. Pileri P, Uematsu Y, Campagnoli S, Galli G, Falugi F, Petracca R, Weiner AJ, Houghton M, Rosa D, Grandi G, Abrignani S. 1998. Binding of hepatitis C virus to CD81. Science 282:938–941 [DOI] [PubMed] [Google Scholar]
- 34. Ploss A, Evans MJ, Gaysinskaya VA, Panis M, You H, de Jong YP, Rice CM. 2009. Human occludin is a hepatitis C virus entry factor required for infection of mouse cells. Nature 457:882–886 [DOI] [PMC free article] [PubMed] [Google Scholar]
- 35. Scarselli E, Ansuini H, Cerino R, Roccasecca RM, Acali S, Filocamo G, Traboni C, Nicosia A, Cortese R, Vitelli A. 2002. The human scavenger receptor class B type I is a novel candidate receptor for the hepatitis C virus. EMBO J. 21:5017–5025 [DOI] [PMC free article] [PubMed] [Google Scholar]
- 36. Polcicova K, Goldsmith K, Rainish BL, Wisner TW, Johnson DC. 2005. The extracellular domain of herpes simplex virus gE is indispensable for efficient cell-to-cell spread: evidence for gE/gI receptors. J. Virol. 79:11990–12001 [DOI] [PMC free article] [PubMed] [Google Scholar]
- 37. Roper RL, Wolffe EJ, Weisberg A, Moss B. 1998. The envelope protein encoded by the A33R gene is required for formation of actin-containing microvilli and efficient cell-to-cell spread of vaccinia virus. J. Virol. 72:4192–4204 [DOI] [PMC free article] [PubMed] [Google Scholar]
- 38. Bartosch B, Vitelli A, Granier C, Goujon C, Dubuisson J, Pascale S, Scarselli E, Cortese R, Nicosia A, Cosset FL. 2003. Cell entry of hepatitis C virus requires a set of co-receptors that include the CD81 tetraspanin and the SR-B1 scavenger receptor. J. Biol. Chem. 278:41624–41630 [DOI] [PubMed] [Google Scholar]
- 39. Flint M, von Hahn T, Zhang J, Farquhar M, Jones CT, Balfe P, Rice CM, McKeating JA. 2006. Diverse CD81 proteins support hepatitis C virus infection. J. Virol. 80:11331–11342 [DOI] [PMC free article] [PubMed] [Google Scholar]
- 40. Zhang J, Randall G, Higginbottom A, Monk P, Rice CM, McKeating JA. 2004. CD81 is required for hepatitis C virus glycoprotein-mediated viral infection. J. Virol. 78:1448–1455 [DOI] [PMC free article] [PubMed] [Google Scholar]
- 41. Hsu M, Zhang J, Flint M, Logvinoff C, Cheng-Mayer C, Rice CM, McKeating JA. 2003. Hepatitis C virus glycoproteins mediate pH-dependent cell entry of pseudotyped retroviral particles. Proc. Natl. Acad. Sci. U. S. A. 100:7271–7276 [DOI] [PMC free article] [PubMed] [Google Scholar]
- 42. Meertens L, Bertaux C, Cukierman L, Cormier E, Lavillette D, Cosset FL, Dragic T. 2008. The tight junction proteins claudin-1, -6, and -9 are entry cofactors for hepatitis C virus. J. Virol. 82:3555–3560 [DOI] [PMC free article] [PubMed] [Google Scholar]
- 43. Bertaux C, Dragic T. 2006. Different domains of CD81 mediate distinct stages of hepatitis C virus pseudoparticle entry. J. Virol. 80:4940–4948 [DOI] [PMC free article] [PubMed] [Google Scholar]
- 44. Codran A, Royer C, Jaeck D, Bastien-Valle M, Baumert TF, Kieny MP, Pereira CA, Martin JP. 2006. Entry of hepatitis C virus pseudotypes into primary human hepatocytes by clathrin-dependent endocytosis. J. Gen. Virol. 87:2583–2593 [DOI] [PubMed] [Google Scholar]
- 45. Ito K, Yamaoka Y, Ota H, El-Zimaity H, Graham DY. 2008. Adherence, internalization, and persistence of Helicobacter pylori in hepatocytes. Dig. Dis. Sci. 53:2541–2549 [DOI] [PMC free article] [PubMed] [Google Scholar]
- 46. Ang F, Wong AP, Ng MM, Chu JJ. 2010. Small interference RNA profiling reveals the essential role of human membrane trafficking genes in mediating the infectious entry of dengue virus. Virol. J. 7:24. [DOI] [PMC free article] [PubMed] [Google Scholar]
- 47. Kolesnikova L, Bohil AB, Cheney RE, Becker S. 2007. Budding of Marburgvirus is associated with filopodia. Cell. Microbiol. 9:939–951 [DOI] [PubMed] [Google Scholar]
- 48. Zieve GW, Turnbull D, Mullins JM, McIntosh JR. 1980. Production of large numbers of mitotic mammalian cells by use of the reversible microtubule inhibitor nocodazole. Nocodazole accumulated mitotic cells. Exp. Cell Res. 126:397–405 [DOI] [PubMed] [Google Scholar]
- 49. Whitt MA, Mire CE. 2011. Utilization of fluorescently-labeled tetracysteine-tagged proteins to study virus entry by live cell microscopy. Methods 55:127–136 [DOI] [PubMed] [Google Scholar]
- 50. Counihan NA, Rawlinson SM, Lindenbach BD. 2011. Trafficking of hepatitis C virus core protein during virus particle assembly. PLoS Pathog. 7:e1002302. 10.1371/journal.ppat.1002302 [DOI] [PMC free article] [PubMed] [Google Scholar]
- 51. Owsianka AM, Tarr AW, Keck ZY, Li TK, Witteveldt J, Adair R, Foung SK, Ball JK, Patel AH. 2008. Broadly neutralizing human monoclonal antibodies to the hepatitis C virus E2 glycoprotein. J. Gen. Virol. 89:653–659 [DOI] [PMC free article] [PubMed] [Google Scholar]
- 52. Keck ZY, Xia J, Cai Z, Li TK, Owsianka AM, Patel AH, Luo G, Foung SK. 2007. Immunogenic and functional organization of hepatitis C virus (HCV) glycoprotein E2 on infectious HCV virions. J. Virol. 81:1043–1047 [DOI] [PMC free article] [PubMed] [Google Scholar]
- 53. Wakita T, Pietschmann T, Kato T, Date T, Miyamoto M, Zhao Z, Murthy K, Habermann A, Krausslich HG, Mizokami M, Bartenschlager R, Liang TJ. 2005. Production of infectious hepatitis C virus in tissue culture from a cloned viral genome. Nat. Med. 11:791–796 [DOI] [PMC free article] [PubMed] [Google Scholar]
- 54. Zhong J, Gastaminza P, Cheng G, Kapadia S, Kato T, Burton DR, Wieland SF, Uprichard SL, Wakita T, Chisari FV. 2005. Robust hepatitis C virus infection in vitro. Proc. Natl. Acad. Sci. U. S. A. 102:9294–9299 [DOI] [PMC free article] [PubMed] [Google Scholar]
- 55. Lindenbach BD, Evans MJ, Syder AJ, Wolk B, Tellinghuisen TL, Liu CC, Maruyama T, Hynes RO, Burton DR, McKeating JA, Rice CM. 2005. Complete replication of hepatitis C virus in cell culture. Science 309:623–626 [DOI] [PubMed] [Google Scholar]
- 56. Nakamura T, Nakayama Y, Teramoto H, Nawa K, Ichihara A. 1984. Loss of reciprocal modulations of growth and liver function of hepatoma cells in culture by contact with cells or cell membranes. Proc. Natl. Acad. Sci. U. S. A. 81:6398–6402 [DOI] [PMC free article] [PubMed] [Google Scholar]
- 57. Agnello V, Abel G, Knight GB, Muchmore E. 1998. Detection of widespread hepatocyte infection in chronic hepatitis C. Hepatology 28:573–584 [DOI] [PubMed] [Google Scholar]
- 58. Chang M, Williams O, Mittler J, Quintanilla A, Carithers RL, Jr, Perkins J, Corey L, Gretch DR. 2003. Dynamics of hepatitis C virus replication in human liver. Am. J. Pathol. 163:433–444 [DOI] [PMC free article] [PubMed] [Google Scholar]
- 59. Logvinoff C, Major ME, Oldach D, Heyward S, Talal A, Balfe P, Feinstone SM, Alter H, Rice CM, McKeating JA. 2004. Neutralizing antibody response during acute and chronic hepatitis C virus infection. Proc. Natl. Acad. Sci. U. S. A. 101:10149–10154 [DOI] [PMC free article] [PubMed] [Google Scholar]
- 60. Pal S, Shuhart MC, Thomassen L, Emerson SS, Su T, Feuerborn N, Kae J, Gretch DR. 2006. Intrahepatic hepatitis C virus replication correlates with chronic hepatitis C disease severity in vivo. J. Virol. 80:2280–2290 [DOI] [PMC free article] [PubMed] [Google Scholar]
- 61. Loo YM, Owen DM, Li K, Erickson AK, Johnson CL, Fish PM, Carney DS, Wang T, Ishida H, Yoneyama M, Fujita T, Saito T, Lee WM, Hagedorn CH, Lau DT, Weinman SA, Lemon SM, Gale M., Jr 2006. Viral and therapeutic control of IFN-beta promoter stimulator 1 during hepatitis C virus infection. Proc. Natl. Acad. Sci. U. S. A. 103:6001–6006 [DOI] [PMC free article] [PubMed] [Google Scholar]
- 62. Timpe JM, Stamataki Z, Jennings A, Hu K, Farquhar MJ, Harris HJ, Schwarz A, Desombere I, Roels GL, Balfe P, McKeating JA. 2008. Hepatitis C virus cell-cell transmission in hepatoma cells in the presence of neutralizing antibodies. Hepatology 47:17–24 [DOI] [PubMed] [Google Scholar]
- 63. Catanese MT, Graziani R, von Hahn T, Moreau M, Huby T, Paonessa G, Santini C, Luzzago A, Rice CM, Cortese R, Vitelli A, Nicosia A. 2007. High-avidity monoclonal antibodies against the human scavenger class B type I receptor efficiently block hepatitis C virus infection in the presence of high-density lipoprotein. J. Virol. 81:8063–8071 [DOI] [PMC free article] [PubMed] [Google Scholar]
- 64. Dreux M, Dao Thi VL, Fresquet J, Guérin M, Julia Z, Verney G, Durantel D, Zoulim F, Lavillette D, Cosset F-L, Bartosch B, Evans MJ. 2009. Receptor complementation and mutagenesis reveal SR-BI as an essential HCV entry factor and functionally imply its intra- and extra-cellular domains. PLoS Pathog. 5:e1000310. 10.1371/journal.ppat.1000310 [DOI] [PMC free article] [PubMed] [Google Scholar]
- 65. Koutsoudakis G, Kaul A, Steinmann E, Kallis S, Lohmann V, Pietschmann T, Bartenschlager R. 2006. Characterization of the early steps of hepatitis C virus infection by using luciferase reporter viruses. J. Virol. 80:5308–5320 [DOI] [PMC free article] [PubMed] [Google Scholar]
- 66. Voisset C, Callens N, Blanchard E, Op De Beeck A, Dubuisson J, Vu-Dac N. 2005. High density lipoproteins facilitate hepatitis C virus entry through the scavenger receptor class B type I. J. Biol. Chem. 280:7793–7799 [DOI] [PubMed] [Google Scholar]
- 67. Brimacombe CL, Grove J, Meredith LW, Hu K, Syder AJ, Flores MV, Timpe JM, Krieger SE, Baumert TF, Tellinghuisen TL, Wong-Staal F, Balfe P, McKeating JA. 2011. Neutralizing antibody-resistant hepatitis C virus cell-to-cell transmission. J. Virol. 85:596–605 [DOI] [PMC free article] [PubMed] [Google Scholar]
- 68. Witteveldt J, Evans MJ, Bitzegeio J, Koutsoudakis G, Owsianka AM, Angus AG, Keck ZY, Foung SK, Pietschmann T, Rice CM, Patel AH. 2009. CD81 is dispensable for hepatitis C virus cell-to-cell transmission in hepatoma cells. J. Gen. Virol. 90:48–58 [DOI] [PMC free article] [PubMed] [Google Scholar]
- 69. Ritzenthaler C. 2011. Parallels and distinctions in the direct cell-to-cell spread of the plant and animal viruses. Curr. Opin. Virol. 1:403–409 [DOI] [PubMed] [Google Scholar]
- 70. Kawakami S, Watanabe Y, Beachy RN. 2004. Tobacco mosaic virus infection spreads cell to cell as intact replication complexes. Proc. Natl. Acad. Sci. U. S. A. 101:6291–6296 [DOI] [PMC free article] [PubMed] [Google Scholar]
- 71. Amari K, Lerich A, Schmitt-Keichinger C, Dolja VV, Ritzenthaler C. 2011. Tubule-guided cell-to-cell movement of a plant virus requires class XI myosin motors. PLoS Pathog. 7:e1002327. 10.1371/journal.ppat.1002327 [DOI] [PMC free article] [PubMed] [Google Scholar]
- 72. Avisar D, Prokhnevsky AI, Dolja VV. 2008. Class VIII myosins are required for plasmodesmatal localization of a closterovirus Hsp70 homolog. J. Virol. 82:2836–2843 [DOI] [PMC free article] [PubMed] [Google Scholar]
- 73. Harries PA, Schoelz JE, Nelson RS. 2010. Intracellular transport of viruses and their components: utilizing the cytoskeleton and membrane highways. Mol. Plant Microbe Interact. 23:1381–1393 [DOI] [PubMed] [Google Scholar]
- 74. Coller KE, Berger KL, Heaton NS, Cooper JD, Yoon R, Randall G. 2009. RNA interference and single particle tracking analysis of hepatitis C virus endocytosis. PLoS Pathog. 5:e1000702. 10.1371/journal.ppat.1000702 [DOI] [PMC free article] [PubMed] [Google Scholar]
- 75. Bost AG, Venable D, Liu L, Heinz BA. 2003. Cytoskeletal requirements for hepatitis C virus (HCV) RNA synthesis in the HCV replicon cell culture system. J. Virol. 77:4401–4408 [DOI] [PMC free article] [PubMed] [Google Scholar]
- 76. Berger KL, Cooper JD, Heaton NS, Yoon R, Oakland TE, Jordan TX, Mateu G, Grakoui A, Randall G. 2009. Roles for endocytic trafficking and phosphatidylinositol 4-kinase III alpha in hepatitis C virus replication. Proc. Natl. Acad. Sci. U. S. A. 106:7577–7582 [DOI] [PMC free article] [PubMed] [Google Scholar]
- 77. Roohvand F, Maillard P, Lavergne JP, Boulant S, Walic M, Andreo U, Goueslain L, Helle F, Mallet A, McLauchlan J, Budkowska A. 2009. Initiation of hepatitis C virus infection requires the dynamic microtubule network: role of the viral nucleocapsid protein. J. Biol. Chem. 284:13778–13791 [DOI] [PMC free article] [PubMed] [Google Scholar]
- 78. Wolk B, Buchele B, Moradpour D, Rice CM. 2008. A dynamic view of hepatitis C virus replication complexes. J. Virol. 82:10519–10531 [DOI] [PMC free article] [PubMed] [Google Scholar]
- 79. Shulla A, Randall G. 2012. Hepatitis C virus-host interactions, replication, and viral assembly. Curr. Opin. Virol. 2:725–732 [DOI] [PMC free article] [PubMed] [Google Scholar]
- 80. Popescu CI, Rouille Y, Dubuisson J. 2011. Hepatitis C virus assembly imaging. Viruses 3:2238–2254 [DOI] [PMC free article] [PubMed] [Google Scholar]
Associated Data
This section collects any data citations, data availability statements, or supplementary materials included in this article.