

Abstract
Although hepatocellular carcinoma (HCC) has been subjected to continuous investigation and its symptoms are well known, early-stage diagnosis of this disease remains difficult and the survival rate after diagnosis is typically very low (3–5%). Early and accurate detection of metabolic changes in the sera of patients with liver cirrhosis can help improve the prognosis of HCC and lead to a better understanding of its mechanism at the molecular level, thus providing patients with in-time treatment of the disease. In this study, we compared metabolite levels in sera of 40 HCC patients and 49 cirrhosis patients from Egypt by using ultra-performance liquid chromatography coupled with quadrupole time-of-flight mass spectrometer (UPLC-QTOF MS). Following data preprocessing, the most relevant ions in distinguishing HCC cases from cirrhotic controls are selected by statistical methods. Putative metabolite identifications for these ions are obtained through mass-based database search. The identities of some of the putative identifications are verified by comparing their MS/MS fragmentation patterns and retention times with those from authentic compounds. Finally, the serum samples are reanalyzed for quantitation of selected metabolites along with other metabolites previously selected as candidate biomarkers of HCC. This quantitation was performed using isotope dilution by selected reaction monitoring (SRM) on a triple quadrupole linear ion trap (QqQLIT) coupled to UPLC. Statistical analysis of the UPLC-QTOF data identified 274 monoisotopic ion masses with statistically significant differences in ion intensities between HCC cases and cirrhotic controls. Putative identifications were obtained for 158 ions by mass based search against databases. We verified the identities of selected putative identifications including glycholic acid (GCA), glycodeoxycholic acid (GDCA), 3beta, 6beta-dihydroxy-5beta-cholan-24-oic acid, oleoyl carnitine, and Phe-Phe. SRM-based quantitation confirmed significant differences between HCC and cirrhotic controls in metabolite levels of bile acid metabolites, long chain carnitines and small peptide. Our study provides useful insight into appropriate experimental design and computational methods for serum biomarker discovery using LC-MS/MS based metabolomics. This study has led to the identification of candidate biomarkers with significant changes in metabolite levels between HCC cases and cirrhotic controls. This is the first MS-based metabolic biomarker discovery study on Egyptian subjects that led to the identification of candidate metabolites that discriminate early stage HCC from patients with liver cirrhosis.
Keywords: Hepatocellular carcinoma, liver cirrhosis, metabolic biomarker, cancer biomarker discovery, selected reaction monitoring, isotope dilution, mass spectrometry
1. Introduction
Hepatocellular carcinoma (HCC) is one of the most prevalent human cancers worldwide and has the fourth highest mortality rate. It has become a major health problem especially among African and Asian populations. The increased incidence of HCC in these populations is mainly attributed to chronic hepatitis virus infection or liver cirrhosis and carcinogenic toxins such as aflatoxin. 1. Although HCC has been subjected to continuing investigation and its symptoms are well known, early-stage diagnosis of this disease still remains difficult and the survival rate after diagnosis is very low (3–5%). The current diagnostic tools include alpha-fetoprotein (AFP), liver biopsy, and radiographic imaging. AFP has been widely considered as the only serological marker currently available in clinical practice for diagnosis and therapeutic monitoring. However, AFP is not a sufficiently reliable marker because of its poor sensitivity 2. The greatest burden of HCC and its major causative factors exist in the developing world where many of the sophisticated imaging tools used to compensate for the insufficient performance of AFP are not widely available. In order to improve the diagnosis and prognosis, there is an urgent need to identify additional and reliable markers that can be used for early and accurate detection of HCC 3.
Metabolomics is a rapidly evolving tool to study small molecules (molecular weight <1800Da) that define the metabolic status of a biological system 4, 5. It has been applied extensively to discover biomarkers for disease diagnosis 6 and to better understand the patho-physiology of diseases 7. To achieve appropriate coverage of the metabolome, several analytic platforms with complementary features may be needed. Among them, liquid chromatography–mass spectrometry (LC-MS) is one of the most commonly used analytical tools for metabolomic studies, because it offers good separation and accurate detection of metabolites in complex specimens with high sensitivity and resolution 8, 9. LC-MS has been widely used for both comprehensive metabolomic profiling and targeted quantitation of metabolites. These studies include identification of metabolic markers in patients with HCC through untargeted profiling of serum, plasma, urine and fecal samples 10–16, in which patients with benign liver tumor or healthy subjects are selected as controls. The significant metabolic differences discovered in these studies include bile acid, phospholipids, fatty acids, glycolysis, urea cycle, and methionine metabolism. Current LC-MS based metabolomic studies mostly rely on untargeted profiling of metabolites using accurate mass measurement by mass spectrometers with high resolution such as quadrupole time-of-flight (QTOF), Orbitrap or Fourier-transform ion cyclotron resonance (FT-ICR). However, these can only provide semi-quantitative information on metabolic changes. This is because accurate detection of metabolites and unbiased identification of metabolic features with subtle differences are compromised by various factors such as the diversities in abundance level and chemo-physical properties of metabolites, ion suppression or ion enhancement of matrix effects during ionization, and the variation of sample recovery during metabolic extraction. One way to address these is to follow up the results from untargeted metabolomic study with a targeted quantitation of relevant metabolites using isotope dilution by selected reaction monitoring (SRM). Targeted quantitation is accomplished by using isotope labeled internal standard analogues as spiking reference to correct matrix effects and sample loss variation 8. Also, careful design of the appropriate analytical experiments is needed during untargeted metabolomic profiling to ensure acquisition of high quality LC-MS data that are robust and reproducible, by minimizing variation of MS response, loss of mass accuracy, and inconsistency of retention time 17.
In this study, we analyzed serum samples collected in Egypt from 40 HCC cases and 49 patients with liver cirrhosis. We carefully designed the analytical experiment by including chromatogram quality check, mass accuracy and resolution check, adequate QC runs, system cleanup, and re-equilibrium. Two batches of LC-MS data were acquired using ultra performance liquid chromatography (UPLC) coupled with QTOF MS for semi-quantitative analysis. Following data preprocessing by XCMS, ion annotation is conducted to identify derivative ions such as isotopes, adducts, and in-source fragments. A two-way analysis of variance (ANOVA) model is then used for detection of ions with significant differences in ion intensities between HCC cases and cirrhotic controls, accounting for the batch effect. The ion annotation information is used to obtain a list of significant monoisotopic ion masses. These monoisotopic masses are searched against four databases to obtain putative identifications. A subset of these putative identifications is verified by comparing the MS/MS fragmentation patterns of the analytes with those from authentic compounds. Quantitation of selected metabolic biomarkers is performed using isotope dilution by SRM on a triple quadrupole linear ion trap (QqQLIT) mass spectrometer coupled with UPLC.
2. Study Population
After the study protocol has been approved by Tanta University ethical committee, adult patients with HCC or cirrhosis were prospectively recruited from the outpatient clinics and inpatient wards of the Department of Tropical Medicine and Infectious Diseases at Tanta University Hospital, Tanta, Egypt. All participating patients provided informed consent before taking part in the study. Patients were diagnosed to have cirrhosis on the basis of established clinical, laboratory and/or imaging criteria with ultrasound examination. Cases were suspected to have HCC if they had focal lesion in ultrasound examination and /or elevated AFP above 200 ng/mL, but only diagnosed to have HCC based on well-established diagnostic imaging criteria with spiral CT scanning and /or histopathology examination of liver biopsy. Suspected cases who were not confirmed by CT or biopsy were excluded from both groups of this study. A total of 89 participants were included in this study. The participants consist of 40 HCC cases and 49 patients with liver cirrhosis. The characteristics of the patient population in this study are summarized in Table I. Through peripheral venepuncture single blood sample was drawn into 10 mL BD Vacutainer sterile vacuum tubes without the presence of anticoagulant. The blood was immediately centrifuged at 1000 ×g for 10 min at room temperature. The serum supernatant was carefully collected and centrifuged at 2500 ×g for 10 min at room temperature. After aliquoting, serum was kept frozen at 80 °C until use. Primary tubes and serum aliquots were labeled using anonymous confidential code numbers with no personal identifiers. Identification codes were cross-referenced with clinical information in a pass code protected computer system. Samples were transported in dried ice.
Table I.
Characteristics of the study population.
| HCC (N= 40) | Cirrhosis (N= 49) | p-value | |
|---|---|---|---|
| Age mean(SD) | 53.28 (3.93) | 54.33 (7.32) | 0.3898 |
| Male (%) | 77.5% | 67.3% | 0.2889 |
|
| |||
| Etiology (%) | |||
| HCV Ab(+) | 100% | 100% | 1.0000 |
| HBsAg(+) | 0% | 6% | 0.0832 |
| Smoking | 60% | 53% | 0.5165 |
| Alcoholism | 0% | 0% | 1.0000 |
|
| |||
| MELD | |||
| mean(SD) | 17.71 (7.5) | 21.12 (8.24) | 0.0346 |
| MELD ≤ 10 | 20% | 12% | |
|
| |||
| AFP | |||
| mean(SD) | 932.93 (1317.97) | ||
|
| |||
| Tumor Stage | |||
| T1N0M0 | 72.5% | ||
| T2N0M0 | 15.0% | ||
| T3N0M0 | 5.0% | ||
| Unknown | 7.5% | ||
3. Materials and Methods
Chemicals and reagents
LC check solutions (mixture of dodecanamide; 11-deoxycoricosterone; cortisone; thyroxine; epitestosterone and N-benzoyl-D-phenylalanine), ammonium acetate, glycholic acid (GCA), taurochenodeoxycholic acid (TCDCA), glycodeoxycholic acid (GDCA), glycodeoxycholic-2,2,4,4-d4 acid (D4_GDCA), glycodeoxycholic-2,2,4,4-d4 acid (D4_GCA), Phe-Phe, 2C13_Phe-Phe, 3beta, 6beta-dihydroxy-5beta-cholan-24-oic acid, and oleoyl carnitine were purchased from Sigma-Aldrich (St. Louis, MO). D35_LysoPC18:0 was purchased from Avanti Polar Lipids (Alabaster, AL). D5_TCA was purchased from Toronto Research Chemicals (North York, ON). Acetonitrile (ACN), methanol, isopropanol, and chloroform were from Fisher Scientific (Pittsburg, PA). Metabonomics MS System Test Mix (theophylline, caffeine, hippuric acid, 4-nitrobenzoic acid, nortriptyline HCl) was purchased from Waters (Milford, MA). All other common chemicals of analytic grade were purchased from Sigma-Aldrich.
Sample preparation and UPLC-QTOF data acquisition for semi-quantitative metabolomic analysis
Frozen human serum was thawed at room temperature and 25 μL serum was mixed with 1.5 mL 66% ACN containing two internal standards (debrisquinone 1 μg/mL for positive mode and nitrobenzoic acid 10 μg/mL for negative mode), vortexed and incubated for 10 min on ice. Mixture was then spun at 10,000×g for 10 min at 4°C. Supernatant organic solution was transferred, speed-vacuum dried at room temperature and reconstituted in 50 μL of mobile phase (2% ACN containing 0.1 % formic acid) ready for injection. From each sample, 5 μL was injected onto a reverse-phase 50 × 2.1 mm ACQUITY 1.7-μm C18 column (Waters Corp, Milford, MA) using an ACQUITY UPLC system (Waters) with a gradient mobile phase consisting of 2% ACN in water containing 0.1% formic acid (A) and 2% water in ACN containing 0.1% formic acid (B). Each sample was resolved for 10 min at a flow rate of 0.5 ml/min. The gradient consisted of 100% A for 0.5 min then a ramp of curve 6 to 60% B from 0.5 min to 4.0 min, then a ramp of curve 6 to 100% B from 4.0–8.0 min, a hold at 100% B until 9.0 min, then a ramp of curve 6 to 100% A from 9.0 min to 9.2 min, followed by a hold at 100% A until 10 min. The column eluent was introduced directly into the mass spectrometer by electrospray. Mass spectrometric analysis was performed on a Q-TOF Premier (Waters) operating in both positive and negative modes. The capillary voltage was set to 3.2 kV and 3 kV, and the cone voltage of 30V and 20 V, respectively. The desolvation gas flow was set to 800 liters/h and the temperature was set to 350 °C. The cone gas flow was 25 liters/h, and the source temperature was 120°C. Accurate mass was maintained by introduction of LockSpray interface of sulfadimethoxine (311.0814 [M+H] + or 309.0658 [M−H]−) at a concentration of 250 pg/μL in 50% aqueous ACN and a rate of 150 μL/min. UPLC-QTOF data were acquired in centroid mode from 50 to 850 mass-to-charge ratio (m/z) in MS scanning using the MassLynx software (Waters).
Sample preparation and UPLC-QqQLIT data acquisition for absolute quantitation
Frozen human serum was thawed at room temperature. 50 μL serum was spiked with 1 pmol of isotope labeled internal standards, extracted by 1 mL chilled methanol, vortexed and incubated for 10 min on ice. Mixture was then spun at 10,000 g for 10 min at 4°C. Supernatant organic solution was transferred, dried down and concentrated by speed-vacuum at room temperature and reconstituted in 50 μL of mobile phase (40% ACN solution containing 10 mM NH4OAC and 0.1% FA) ready for injection. From each sample, 10 μL was injected onto a reverse-phase 50 × 2.1 mm ACQUITY 1.7-μm CSH C18 column (Waters) using an ACQUITY UPLC system (Waters) with a gradient mobile phase consisting of 40% ACN solution containing 10 mM NH4OAC and 0.1% FA (A) and 10% ACN in isopropanol containing 0.1 % FA and 10 mM NH4OAC (B). The whole run lasted 11 minutes. The gradient consisted of 100% A for 1.0 min at flowrate of 0.25 mL/min then a ramp to 50% B from 1.0 min to 5.0 min at flowrate of 0.25 mL/min, then ramp to flowrate of 0.4 mL/min and 100% B from 5.1–9.1 min, return to 0.25 mL/min flowrate and 100% A from at 9.2 min, followed by a hold at 100% A until 11 min. The column temperature was set to 50 °C. UPLC-QqQLIT data were collected in the SRM mode on QTRAP 4000 (AB Sciex, Foster City, CA) operating in the positive mode with a capillary voltage of 4500 V and source temperature of 450 °C. The curtain gas flow was set to 20, Sheath gas flow GS1 was set to 40.00, sheath gas GS2 was set to 20.00 and exit potential was 10 V.
UPLC-QTOF datasets, data analysis methods, and software tools
We generated UPLC-QTOF MS data from sera of 40 HCC cases and 49 patients with cirrhosis in two batches (Batch 1 and Batch 2) run consecutively over a period of several days. Batch 1 consists of a randomly selected set of 20 HCC cases and 25 cirrhotic controls that were analyzed in two experiments (Exp. 1F and Exp. 1R). Following the analysis of the first experiment (Exp. 1F), the experiment is repeated by reversing the order of the samples (Exp. 1R). Similarly, Batch 2 consists of the remaining 20 HCC cases and 24 cirrhotic controls (different subjects from Batch1) run into two experiments, Exp. 2F (forward order) and Exp. 2R (reverse order). The data in both batches were acquired in both positive and negative ionization modes. Therefore a total of eight UPLC-QTOF MS datasets were acquired. Together with these serum samples, in each batch, we analyzed aliquots of serum pooled from a subset of the HCC cases and patients with cirrhosis for quality assessment purpose. The raw data were converted into Network Common Data Form (NetCDF) format using the MassLynx software (Waters).
We used the XCMS package (Scripps Center for Metabolomics, La Jolla, CA) to preprocess each of the eight UPLC-QTOF MS datasets separately. The first step in XCMS is to detect the peaks. The peak detection algorithm first cuts the UPLC-QTOF data into slices, a fraction of a mass unit wide, and then applies a model peak matched filter on those individual slices over the chromatographic time domain. After detecting peaks in individual samples, the peaks are matched across samples to allow calculation of retention time (RT) deviations and relative ion intensity comparison. This is accomplished using a grouping method that uses kernel density estimation to group peaks in the mass domain. These groups are then used to identify and correct drifts in RT from run to run.
Following data preprocessing, ion annotation is conducted to identify derivative ions such as isotopes, adducts, and in-source fragments. This helps group ions that are likely to originate from the same metabolite on the basis of their monoisotopic masses and elution profiles. We used the R-package CAMERA 18 for ion annotation. CAMERA groups together the detected peaks that share similar retention times using a sliding RT window. Within each group, the peaks are clustered into smaller groups based on the correlation between their extracted ion chromatograms (EICs). The m/z difference between each peak pair within a group is calculated and compared to known m/z relationships between different ion formations. The two ions are considered to come from the same compound if their m/z difference can be explained by one of the known m/z relationships.
The ion annotation information is used following difference detection to obtain a summarized list of monoisotopic ion masses (Figure 1). For difference detection, in-house developed MATLAB (Natick, MA) and R scripts are used on the basis of ANOVA statistical models. The ion intensities were first log-transformed to satisfy the normality assumption underlying ANOVA models. Based on the experimental design we took advantage of two-way ANOVA models to combine datasets between batches to increase statistical power. Batch 1 represents Exp. 1F and Exp. 1R while Batch 2 refers to Exp. 2F and Exp. 2R. Since the experiments within each batch consist of the same biological samples run in forward and reverse orders, we considered combinations of datasets from different batches only in order to ensure independence across samples. Thus, we used the two-way ANOVA model below to analyze four combinations, (i.e., Exp. 1F & Exp. 2F, Exp. 1F & Exp. 2R, Exp. 1R & Exp. 2F, and Exp. 1R & Exp. 2R):
where μ, α, β, γ, and ε represent global mean, group effect, batch effect, group-batch interaction effect, and random error, respectively, for peak i in group j from batch k of sample l. We selected those with significant group effect (qα < 0.1). The q-values were estimated based on Storey’s pFDR method 19. We applied this approach for all four pair-wise combinations in both positive and negative modes, thus a total of eight combinations were considered.
Figure 1.
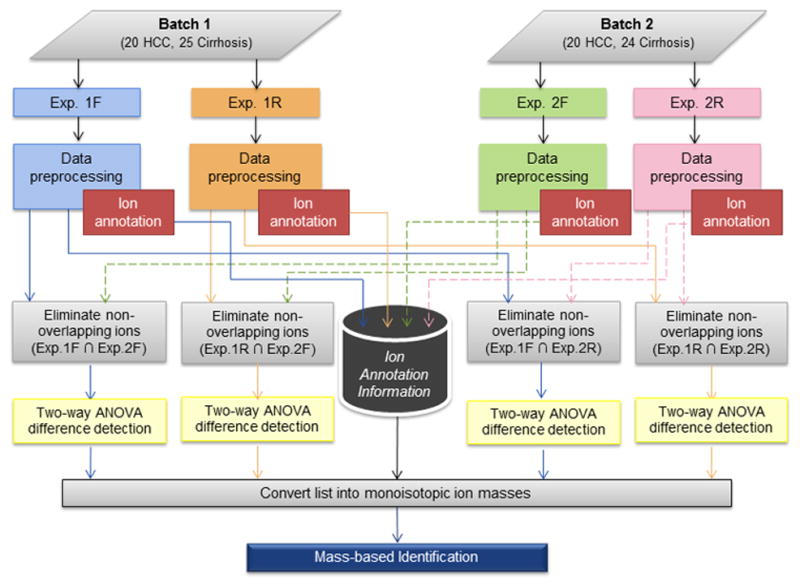
Workflow for analysis of UPLC-QTOF MS data from two batches of samples in four separate experiments.
A list of monoisotopic ion masses was obtained for the ions selected by the two-way ANOVA model. Ion annotation information was used to convert the m/z values of annotated isotopes/adducts/neutral-loss fragments ions to the corresponding neutral mono-isotopic masses before searching them against the databases. Putative identifications of the monoisotopic masses were found using MetaboSearch 20 to search against four databases: the Human Metabolite DataBase (HMDB) 21, Metlin 22, Madison Metabolomics Consortium Database (MMCD) 23, and LIPID MAPS 24. The mass tolerance in MetaboSearch was set to 10 ppm. Identities of some of the putative metabolite identifications were verified by comparing their MS/MS fragmentation patterns and RT with those of authentic standard compounds. Quantitation of metabolite candidates was performed using isotope dilution technique by UPLC-SRM-MS/MS analysis on the QTRAP 4000 instrument. Because of the high physiochemical similarities between the labeled internal standard and the analyte, degradation during sample preparation, variations in instrumental response, and ion suppression effects in LC–ESI-MS can be compensated. Quantitation of metabolites was achieved by correlating their ratio of MS signals detected by SRM in the calibration curves that we constructed by relating the varying amounts of each analyte to their relative response factors (RRFs) as determined by the ratio of the peak area of the analyte to that of the corresponding isotope-labeled internal standard.
3. Results
In this section, we present the results obtained in each step of our biomarker discovery pipeline that included untargeted metabolomics by UPLC-QTOF and quantitation of targeted metabolites by triple quadrupole mass spectrometry. The raw data from this study are deposited in MetaboLights (Accession # MTBLS19) along with all peaks detected, fold change values, statistical analysis results, and a list of verified metabolites.
Data preprocessing
We processed each of the eight UPLC-QTOF MS datasets (Exp. 1F, Exp. 1R, Exp. 2F, and Exp. 2R) separately. Table II presents the number of peaks detected by XCMS in each dataset. Four pair-wise comparisons were performed in each mode to select a set of common ions between a pair of two experiments involving independent samples. The pair-wise comparisons were done on four sets of data obtained by combining the independent samples from Batch 1 and Batch 2: (i) Exp. 1F and Exp. 2F, (ii) Exp. 1F and Exp. 2R, (iii) Exp. 1R and Exp. 2F, and (iv) Exp. 1R and Exp. 2R. We excluded pair-wise comparisons that would combine measurements from the same sample, that is, the combinations Exp.1F & Exp.1R and Exp.2F & Exp.2R were not considered. In each pair-wise comparison, we only considered those ions that are present in both experiments.
Table II.
Number of ions detected in each of the four experiments and those selected by statistical analysis.
| Mode | Exp. | # of ions detected | Combined pairs | # of ions used for pair-wise combinations | # of ions selected (group effect qα < 0.1) |
|---|---|---|---|---|---|
| Positive | Exp. 1F | 1526 | Exp. 1F & Exp. 2F | 825 | 204 |
| Exp. 1F & Exp. 2R | 796 | 60 | |||
| Exp. 1R | 1461 | Exp. 1R & Exp. 2F | 916 | 161 | |
| Exp. 1R & Exp. 2R | 909 | 106 | |||
| Exp. 2F | 1542 | - | - | - | |
| Exp. 2R | 1455 | - | - | - | |
|
| |||||
| Negative | Exp. 1F | 883 | Exp. 1F & Exp. 2F | 635 | 100 |
| Exp. 1F & Exp. 2R | 592 | 64 | |||
| Exp. 1R | 827 | Exp. 1R & Exp. 2F | 559 | 52 | |
| Exp. 1R & Exp. 2R | 544 | 40 | |||
| Exp. 2F | 825 | - | - | - | |
| Exp. 2R | 760 | - | - | - | |
Difference detection
Table II shows the number of peaks detected in each of the eight datasets as well as the peaks with significant group effect (qα < 0.1) selected by the two-way ANOVA model. Table III summarizes the number of ions selected in each of the pair-wise combinations. Also, the table presents the total number of unique ions found in the positive and negative modes after combining the results from the four two-way ANOVA models based on monoisotopic ion masses derived by ion annotation.
Table III.
Number of significant ions in each pair-wise comparison and the total number of monoisotopic ion masses obtained by combining the results from the four pair-wise comparisons. The numbers in parentheses show the number of monoisotopic ion masses with putative identifications.
| Mode | Exp.1F & Exp.2F | Exp.1F & Exp.2R | Exp.1R & Exp.2F | Exp.1R & Exp.2R | Monoisotopic ion masses |
|---|---|---|---|---|---|
| Positive | 204 | 60 | 161 | 106 | 195 (104) |
| Negative | 100 | 64 | 52 | 40 | 79 (54) |
| Total | 274 (158) |
Metabolite identification and verification
We found putative identifications for 158 monoisotopic ion masses (positive and negative mode ions combined) by searching against mass-based databases (Table III). Table IV presents 34 candidates manually picked from these monoisotopic ion masses on the basis of their putative identifications, significant group effect between HCC and cirrhosis based on two-way ANOVA model, and the variability of the corresponding peaks in the QC runs of the pooled sample. A supplementary table presents the fold changes (HCC vs. cirrhosis) for these candidates in the pair-wise experiment combinations in which they were found to be statistically significant. To assess the measurement variability of these candidates, we extracted the corresponding peaks in the QC runs of the pooled sample. For each of these candidates, the average and standard deviation of the QC values adjusted for batch effect are presented in the supplementary table. From the 34 candidates, we verified the identities of 15 ions including GCA, GDCA, GCDCA, Phe-Phe, Oleyol carnitine, 3beta, 6beta-dihydroxy-5beta-cholan-24-oic acid, and in-source fragments of GCA, GDCA, and GCDCA. This was accomplished by acquiring MS/MS spectra of these ions from a serum sample and comparing these spectra with those from authentic compounds. Figure 2 depicts the fragmentation patterns for bile acid metabolite GDCA, Phe-Phe, oleyol carnitine, and 3beta, 6beta-dihydroxy-5beta-cholan-24-oic acid.
Table IV.
Candidate metabolites manually picked from 158 significant monoisotopic ion masses with putative identifications.
| Metabolite ID | Biological Pathway | m/z (+/−) | RT |
|
q-values of group effects in the two-way ANOVA model | |||
|---|---|---|---|---|---|---|---|---|
| HCC vs. Cirrhosis | Exp.1F& Exp.2F | Exp.1F& Exp.2R | Exp.1R& Exp.2F | Exp.1R& Exp.2R | ||||
| Verified Metabolites | ||||||||
|
| ||||||||
| Phe-Phe | Peptide | (−) 311.1 | 174.5 | ↑ | - | - | 0.0859 | - |
| 3beta, 6beta -dihydroxy-5beta-cholan-24-oic acid | Cholesterol | (−) 391.3 | 286.7 | ↓ | 0.0001 | 0.0002 | 0.0001 | 0.0002 |
| Fragment of GDCA [-2H2O] | Cholesterol | (+) 414.3 | 256.7 | ↓ | 0.0013 | 0.0027 | 0.0021 | 0.0030 |
| Fragment of GDCA [-H2O | Cholesterol | (+) 432.3 | 256.7 | ↓ | 0.0010 | 0.0019 | 0.0018 | 0.0023 |
| Fragment of GCDCA [-2H2O] | Cholesterol | (+) 414.3 | 287.7 | ↓ | 0.0147 | 0.0286 | 0.0201 | 0.0246 |
| Fragment of GCDCA [-H2O] | Cholesterol | (+) 432.3 | 287.7 | ↓ | 0.0194 | 0.0350 | 0.0189 | 0.0246 |
| Oleoylcarnitine | Carnitine | (+) 426.3 | 374.6 | ↓ | - | - | 0.0019 | 0.0031 |
| GDCA | Cholesterol | (−) 448.3 | 256.6 | ↓ | 0.0011 | 0.0022 | 0.0013 | 0.0039 |
| [Na++GDCA] | Cholesterol | (+) 472.3 | 256.6 | ↓ | 0.0008 | 0.0014 | 0.0013 | 0.0016 |
| Fragment of GCA [-2H2O] | Cholesterol | (+) 430.3 | 257.8 | ↓ | 0.0658 | - | 0.0902 | - |
| Fragment of GCA [-H2O] | Cholesterol | (+) 448.3 | 257.8 | ↓ | 0.0658 | - | 0.0896 | - |
| GCA | Cholesterol | (+) 466.3 | 257.8 | ↓ | 0.0658 | - | 0.0938 | - |
| GDCA | Cholesterol | (+) 450.3 | 256.8 | ↓ | 0.0021 | 0.0052 | 0.0018 | 0.0030 |
| [Na++GCDCA] | Cholesterol | (+) 472.3 | 287.7 | ↓ | 0.0081 | 0.0230 | 0.0166 | 0.0252 |
| GCDCA | Cholesterol | (+) 450.3 | 287.7 | ↓ | 0.0147 | 0.0334 | 0.0219 | 0.0267 |
|
| ||||||||
| Unverified Metabolites | ||||||||
| 3-ganidinopropionicacid | Carboxylic acid | (+) 132.1 | 53.0 | ↑ | 0.0599 | - | 0.0938 | - |
| 10-hydroxy-2E;8E- decadiene-4,6-diynoic acid | Fatty acid | (+) 181.1 | 262.7 | ↑ | 0.0346 | 0.0835 | 0.0689 | 0.0900 |
| Phenylmethyl methyl ketone | Ketone | (+) 135.1 | 198.8 | ↓ | 0.0200 | 0.0924 | 0.0333 | 0.0642 |
| L-N2-(2-arboxyethyl) arginine | Peptide | (+) 247.1 | 256.6 | ↓ | - | - | 0.0018 | 0.0023 |
| Octadecadienal | Aldehyde | (+) 265.3 | 428.7 | ↓ | 0.0419 | - | 0.0457 | 0.0751 |
| Linoelaidic Acid/ otadecadienoic acid | Fatty acid | (+) 281.3 | 446.3 | ↓ | 0.0658 | - | - | - |
| Oleamide | Fatty acid | (+) 282.3 | 429.4 | ↓ | 0.0503 | - | 0.0743 | - |
| O-octanoyl-R-carnitine | Carnitine | (+) 288.2 | 307.3 | ↓ | - | - | 0.0051 | - |
| n-tosyl-l-lysinyl methyl ketone | Ketone | (+) 299.1 | 445.3 | ↓ | 0.0490 | - | 0.0817 | - |
| Decanoyl-L-carnitine | Carnitine | (+) 316.3 | 342.6 | ↓ | - | - | 0.0599 | - |
| Tetracosahexaenoic acid | Fatty acid | (+) 357.3 | 296.8 | ↓ | 0.0004 | 0.0002 | 0.0002 | 0.0001 |
| Palmitoyl carnitine | Carnitine | (+) 400.3 | 368.9 | ↓ | - | - | 0.0074 | 0.0167 |
| Linoelaidyl carnitine | Carnitine | (+) 424.3 | 358.7 | ↓ | - | - | 0.0034 | 0.0081 |
| PC(O-16:0/0:0) | Phospholipids | (+) 482.4 | 385.2 | ↓ | 0.0346 | - | 0.0938 | - |
| LysoPC(20:1) | Phospholipids | (+) 550.4 | 412.8 | ↓ | 0.0679 | - | 0.0473 | 0.0822 |
| CerP(d18:1/12:0) | Phospholipids | (+) 562.4 | 442.2 | ↓ | 0.0683 | - | - | - |
| LysoPC(20:4) | Phospholipids | (+) 544.3 | 464.2 | ↓ | - | 0.0350 | - | 0.0434 |
| 4E;15Z-Bilirubin IXa | Porphyrins | (+) 585.3 | 457.0 | ↓ | 0.0597 | - | 0.0942 | - |
| PE(20:4/18:1) | Phospholipids | (+) 766.5 | 395.5 | ↓ | 0.0980 | - | 0.0305 | 0.0275 |
| L-alanine/Beta- leucine/T-butyl glycine | Peptide | (−) 131.1 | 154.5 | ↓ | 0.0317 | 0.0334 | 0.0315 | 0.0506 |
| Hydroxypalmiticacid | Fatty acid | (−) 271.2 | 406.1 | ↓ | 0.0410 | 0.0813 | - | - |
| 3-hydroxy-eicosanoic acid | Fatty acid | (−) 327.3 | 443.4 | ↓ | 0.0032 | 0.0084 | - | - |
| 3 alpha,7beta-dihydroxy-5 beta-cholest-24-en-26- oic acid | Cholesterol | (−) 431.3 | 411.9 | ↓ | 0.0806 | - | - | - |
| TCDCA | Cholesterol | (−) 498.3 | 233.5 | ↓ | 0.0027 | 0.0023 | 0.0036 | 0.0044 |
| 15,16-dihydrobiliverdin | Porphyrins | (−) 581.2 | 445.3 | ↓ | 0.0595 | 0.0916 | - | - |
Note: An upward arrow (↑) indicates that HCC is up-regulated vs. cirrhosis, while a downward arrow (↓) indicates down-regulation. q-values are left blank (−) for those that did not reach the desired statistical significance level (qα < 0.1).
Figure 2.

Verification of metabolite GDCA (A1 and A2), Phe-Phe (B1and B2), Oleyol carnitine (C1 and C2), and 3beta, 6beta-dihydroxy-5beta-cholan-24-oic acid (D1 and D2). MS/MS spectrum of an authentic compound and MS/MS spectrum obtained from a serum sample are presented for each of the four metabolites.
Metabolite quantitation
Following ID verification, candidate metabolites were quantified using isotope dilution by UPLC-SRM-MS/MS, where a stable isotope analogue of the analyte compound is used as an internal standard. The quantitation was done on all 89 serum samples by targeting seven metabolites identified by our untargeted metabolomic study, of which three metabolites have been reported previously in HCC biomarker discovery studies 10,11, 14,15,25. For absolute quantification of Phe-Phe, 3beta, 6beta-dihydroxy-5beta-cholan-24-oic acid, GCA, GDCA, TCDCA, oleoyl carnitine, and linoelaidyl carnitine, we spiked the serum samples with the following internal standards: 2C13_Phe-Phe, D4_GCA, D4_GDCA, D5_TCA, and D35_LysoPC 18:0. Two SRM transitions were selected for each compound for both quantitation and ID confirmation. Figure 3 presents dot plots of the metabolite levels measured by SRM in 40 HCC cases and 49 cirrhotic controls. The HCC cases are stratified by stage in two groups. The first group consists of 29 stage I cases. The second group has 8 cases of both stages II & III combined. For each dot plot in the figure, the statitical significance of the difference beween each group versus cirrhosis is presented by the corresponding p-values.
Figure 3.

Quantitation of seven candidate metabolites in sera of 40 HCC cases (29 stage I and 8 stage II & III) and 49 cirrhotic controls.
4. Discussion
We analyzed serum samples from 40 HCC cases and 49 patients with cirrhosis using UPLC-QTOF-MS under positive and negative detection modes. Prior to data acquisition, the analytical platform of LC was first checked on chromatogram quality in terms of peak resolution and peak shape using LC checking solution, 17 which contains the mixture of compounds with diverse chromatographic retention behavior, followed by MS test using mixture of metabolites to ensure the mass accuracy (less than 5ppm) and mass resolution (more than 10,000 FWHM). The mobile phase gradient was also optimized to avoid sample carryover and column memory effect while adequate numbers of QC samples were injected before and in the middle of analysis, both of which assure the system reproducibility of retention time and MS signal. The LC-MS data were first preprocessed to detect peaks, match the peaks, and correct RT drifts. The most relevant ions in distinguishing HCC cases from cirrhosis were selected by using a two-way ANOVA model that combines datasets from different batches involving independent samples to gain more statistical power. We considered two-way repeated measures ANOVA models to combine the within-batch datasets. However, the large variability between the forward and reverse experiments often obscured the group effect, resulting in a loss of statistical power. Several candidate metabolites that were selected by the two-way ANOVA models, but were missed by the two-way repeated measures ANOVA model, were confirmed by SRM quantitation, providing evidence that our choice of statistical method was appropriate.
Putative identifications for the selected ions were obtained by searching the selected significant monoisotopic ion masses against mass-based databases. We observed that metabolites with significant and consistent changes between HCC cases and cirrhosis are primarily involved in bile acid biosynthesis, long chain carnitine and small peptide metabolism. In previous studies, abnormal levels of bile acid have been reported in patients with liver cirrhosis and hepatitis 12, 14, 15. Bile acids of GCDCA (or GDCA), GCA, TCA, CDCA in serum of patients with hepatitis B have been reported to be up regulated compared to healthy controls 14. Those bile acids metabolites in HCC, on the other hand, showed down regulation compared to liver cirrhosis 15. Our findings shown in Table IV also indicate the down-regulation of GCA, GDCA, GCDCA, and their in-source fragments in HCC cases compared to patients with cirrhosis. Conjugated bile acids and their sulfation product enable the absorption of lipids, cholesterol and fat-soluble vitamin and are reported to play a key role in the detoxification of endogenous and exogenous lipophilic compounds 26. Previous results indicate that bile acids as metabolite biomarkers for liver injury might play more important roles in the metabolism of liver cirrhosis 15. Bile acids are also important signaling molecules that induce energy consumption so that regulated energy homeostasis occurs by promoting the intracellular thyroid hormone activation 27. Dysfunction of bile acid biosynthesis was also reported to be associated with liver cancer progression and development 15, 28.
We observed down regulation of long chain carnitine, oleoyl carnitine, palmitoyl carnitine, and linoelaidyl carnitine in HCC patients compared with cirrhotic controls. As a trimethylated amino acid, carnitine has functioned to reduce the availability of lipid peroxidation by transporting fatty acids into the mitochondria for beta-oxidation to generate adenosine triphosphate (ATP) energy. It has been reported to have reduced expression in individuals on a strict vegetarian diet 29. Its metabolism could be disturbed by a variety of mechanisms in patients with chronic liver disease since the last step of carnitine biosynthesis, hydroxylation of butyrobetaine is located almost exclusively in the liver, which decreases its expression 30. Also, it is speculated that deteriorated liver function could cause reduced energy production through decreased amino acid synthesis and carnitine deficiency. This is because carnitine is synthesized endogenously from the essential amino acids 31. Recent publication by Zhou et al discussed the differential metabolism of carnitines in serum and urine of patients with HCC and cirrhosis, and concluded that depending on the cause and the progression of liver damage, the acylcarnitines with short chain and long chain could show reverse accumulation in cirrhosis and HCC 32. This matches our finding of the down regulation of oleoyl carnitine in HCC and supports the hypothesis that cancer cell changes energy metabolism by promoting glycolysis and suppressing the TCA cycle, in which the relative accumulation of C2-acylcarnitine and other medium and short-chain acylcarnitines would be detected in HCC compared with cirrhosis. On the other hand such accumulation may inhibit the formation of long-chain acyl-CoA, which causes a relatively smaller accumulation of long-chain acylcarnitines in HCC compared with cirrhosis. Moreover, these glycolytic intermediates could facilitate the proliferation of cancer cells 33.
It is known that long-chain acylcarnitines play an important role in free fatty acid (FFA) oxidation responsible for the transportation of acyl-coenzyme A (CoA) into mitochondria. Recent study on fatty acids metabolism in HCC revealed that FFAs accumulated progressively from controls to cirrhosis and HCC with a slight difference between cirrhosis and HCC 33. Table IV shows down-regulation of fatty acid of tetracosahexaenoic acid and 3-hydroxy-eicosanoic acid in HCC cases compared to cirrhotic controls. Also, we observe abnormal regulation of small peptides in sera of HCC compared with cirrhosis (shown in Table IV), e.g. down regulation of L-alanine (Beta-leucine/T-butyl glycine) and L-N2-(2-arboxyethyl) arginine, and up regulation of Phe-Phe.
Phospholipid metabolites have been reported previously as candidate markers for HCC 16,25. Our study also found significant differential expression of phospholipid metabolites by untargeted metabolomic study, such as LysoPC(20:4) and LysoPC(20:1), and CerP(d18:1/12:0) and PE(20:4/18:1). It is known that LPC and LPE regulate a variety of biological processes including cell proliferation, tumor cell invasiveness, and inflammation. The enzyme of PEN-methyltransferase 2 (PEMT2) plays the role in balancing phospholipids that constitute cellular membrane by catalyzing the conversion of PE to PC in the liver. The abnormal expression of PEMT2 mRNA in HCC has been reported as the possible cause of the accumulation of PE or LPE 11, 34.
The results of our targeted quantitation by SRM on seven metabolites confirm the discoveries made in untargeted metabolomic studies. As shown in Figure 3, we observed statistically significant (p<0.05) changes for all seven metabolites between stage II & III cases versus cirrhotic controls. Also, a consistent pattern is observed in metabolite levels in the progression of the disease from cirrhosis to early stage and to late stage, indicating metabolic deregulation during the process of HCC tumorigenesis. Although the changes in metabolite levels between early stage HCC cases and cirrhotic controls are not statistically significant for GCA and TCDCA, we observed consistent patterns and statistically significant changes for the remaining five candidates between cirrhosis, stage I cases, and stage II & III cases. This indicates the potential applicability of the metabolic perturbations of these candidates not only as early diagnostic biomarkers of HCC but also to monitor the progression of cirrhosis to early stage of HCC and to late stage HCC.
5. Conclusion
In this study, we characterized the metabolic differences in sera between HCC cases and patients with liver cirrhosis using serum samples collected in Egypt. First, we used the UPLC-MS/MS for untargeted profiling of metabolites. The most relevant ions in distinguishing HCC cases from cirrhosis were selected, annotated and identified by searching the monoisotopic ion masses against mass-based databases. Candidate metabolite markers with significant and consistent changes between HCC cases and cirrhosis identified in this study include: (1) Bile acid related and liver-specific metabolites down-regulated in HCC vs cirrhosis; (2) long chain carnitine and free fatty acid metabolites such as oleoyl carnitine and tetracosahexaenoic acid; (3) small peptides such as Phe-Phe and L-N2-(2-arboxyethyl) arginine. Second, we selected seven candidates for targeted quantitation by SRM. By SRM method, we showed that Phe-Phe is up regulated, while bile acid metabolites of GDCA, 3beta, 6beta-dihydroxy-5beta-cholan-24-oic acid, GCA, TCDCA and long carnitines of oleoyl carnitine and linoelaidyl carnitine are down regulated in stage II & III HCC cases vs. patients with liver cirrhosis. The majority of these metabolites have been shown to not only discriminate early stage HCC from cirrhosis but also maintain a correlation with the progression of liver disease, from cirrhosis to HCC stage I to stage II & III. Thus, following appropriate clinical validation, the metabolic perturbations of these candidates can be used for early detection of HCC and to monitor the progression of cirrhosis to HCC. Also, they can be utilized to gain useful insights into metabolic deregulations contributing to the development of liver diseases, or the mechanism of tumorigenesis in HCC. Future studies will include investigating these candidate biomarkers on a larger population that allows stratification of the subjects on different stages of HCC (stage I–IV) to evaluate if the observed metabolic changes can be reliably used for early detection of HCC in high risk population of cirrhotic patients. In addition, we will evaluate the potential applicability of these candidate biomarkers in distinguishing healthy individuals from patients with cirrhosis or HCC cases. This type of investigation is useful to identify disease progression markers from healthy to cirrhosis then to HCC.
Supplementary Material
Supplementary Table: Statistical significance (q-values) of selected ions, their corresponding fold changes (HCC vs. cirrhosis), and QC values.
Acknowledgments
This work was supported by the National Institutes of Health (NIH) Grant R21CA153176 awarded to HWR. The UPLC-QTOF MS data presented in the manuscript were generated through the Proteomics and Metabolomics Shared Resource at the Lombardi Comprehensive Cancer Center, supported by NIH/NCI grant P30-CA051008.
Footnotes
Supporting Information Available: This material is available free of charge via the Internet at http://pubs.acs.org.
References
- 1.Reuben A. The crab, the turkey and a malignant tale from the year of the rooster. Hepatology. 2005;41 (4):944–950. doi: 10.1002/hep.20674. [DOI] [PubMed] [Google Scholar]
- 2.Taketa K. α-fetoprotein: Reevaluation in hepatology. Hepatology. 1990;12 (6):1420–1432. doi: 10.1002/hep.1840120625. [DOI] [PubMed] [Google Scholar]
- 3.Soliman H, HNNKMAAE-D The role of chemokine CC ligand 20 in patients with liver cirrhosis and hepatocellular carcinoma. Int J Biol Markers. 2012 doi: 10.5301/JBM.2012.9097. [DOI] [PubMed] [Google Scholar]
- 4.Fiehn O. Metabolomics – the link between genotypes and phenotypes. Plant Molecular Biology. 2002;48 (1):155–171. [PubMed] [Google Scholar]
- 5.Nicholson JK, Lindon JC, Holmes E. ‘Metabonomics’: understanding the metabolic responses of living systems to pathophysiological stimuli via multivariate statistical analysis of biological NMR spectroscopic data. Xenobiotica. 1999;29 (11):1181–1189. doi: 10.1080/004982599238047. [DOI] [PubMed] [Google Scholar]
- 6.Madsen R, Lundstedt T, Trygg J. Chemometrics in metabolomics—A review in human disease diagnosis. Analytica Chimica Acta. 2010;659 (1–2):23–33. doi: 10.1016/j.aca.2009.11.042. [DOI] [PubMed] [Google Scholar]
- 7.Li M, Wang B, Zhang M, Rantalainen M, Wang S, Zhou H, Zhang Y, Shen J, Pang X, Zhang M, Wei H, Chen Y, Lu H, Zuo J, Su M, Qiu Y, Jia W, Xiao C, Smith LM, Yang S, Holmes E, Tang H, Zhao G, Nicholson JK, Li L, Zhao L. Symbiotic gut microbes modulate human metabolic phenotypes. Proceedings of the National Academy of Sciences. 2008;105 (6):2117–2122. doi: 10.1073/pnas.0712038105. [DOI] [PMC free article] [PubMed] [Google Scholar]
- 8.Xiao JF, Zhou B, Ressom HW. Metabolite identification and quantitation in LC-MS/MS-based metabolomics. TrAC Trends in Analytical Chemistry. 2012;32 (0):1–14. doi: 10.1016/j.trac.2011.08.009. [DOI] [PMC free article] [PubMed] [Google Scholar]
- 9.Zhou B, Xiao JF, Tuli L, Ressom HW. LC-MS-based metabolomics. Mol BioSyst. 2011;8(2) doi: 10.1039/c1mb05350g. [DOI] [PMC free article] [PubMed] [Google Scholar]
- 10.Wang B, Chen D, Chen Y, Hu Z, Cao M, Xie Q, Chen Y, Xu J, Zheng S, Li L. Metabonomic Profiles Discriminate Hepatocellular Carcinoma from Liver Cirrhosis by Ultraperformance Liquid Chromatography-Mass Spectrometry. J Proteome Res. 2012;11 (2):1217–1227. doi: 10.1021/pr2009252. [DOI] [PubMed] [Google Scholar]
- 11.Tan Y, Yin P, Tang L, Xing W, Huang Q, Cao D, Zhao X, Wang W, Lu X, Xu Z, Wang H, Xu G. Metabolomics Study of Stepwise Hepatocarcinogenesis From the Model Rats to Patients: Potential Biomarkers Effective for Small Hepatocellular Carcinoma Diagnosis. Molecular & Cellular Proteomics. 2012;11(2) doi: 10.1074/mcp.M111.010694. [DOI] [PMC free article] [PubMed] [Google Scholar]
- 12.Chen T, Xie G, Wang X, Fan J, Qiu Y, Zheng X, Qi X, Cao Y, Su M, Wang X, Xu LX, Yen Y, Liu P, Jia W. Serum and urine metabolite profiling reveals potential biomarkers of human hepatocellular carcinoma. Molecular & Cellular Proteomics. 2011 doi: 10.1074/mcp.M110.004945. [DOI] [PMC free article] [PubMed] [Google Scholar]
- 13.Chen J, Wang W, Lv S, Yin P, Zhao X, Lu X, Zhang F, Xu G. Metabonomics study of liver cancer based on ultra performance liquid chromatography coupled to mass spectrometry with HILIC and RPLC separations. Analytica Chimica Acta. 2009;650 (1):3–9. doi: 10.1016/j.aca.2009.03.039. [DOI] [PubMed] [Google Scholar]
- 14.Yang J, Zhao X, Liu X, Wang C, Gao P, Wang J, Li L, Gu J, Yang S, Xu G. High Performance Liquid Chromatography Mass Spectrometry for Metabonomics:Potential Biomarkers for Acute Deterioration of Liver Function in Chronic Hepatitis B. J Proteome Res. 2006;5 (3):554–561. doi: 10.1021/pr050364w. [DOI] [PubMed] [Google Scholar]
- 15.Yin P, Wan D, Zhao C, Chen J, Zhao X, Wang W, Lu X, Yang S, Gu J, Xu G. A metabonomic study of hepatitis B-induced liver cirrhosis and hepatocellular carcinoma by using RP-LC and HILIC coupled with mass spectrometry. Mol BioSyst. 2009;5 (8):868–876. doi: 10.1039/b820224a. [DOI] [PubMed] [Google Scholar]
- 16.Patterson AD, Maurhofer O, Beyoglu D, Lanz C, Krausz KW, Pabst T, Gonzalez FJ, Dufour J-Fo, Idle JR. Aberrant Lipid Metabolism in Hepatocellular Carcinoma Revealed by Plasma Metabolomics and Lipid Profiling. Cancer Research. 2011;71 (21):6590–6600. doi: 10.1158/0008-5472.CAN-11-0885. [DOI] [PMC free article] [PubMed] [Google Scholar]
- 17.Dunn WB, Broadhurst D, Begley P, Zelena E, Francis-McIntyre S, Anderson N, Brown M, Knowles JD, Halsall A, Haselden JN, Nicholls AW, Wilson ID, Kell DB, Goodacre R. Procedures for large-scale metabolic profiling of serum and plasma using gas chromatography and liquid chromatography coupled to mass spectrometry. Nat Protocols. 2011;6 (7):1060–1083. doi: 10.1038/nprot.2011.335. [DOI] [PubMed] [Google Scholar]
- 18.Tautenhahn R, Böttcher C, Neumann S. Annotation of LC/ESI-MS Mass Signals. In. In: Hochreiter S, Wagner R, editors. Bioinformatics Research and Development. Vol. 4414. Springer; Berlin / Heidelberg: 2007. pp. 371–380. [Google Scholar]
- 19.Storey JD. A direct approach to false discovery rates. Journal of the Royal Statistical Society: Series B (Statistical Methodology) 2002;64 (3):479–498. [Google Scholar]
- 20.Zhou B, Wang J, Ressom H. MetaboSearch: Tool for Mass-Based Metabolite Identification Using Multiple Databases. PLoS ONE. 2012;7(6) doi: 10.1371/journal.pone.0040096. [DOI] [PMC free article] [PubMed] [Google Scholar]
- 21.Wishart DS, Tzur D, Knox C, Eisner R, Guo AC, Young N, Cheng D, Jewell K, Arndt D, Sawhney S, Fung C, Nikolai L, Lewis M, Coutouly MA, Forsythe I, Tang P, Shrivastava S, Jeroncic K, Stothard P, Amegbey G, Block D, Hau DD, Wagner J, Miniaci J, Clements M, Gebremedhin M, Guo N, Zhang Y, Duggan GE, MacInnis GD, Weljie AM, Dowlatabadi R, Bamforth F, Clive D, Greiner R, Li L, Marrie T, Sykes BD, Vogel HJ, Querengesser L. HMDB: the Human Metabolome Database. Nucleic Acids Research. 2007;35 (suppl 1):D521–D526. doi: 10.1093/nar/gkl923. [DOI] [PMC free article] [PubMed] [Google Scholar]
- 22.Smith CA, Maille GO, Want EJ, Qin C, Trauger SA, Brandon TR, Custodio DE, Abagyan R, Siuzdak G. METLIN: A Metabolite Mass Spectral Database. Therapeutic Drug Monitoring. 2005;27 (6):747–751. doi: 10.1097/01.ftd.0000179845.53213.39. [DOI] [PubMed] [Google Scholar]
- 23.Cui Q, Lewis IA, Hegeman AD, Anderson ME, Li J, Schulte CF, Westler WM, Eghbalnia HR, Sussman MR, Markley JL. Metabolite identification via the Madison Metabolomics Consortium Database. Nat Biotech. 2008;26 (2):162–164. doi: 10.1038/nbt0208-162. [DOI] [PubMed] [Google Scholar]
- 24.Fahy E, Sud M, Cotter D, Subramaniam S. LIPID MAPS online tools for lipid research. Nucleic Acids Research. 2007;35 (suppl 2):W606–W612. doi: 10.1093/nar/gkm324. [DOI] [PMC free article] [PubMed] [Google Scholar]
- 25.Ressom H, Xiao J, Tuli L, RSV, Zhou B, Tsai T, Ranjbar M, Zhao Y, Wang J, Poto C, Cheema A, Tadesse M, Goldman R, Shetty K. Utilization of Metabolomics to Identify Serum Biomarkers for Hepatocellular Carcinoma in Patients with Liver Cirrhosis. Analytica Chimica Acta. 2012 doi: 10.1016/j.aca.2012.07.013. In Press. http://dx.doi.org/10.1016/j.aca.2012.07.013. [DOI] [PMC free article] [PubMed]
- 26.Goto T, Myint KT, Sato K, Wada O, Kakiyama G, Iida T, Hishinuma T, Mano N, Goto J. LC/ESI-tandem mass spectrometric determination of bile acid 3-sulfates in human urine: 3β-Sulfooxy-12α-hydroxy-5β-cholanoic acid is an abundant nonamidated sulfate. Journal of Chromatography B. 2007;846 (1–2):69–77. doi: 10.1016/j.jchromb.2006.08.013. [DOI] [PubMed] [Google Scholar]
- 27.Watanabe M, Houten SM, Mataki C, Christoffolete MA, Kim BW, Sato H, Messaddeq N, Harney JW, Ezaki O, Kodama T, Schoonjans K, Bianco AC, Auwerx J. Bile acids induce energy expenditure by promoting intracellular thyroid hormone activation. Nature. 2006;439 (7075):484–489. doi: 10.1038/nature04330. [DOI] [PubMed] [Google Scholar]
- 28.Gowda GAN. Human bile as a rich source of biomarkers for hepatopancreatobiliary cancers. Biomarkers Med. 2010;4 (2):299–314. doi: 10.2217/bmm.10.6. [DOI] [PubMed] [Google Scholar]
- 29.Etzioni A, Levy J, Nitzan M, Erde P, Benderly A. Systemic carnitine deficiency exacerbated by a strict vegetarian diet. Arch Dis Child. 1984;59 (2):177–179. doi: 10.1136/adc.59.2.177. [DOI] [PMC free article] [PubMed] [Google Scholar]
- 30.Bremer J. Carnitine--metabolism and functions. Physiological Reviews. 1983;63 (4):1420–1480. doi: 10.1152/physrev.1983.63.4.1420. [DOI] [PubMed] [Google Scholar]
- 31.Chan W, Lin S, Sun S, Liu H, Luk J, Cai Z. Metabolomics Analysis of the Responses to Partial Hepatectomy in Hepatocellular Carcinoma Patients. American Journal of Analytical Chemistry. 2011;2 (2):142–151. [Google Scholar]
- 32.Zhou L, Wang Q, Yin P, Xing W, Wu Z, Chen S, Lu X, Zhang Y, Lin X, Xu G. Serum metabolomics reveals the deregulation of fatty acids metabolism in hepatocellular carcinoma and chronic liver diseases. Analytical and Bioanalytical Chemistry. 2012;403 (1):203–213. doi: 10.1007/s00216-012-5782-4. [DOI] [PubMed] [Google Scholar]
- 33.Hanahan D, Weinberg Robert A. Hallmarks of Cancer: The Next Generation. Cell. 2011;144 (5):646–674. doi: 10.1016/j.cell.2011.02.013. [DOI] [PubMed] [Google Scholar]
- 34.Tessitore L, Marengo B, Vance DE, Papotti M, Mussa A, Daidone MG, Costa A. Expression of phosphatidylethanolamine N-methyltransferase in human hepatocellular carcinomas. Oncology. 2003;65 (2):152–158. doi: 10.1159/000072341. [DOI] [PubMed] [Google Scholar]
Associated Data
This section collects any data citations, data availability statements, or supplementary materials included in this article.
Supplementary Materials
Supplementary Table: Statistical significance (q-values) of selected ions, their corresponding fold changes (HCC vs. cirrhosis), and QC values.