

Abstract
One of the major bottle-necks in current LC-MS based metabolomic investigations is metabolite identification. An often-used approach is to first look up metabolites from databases through peak mass, followed by verification of the obtained putative identifications using MS/MS data. However, the mass-based search may provide inappropriate putative identifications when the observed peak is from isotopes, fragments or adducts. In addition, a large fraction of peaks is often left with multiple putative identifications. To differentiate these putative identifications, manual verification of metabolites through comparison between biological samples and authentic compounds is necessary. However, such experiments are laborious especially when multiple putative identifications are encountered. It is desirable to use computational approaches to obtain more reliable putative identifications and prioritize them before performing experimental verification of the metabolites. In this paper, a computational pipeline is proposed to assist metabolite identification with improved metabolome coverage and prioritization capability. Multile publicly available software tools and databases, along with in-house developed algorithms, are utilized to fully exploit the information acquired from LC-MS/MS experiments.. The pipeline is successfully applied to identify metabolites on the basis of LC-MS as well as MS/MS data. Using accurate masses, retention time values, MS/MS spectra and metabolic pathways/networks, more appropriate putative identifications are retrieved and prioritized to guide subsequent metabolite verification experiments.
Keywords: metabolomics, ion annotation, isotopic pattern analysis, pathway and network analysis, spectral interpretation, spectral matching
1. Introduction
Metabolomics is the comprehensive detection and quantitation of small molecules (<1,500 Da) involved in metabolic reactions of biological samples. It facilitates the understanding of biochemical fluxes and discovery of metabolites indicative of unusual biological or environmental perturbation. Also, complementing genomics, transcriptomics, and proteomics, metabolomics provides a systematic view of the biological process. It has been used in various research areas including environmental and biological stress studies, toxicology, functional genomics, biomarker discovery, pharmacogenomics, nutrition, and integrative systems biology [1–5].
Due to its high sensitivity and broad coverage of the metabolome, liquid chromatography-mass spectrometry (LC-MS) is a popular analytical platform for metabolomic studies. However, metabolite identification remains one of the major bottlenecks in LC-MS-based metabolomic studies. Although new metabolites continue to be identified, many of the metabolites encountered in experiments are “known unknowns”. These metabolites have been previously discovered with their physicochemical properties characterized (sometimes partially). However, they are unknown in the specific experiment. In its current stage, metabolite identification of these “known unknowns” is usually accomplished by a mass-based search followed by experimental verification of metabolites. In the mass-based search, accurate mass values, which are calculated based on the mass-to-charge ratio (m/z) of the observed peaks, are used to query a database (or databases) for metabolites whose molecular weights are within a specified mass tolerance range. These metabolites are considered as putative identifications. Generally, the mass-based search leaves a large fraction of observed peaks with either no identification or multiple putative identifications. Only 20%–30% of peaks can be uniquely identified with mass-based search in a typical LC-MS-based metabolomic experiment. Thus, metabolite verification experiments are carried out to differentiate among multiple putative identifications. The authentic compounds are selected based on putative identifications of the molecular ions. By analyzing the sample and the authentic compound side-by-side under identical experimental conditions, the metabolite verification is achieved through the comparisons of the masses, retention times, and tandem MS spectra (MS/MS) between authentic compounds and the molecular ions of interest in samples. The experimental verification of metabolites is effective in differentiating multiple putative identifications. However, it is often laborious and costly to perform, especially when there are many putative identifications for a molecular ion.
Although experimental verification of metabolites is generally considered as the “gold standard” for metabolite identification [6], computational approaches can be utilized to increase the number of peaks with putative identifications as well as to provide guidance for metabolite verification experiments through prioritization of putative identifications. Several computational algorithms have been previously developed to facilitate metabolite identification [7–10], but largely in isolated manners. We previously proposed to assemble the various existing software tools and databases into a computational pipeline to fully utilize the information acquired from LC-MS-based metabolomic experiments [11]. In this paper, we further expand the pipeline to incorporate the biochemical pathway/network knowledge into the metabolite identification process. More in-depth investigations have been conducted to evaluate the performance of the pipeline using an LC-MS/MS-based metabolomic study. We demonstrated that the proposed pipeline can retrieve more appropriate putative identifications compared to the conventional approach, as well as prioritize the putative identifications. The paper is organized as follows: Section 2 presents each step of the proposed pipeline. Section 3 uses LC-MS and MS/MS data from a metabolomic study to demonstrate the application of the pipeline in prioritizing putative metabolite identifications. Section 4 discusses the results and provides directions for future research.
2. Methods and Materials
2.1 Methods
The proposed pipeline involves six steps: ion annotation, mass-based search, isotopic pattern analysis, pathway and network analysis, spectral interpretation, and spectral matching (Figure 1). We describe each of these steps in the following sections.
Figure 1.
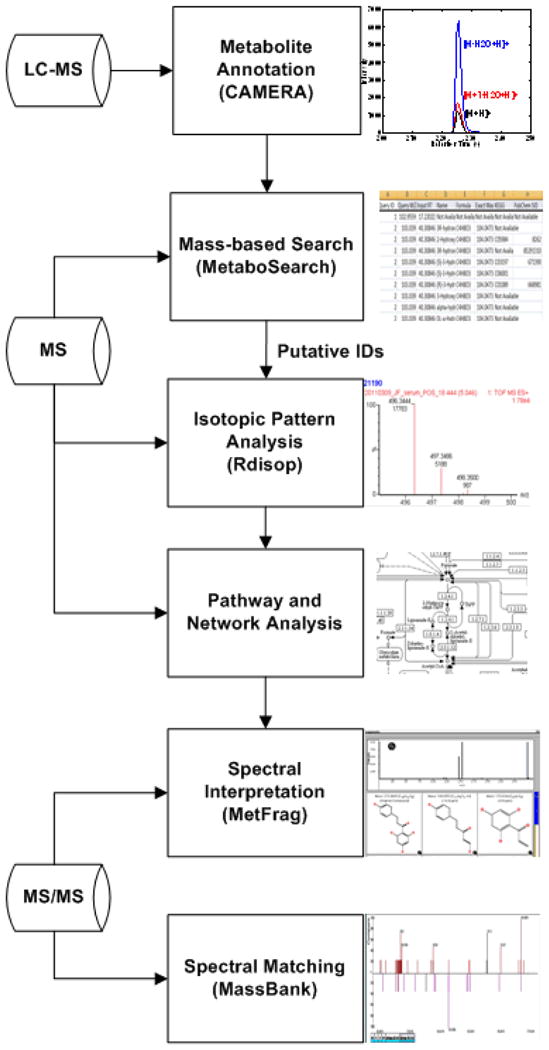
Proposed computational pipeline for metabolite identification and prioritization of putative identifications.
2.1.1 Ion Annotation
Ion annotation recognizes a group of ions which are likely to originate from the same compound. Due to the effects of isotopes, adducts, and neutral-loss fragments, one metabolite is often represented by multiple peaks with distinct m/z values but at similar retention times in the LC-MS data. Recognition of such clusters of peaks facilitates the metabolite identification task.
Different adducts/isotopes/neutral-loss fragments of the same compound theoretically share the same retention time in a chromatogram. Moreover, the ions originating from the same compound should also share similar-shaped elution profiles. As long as the scan rate is properly adjusted and enough scanning points are acquired to define the chromatographic peaks, elution profiles can be represented by extracted ion chromatograms (EICs) of the corresponding ions. Thus, ion annotation can be accomplished through cluster analysis of EICs.
Different ion formations of the same metabolite will differ in their m/z values. The observed m/z value of an ion derived from a metabolite with a monoisotopic molecular weight M is given by Eq. (1) [12]
| (1) |
where n is the number of molecules in the ion, α is the mass of the adducts (or in negative values as mass of lost fragments), Mneutron is the mass of the neutron, β is the extra number of neutrons in isotopes, and z is the charge of the ion. In LC-MS, many types of adducts and fragments are known such as [M+H]+, [M+Na] +, [M+K] +, [M+H-H2O] +, etc. As a result, the m/z relationships between these known ion formations are often known a priori.
An R-package CAMERA (Collection of Algorithms for Metabolite pRofile Annotation), was previously developed for ion annotation [12]. It performs ion annotation in three steps. In the first step, CAMERA uses a sliding window to roughly group the detected peaks whose retention times are within a pre-defined range. Then, the EICs of the peaks within each group are clustered into smaller groups based on Pearson correlation coefficients. Finally, the m/z difference between each peak pair within the new group is calculated. The two ions are considered to originate from the same compound if their EICs are clustered into the same group and their m/z difference can be explained by known ion formations.
2.1.2 Mass-based Search
The exact monoisotopic masses of detected metabolites can be calculated based on the accurate mass measurements and the ion annotation information. The calculated masses are then used to search against metabolite databases to retrieve metabolites with similar masses. A software tool, MetaboSearch [13], was developed to search four metabolite databases: Human Metabolome DataBase (HMDB) [14], Metlin [15], MMCD [9] and LipidMaps [16]. The results from these databases are merged based on the InChI Keys of the retrieved metabolites to remove redundancy. An InChI Key is the hashed version of International Chemical Identifier (InChI) and contains information about molecular formula, atom connection, and stereochemistry of a compound. The merged results are then used as putative identifications of the detected metabolites.
2.1.3 Isotopic Pattern Analysis
The putative identifications from mass-based search for an ion may include both isomers (compounds with the identical elemental formula but different structures) and compounds whose elemental formulas are different but the difference between their molecular masses is too small to be differentiated by the mass spectrometer used. For those putative identifications with different elemental formulas, the observed isotopic pattern from MS spectra is matched against the theoretical isotopic patterns to prioritize the corresponding putative identifications.
In the proposed pipeline, different elemental formulas are scored by the R-package Rdisop [17]. The score is computed as a posterior probability P(M|D, B) where M is the elemental formula of a putative identification; D is the observed isotopic pattern of the ion and B denotes any prior knowledge about M.
| (2) |
| (3) |
where P(Mj|mj) is the conditional probability to observe jth isotopic peak at Mj when the theoretical m/z of the jth isotopic peak is mj; P(fj|pj) is the conditional probability to observe jth isotopic peak with relative intensity fj when the theoretical relative intensity of the jth isotopic peak is pj. It is usually assumed that mass deviation from the theoretical mass follows a normal distribution with mean zero for the purpose of computational simplicity [17, 18]. Also, it has been suggested that the logarithm of the ratio between the observed intensity and the theoretical intensity follows a normal distribution with mean one [17]. Thus, both P(Mj|mj) and P(fj|pj) are assumed to have normal distributions in Rdisop.
2.1.4 Pathway and Network Analysis
In any given organism, metabolites are not detected in isolation; instead they are dependent on each other. The interdependent metabolites form a metabolic network through the biochemical reactions between each other. Pathway and network analysis for metabolite identification aims in mining this informative biochemical relationship to prioritize the most probable identification for each peak.
A Bayesian approach was previously developed to assign elemental formulas to mass peaks probabilistically [18]. A set of possible biochemical reaction types is extracted from KEGG pathway database. An elemental formula is deemed as a more likely candidate for a peak if it can be related to the elemental formulas of the other mass peaks through these biochemical reactions. However, since an elemental formula may correspond to multiple isomers, this approach cannot be used to uniquely identify an unknown peak. Because a metabolite having a biochemical relationship with one isomer may not be related to other isomers, we extend this approach by incorporating the structural isomer information into the network construction.
One challenge that obstructs the utilization of pathway information for metabolomic study is the sparseness of both known pathways and detected metabolites from LC-MS data. On the one hand, the genomic-reconstructed mammalian pathway databases or reaction pathway databases are far from complete due to enzyme substrate or reaction promiscuity. On the other hand, a typical LC-MS dataset does not contain all the metabolites predicted in a genome-constrained metabolic network, as many metabolic pathway intermediates do not accumulate in the sample, in addition to the constraints given by the particular analytical platform. A metabolic network reconstruction approach was previously used to map and visualize identified metabolites from gas chromatography-mass spectrometry (GC-MS) data by integrating information from biochemical pathways, chemical structure similarity, and mass spectral similarity [19]. We adopted a similar approach in this work to reconstruct metabolic interactions between all the putative identifications from the mass-based search results. The reconstructed network is denoted by a C × C binary matrix W, where C is the total number of putative identifications and Wi, j = 1 if there is a reconstructed-connection between the ith and the jth putative identifications.
It is assumed that the conditional prior for a putative identification to be the correct identification for a mass peak is proportional to the number of its network connections with the identifications of the other peaks. In mathematical formula, it takes the following form
| (4) |
| (5) |
where Z is a C × M binary matrix represents the assignment of M mass peaks to C putative identifications. Zcm is an element in matrix Z. The cth row and mth column of W and Z are denoted by WC· and Z·m, respectively. βcm represents the number of identifications for peaks other than the mth peak that have network connections with the cth putative identification assigned to the mth peak. δ is a smoothing hyper-parameter to ensure the denominator is not zero. Assuming the mass deviation of the observed mass peak follows a normal distribution, we have the following likelihood function,
| (6) |
where xm and yc are the masses of the mth mass peak and the cth putative identification, respectively. γ is a hyper-parameter representing the accuracy of mass measurement. The hyper-parameters γ and δ are set to fixed values in the current experiment, although they can be sampled from probability distributions, which will be investigated in the future research. From Eq. (5) and (6), we obtain Eq. (7) that presents the posterior probability distribution given masses of peaks, exact masses of putative identifications, and the network relationships between putative identifications.
| (6) |
Then a Gibbs sampling approach is used to sample the posterior distribution. The sampled distribution is utilized to probabilistically assign putative identifications to mass peaks.
2.1.5 Spectral Interpretation
Spectral interpretation uses in-silico fragmentation to predict the possible ion fragments based on the structures of putative identifications. The putative identifications are then prioritized by comparing the predicted fragments with the MS/MS spectrum of the unknown molecular ion. Spectral interpretation is performed in the current pipeline using MetFrag [8]. Each structure is considered as the root node of a fragmentation tree and fragments are generated by combinatorial disconnection of chemical bonds. The disconnection procedure is iteratively carried out using a breadth-first approach to generate all possible fragment ions from the given structure. The generated fragment ions and disconnected bonds are recorded when the fragments match to the m/z values of peaks in the MS/MS spectrum of the molecular ion of interest. The combinatorial disconnection procedure is performed until all the observed fragment peaks in the MS/MS spectra are matched with in-silico fragments or a certain depth in the fragmentation tree is reached.
After the generation and matching of in-silico fragments, the structure of putative identification is scored according to the total number of matched fragments and the bond dissociation energy required to generate these fragments. The score of a particular compound i can be mathematically formulated as follows:
| (7) |
| (8) |
| (9) |
where Fi is the set of fragment peaks from MS/MS data which match the in-silico fragments. intf and massf are the intensity and m/z values for the fth peak in the MS/MS spectra. wi measures the weighted total number of explained fragment peaks. ei is the penalty term for bond dissociation energy. BDEb is the bond dissociation energy of a particular bond b. Overall, the putative identification whose structure can explain most of the fragment peaks in the experimental MS/MS spectrum with minimum bond dissociation energy is favored as the most likely identification for the ion of interest.
2.1.6 Spectral Matching
Spectral matching mimics the experimental verification of metabolites by comparing acquired MS/MS spectra against a MS/MS spectral library. So instead of acquiring the MS/MS spectrum of the authentic compound each time, MS/MS spectra obtained from the previous experiments can be reused by assembling them into a spectral library. Several publicly available spectral libraries have been constructed [10, 15, 20]. Among them, the MassBank is used in the proposed pipeline, which contains 9,276 ESI-MSn spectra of 2,337 metabolites generated at multiple institutes. For a large number of metabolites, more than one spectrum is acquired with various collision energies or instruments, which increase the transferability of the spectral library across different experiments.
One important aspect in spectral matching is the design of the spectral similarity score. In MassBank, the similarity score S is calculated as the cosine correlation between the intensity-scaled and mass-weighted library spectrum and query spectrum. The matching score between two spectra is defined as
| (10) |
where WL and WQ are intensity-scaled and mass-weighted intensities of the library spectrum and the query spectrum respectively. The purpose of intensity-scaling is to increase the relative significance of low-intensity peaks, so that the cosine correlation measure is not dominated by a few peaks with high intensities. Also, it has been empirically demonstrated that the peaks on the high m/z end of the spectrum are usually more diagnostic for spectral matching; thus the original MS/MS spectrum is also weighted by its m/z values [21]. The intensity-scaled and mass-weighted spectrum is
| (11) |
where fi and mi are the intensity and m/z value of the ith peak, respectively. N is the total number of matched peaks between the library and the query spectra. m and n are empirically determined to be 0.5 and 2, respectively, for ESI-MS/MS spectra based on an experiment involving 8,785 spectra [22].
2.2 Datasets
We used the proposed pipeline for metabolite identification based on LC-MS/MS data from a previously conducted metabolomic study [23]. The study was performed in two stages: in the first stage, an LC-MS metabolomic analysis was performed to identify biomarkers in human serum samples that distinguish cancer cases from controls. After the LC-MS analysis, several peaks which show statistically significant difference between cases and controls were subjected to an MS/MS analysis, in which the MS/MS data were acquired to assist the identification of these statistically significant peaks. A detailed description of the study and the data can be found in ref. [23].
2.2.1 LC-MS Data
LC-MS data were acquired through an untargeted metabolomic analysis of human serum samples. Liquid chromatography was performed on an ACQUITY UPLC system (Waters, Milford, MA) with a reverse-phase 50 × 2.1 mm ACQUITY 1.7-μm C18 column (Waters, Milford, MA) using a gradient mobile phase. Each sample was resolved for 10 min at a flow rate of 0.5 ml/min. The column eluent was introduced directly into the mass spectrometer. Mass spectrometric analysis was performed on a QTOF Premier instrument (Waters, Milford, MA) operating in both positive and negative modes. The capillary voltages were set to 3.2 kV and 3 kV, and the cone voltages were 30V and −20 V for positive and negative modes, respectively. The LC-MS data were acquired in centroid mode from m/z values of 50 to 850 in MS scanning using Waters MassLynx software. The acquired data were preprocessed using the XCMS software [24].
2.2.2 MS/MS data
MS/MS data were acquired by analyzing a limited subset of peaks which exhibit statistical significance between cases versus controls. The positive MS/MS spectra were acquired with the QTOF Premier operating in product ion scanning. The capillary voltage was set to 3.2 kV, and the sampling cone voltage was 50 V. The collision energy was set to 35 eV. The negative MS/MS spectra were acquired with a QSTAR (AB Sciex, Foster City, CA) operating in product ion scanning. The spray voltage was set to −2.3 kV. The source temperature was 500 °C and the interface heater temperature was 160 °C. The exit potential was set to −10 V, and a collision energy of −50 eV was used.
3 Results
3.1 Metabolite identification using LC-MS data
LC-MS data were acquired in both positive and negative modes. 1,586 peaks were detected in the positive mode, and 941 peaks were detected in the negative mode. The m/z values, retention times and elution profiles of these peaks were obtained from the LC-MS data. As a result, the first four steps of the pipeline, (i.e. ion annotation, mass-based search, isotopic pattern analysis, and pathway and network analysis) were applied to obtain and prioritize the putative identifications for these peaks. Ion Annotation
The ion annotation of the detected peaks was performed using CAMERA, searching for sodium adducts, potassium adducts, water-loss products, doubly-charged ions and isotopic ions up to the fourth order. In the positive mode data, CAMERA annotated 80 peaks as sodium adducts, 38 peaks as potassium adducts, 59 peaks as water-loss products, 77 peaks as doubly-charged ions and 382 peaks as isotopic ions. In total, 1,066 peak groups were identified from the positive mode data, which correspond to metabolite compounds. In the negative mode data, CAMERA annotated 20 peaks as sodium adducts, three peaks as water-loss products, 15 doubly-charged ions, and 194 peaks as isotopic ions. In total, 724 peak groups were identified from the negative mode data.
3.1.2 Mass-based Search
The exact masses of the metabolites were calculated from their accurate masses and the ion annotation information. Then, MetaboSearch was used to retrieve and integrate putative identifications from HMDB, Metlin, MMCD, and LipidMaps databases [13]. A 10 ppm tolerance was used for the mass-based search against these databases. We acquired 5,574 putative identifications for 853 peaks in the positive mode data. In the negative mode data, 3,868 putative identifications were acquired for 400 peaks. The results of the ion annotation and the mass-based search are summarized in Table 1. It has been shown previously that the utilization of ion annotation information and the integration from multiple databases improve metabolome coverage by increasing both the number of putative identifications and the number of peaks having putative identifications. However, for many peaks, more than one putative identification was retrieved from databases. Some of the putative identifications are isomers, which have the same elemental formula but different structures. The others are of different elemental formulas but with very similar masses. At this step, the correct metabolite identifications or the relative priorities of these putative identifications are unknown.
Table 1.
Ion annotation, mass-based search, isotopic pattern analysis, and pathway and network analysis using LC-MS data.
| Positive | Negative | ||
|---|---|---|---|
| Ion annotation | No. of peaks | 1586 | 941 |
| No. of ion annotation groups | 1066 | 724 | |
| Mass-based search | No. of putative identifications | 5574 | 3868 |
| No. of peaks with putative identification | 853 | 400 | |
| Isotopic pattern analysis | No. of peaks with different elemental formulas | 93 | 99 |
| No. of peaks confidently prioritized | 18 | 22 | |
| Pathway and network analysis | No. of peak groups with PubChem CIDs | 335 | 205 |
| No. of peak groups with enhanced identification confidence | 180 | 114 | |
| No. of peak groups with the same identification confidence | 148 | 84 | |
| No. of peak groups with decreased identification confidence | 7 | 7 |
3.1.3 Isotopic Pattern Analysis
When putative identifications for the same peak have different elemental formulas, they can be potentially differentiated through isotopic pattern analysis. We found 93 peaks in the positive mode and 99 peaks in the negative mode, each peak having putative identifications with different elemental formulas. The observed isotopic patterns of these peaks were extracted from the LC-MS data to compare with the theoretical isotopic patterns of different elemental formulas. First, the biological sample in which the peak has the highest intensity was determined based on the peak list from the preprocessed data. Then the isotopic pattern of that peak was extracted from the mass spectrum at the chromatographic apex position. Only the monoisotopic peak and the first-order isotopic peak ([M+1]) were extracted since the higher-order isotopic peaks often have small intensities which are easily distorted by noise.
Rdisop was customized to score the putative identifications. The m/z tolerance in the original package has been altered to reflect the characteristics of our UPLC-QTOF instrument. The m/z variation of the mono-isotopic peak is assumed to be 10 ppm while that of isotopic peaks is set to 20 ppm. We consider a prioritization to be confident if the highest posterior probability score is larger than 0.5 and the highest score is at least 2-fold larger than the 2nd highest score. Based on this confidence criterion, we prioritized the putative identifications of 18 peaks in the positive mode and 22 peaks in the negative mode. The results are also summarized in Table 1.
3.1.4 Pathway and Network Analysis
The pathway and network analysis was utilized to analyze the LC-MS dataset. To reduce the computational complexity for network reconstruction and Gibbs sampling, we focused on ion-annotated peak groups instead of individual peaks in the analysis, without losing any information. There may be two peak groups, one from the positive mode data and the other from the negative mode data, which may or may not represent the same metabolites. Therefore, we analyzed the positive and negative mode data separately to avoid the potential ambiguity that may adversely affects the identification of the metabolites for these two peak groups and other peak groups. The network between putative identifications of all peak groups was reconstructed using the previously described approach [19]. However, we did not use the mass spectral similarity due to the lack of MS/MS data for most of the detected peak groups in our LC-MS data. The biochemical pathway information was extracted from the KEGG reactant pair database, while structural similarity was measured in Tanimoto scores using the Chemical Structure Clustering Tool in PubChem database with PubChem CIDs as the input. A cut-off value of 0.9 on Tanimoto scores was used to establish network connections between putative identifications. Then, the network connections acquired from KEGG database and Tanimoto scores were merged to reconstruct the final network. In the positive mode data, the network was reconstructed for 832 unique PubChem CIDs corresponding to 335 peak groups. In the negative mode data, the network was reconstructed for 720 unique PubChem CIDs corresponding to 205 peak groups. We discarded the remaining peak groups and putative identifications due to the lack of PubChem CIDs (mainly because of the lack of cross-reference in the queried metabolite databases, especially Metlin database). The reconstructed network for all the putative identifications are shown in Figure 2.
Figure 2.

Reconstructed biochemical network based on putative identifications from the positive mode data (top panel) and the negative mode data (bottom panel). Each node represents a putative identification. Isolated putative identifications (i.e., those with no connection to others) are omitted from the figure. The enlarged nodes (marked in yellow) in the bottom panel are provided in Figure 3.
The Gibbs sampling was performed 5,000 times, with the first 2,000 samples as burn-in samples. The hyper-parameters γ is set to so that the majority of the mass measurements (larger than 99.9%) have an error less than 10 ppm, which is the known machine accuracy. δ is set to 1 for mathematical simplicity. For each peak, the probability scores were then assigned to putative identifications as the likelihood for a putative identification to be the correct identification. For the sake of comparison, we computed the probability of assigning a peak to putative identifications based on only accurate mass values, assuming the mass deviation xm/yc follows a normal distribution with mean one and standard deviation of 10 ppm/3. It was demonstrated that the network information generally enhances the confidence of metabolite identification. In the positive mode data, the maximum probability scores for 180 out of 335 peak groups were increased using the network information. The probability scores for 148 peak groups remained the same, mainly because each of these peak groups had a unique putative identification. In the negative mode, 114 peak groups showed increased probability scores. Only a tiny fraction of peak groups (7 peak groups in either case) showed decreased probability scores after pathway and network analysis. Although we have not performed verification using authentic compounds, the elevated probability scores generally indicate the role of network information in enhancing the confidence about metabolite identification. Table 1 summarizes the results we obtained using the pathway and network analysis.
3.2 Metabolite identification using MS/MS data
A small subset of peaks is used here as an example to demonstrate the utility of our pipeline using MS/MS data. These peaks are selected from a list of peaks that showed statistically significant difference between case and control samples. The m/z values and retention times of the selected peaks are presented in the first two columns of Table 2.
Table 2.
Ion annotation for 13 selected peaks.
| m/z | Retention time (s) | Annotation |
|---|---|---|
| 432.31 | 227.14 | [M1-H2O+H]+ |
| 433.31 | 227.14 | [M1+1-H2O+H]+ |
| 432.31 | 224.09 | [M2-H2O+H]+ |
| 433.32 | 224.06 | [M2+1-H2O+H]+ |
| 450.32 | 224.68 | [M2+H]+ |
| 450.32 | 227.17 | [M1+H]+ |
| 378.24 | 261.80 | [M3−H] − |
| 528.26 | 197.95 | [M4−H] − |
| 529.27 | 194.67 | [M4+1-H] − |
| 514.29 | 182.78 | [M5−H] − |
| 515.29 | 182.78 | [M5+1-H] − |
| 516.29 | 182.79 | [M5+2-H] − |
| 517.29 | 182.79 | [M5+3-H] − |
From the ion annotation results shown in Table 2, we observed that the 13 peaks were derived from five unknown metabolites. We denote these metabolites as M1-M5. The subsequent analysis would be focused on five peaks, which represent the protonated or deprotonated ions of these metabolites ([M1+H]+, [M2+H]+, [M3−H]−, [M4−H]−, and [M5−H]−). The other peaks are attributed to water-loss fragments, isotopes, and their combinations of metabolites M1, M2, M4, and M5.
The mass-based search results for metabolites M1-M5 are shown in Table 3. For each of the metabolite, there are two to six putative identifications. Some of the putative identifications are isomers, such as GDCA (glycodeoxycholic acid) and GCDCA (glycochenodeoxycholic acid). Others such as sphingosine-1-phosphate (S-1-P) and Celiprolol have different elemental formulas but with very similar masses. For example, S-1-P and Celiprolol have a mass difference of only about 4 ppm.
Table 3.
Prioritization of putative identifications using LC-MS/MS data. The scores of the putative identifications with the highest priorities at each step are presented in boldface.
| Mass-based Search | Isotopic Pattern Analysis | Pathway and Network Analysis | Spectral Interpretation | Spectral Matching | |||||
|---|---|---|---|---|---|---|---|---|---|
|
| |||||||||
| Metabolite | Query m/z | Name | Formula | Exact Mass | Posterior Probability | Probability Scores | Score | Number of Explained Peaks | Score |
| M1 | 450.32 | GDCA | C26H43NO5 | 449.31 | |||||
| GCDCA | C26H43NO5 | 449.31 | |||||||
|
| |||||||||
| M2 | 450.32 | GDCA | C26H43NO5 | 449.31 | 0.901 | 32 | 0.537891 | ||
| GCDCA | C26H43NO5 | 449.31 | 1.0 | 20 | 0.530468 | ||||
|
| |||||||||
| M3 | 378.24 | Celiprolol | C20H33N3O4 | 379.24 | 0.12 | 0.30 | 0 | 4 | |
| S-1-P | C18H38NO5P | 379.24 | 0.8 | 0.71 | 1.0 | 20 | |||
|
| |||||||||
| M4 | 528.26 | 7-sulfo-GDCDA | C26H43NO8S | 529.27 | 0.63 | 0.48 | 1.0 | 2 | |
| 3-sulfo-GDCDA | C26H43NO8S | 529.27 | 0.63 | 0.50 | 1.0 | 2 | |||
| Haloperidol decanoate | C31H41ClFNO3 | 529.28 | 2.91e-15 | 0.02 | 0 | 0 | |||
|
| |||||||||
| M5 | 514.29 | 2-Aminoethylphosphocholate | C26H46NO7P | 515.30 | 6.83e-5 | 0 | 1.0 | 3 | |
| Candoxatril | C29H41NO7 | 515.29 | 5.1e-4 | 0 | 1.0 | 8 | |||
| PC(18:4(9E,11E,13E,15E)/0:0) | C26H46NO7P | 515.30 | 6.83e-5 | 0 | 1.0 | 3 | |||
| PC(18:4(6Z,9Z,12Z,15Z)/0:0) | C26H46NO7P | 515.30 | 6.83e-5 | 0 | 1.0 | 3 | |||
| Tauro-b-muricholic acid | C26H45NO7S | 515.29 | 0.39 | 0.49 | 1.0 | 5 | |||
| TCA | C26H45NO7S | 515.29 | 0.39 | 0.51 | 1.0 | 10 | 0.74 | ||
The putative identifications for M3-M5 were scored using isotopic pattern analysis, and the results are summarized in Table 3. For the two putative identifications of M3, S-1-P showed a confident priority over Celiprolol. Among the three putative identifications of M4, Haloperidol decanoate is unlikely to be the correct identification for M4. However the relative priority between 3-Sulfo-GCDCA (glycochenodeoxycholic acid 3-sulfate) and 7-Sulfo-GCDCA (glycochenodeoxycholic acid 7-sulfate) cannot be established as they are isomers. For M5, although the posterior probability scores for Tauro-b-muricholic acid and TCA (taurocholic acid) are several magnitudes higher than the other putative identifications, their absolute values (0.39) are too low to achieve the confidence criterion set above.
The putative identifications for M3-M5 were further analyzed using the proposed pathway and network analysis step of our pipeline. M1 and M2 were skipped from the analysis because the two metabolites correspond to exactly two isomers. The analysis cannot be used to differentiate these two metabolites as both isomers appear in the underlying network. The results for M3-M5 are shown in Table 3. For M3, we found S-1-P to have a higher priority over Celiprolol. This agrees with the results we previously found using the other steps of the pipeline. M4 and M5 each involve putative identifications of two isomers. The probability scores for the two isomers in each group are so small that we were unable to confidently assign priority levels to them. This is because these isomers have a high structural similarity with Tanimoto scores over 0.9. However, compared to other putative identifications for M4 and M5, the two isomers in each group have shown significantly higher scores. In addition, when the putative identifications with the highest scores were assigned to all the peak groups under investigation, M4, M5 and several other peaks in the LC-MS data formed a network cluster as shown in Figure 3. The formation of this dense cluster indicates that the analysis is inclined to assign higher probability scores to putative identifications which interact with each other. Figure 3 shows that M4 and M5 were assigned as 3-Sulfo-GCDCA and TCA, respectively. These metabolites have been verified by using authentic compounds as described in Section 4.
Figure 3.

A network cluster derived from the pathway and network analysis result presented in Figure 2 (bottom panel). Each node is a peak group in LC-MS data, labeled by its putative identification with the highest probability from the pathway analysis. The nodes labeled as 3-Sulfo-GCDCA and TCA represent the most likely candidates for M4 and M5, respectively.
MS/MS experiments were then conducted on the protonated (or deprotonated) ions of M1-M5. For M1 and M2, MS/MS data were obtained using the UPLC-QTOF Premier instrument with precursor ion scan at m/z 450.3. For other ions, MS/MS data were obtained using the AB QSTAR instrument with precursor ion scan at m/z 378.2, 528.2, 514.3, 510.4. However, since the intensity of M1 is too low in the sample, we acquired MS/MS spectra for M2-M5 only. These spectra were used to further prioritize the putative identifications via the spectral interpretation and spectral matching methods (the last two steps of the pipeline).
3.2.1 Spectral Interpretation
The MS/MS spectra were analyzed for spectral interpretation using MetFrag. The results are presented in Table 3, where the priorities of the putative identifications are denoted with bold figures. Normally, we prioritize the putative identifications on the basis of their scores. If multiple putative identifications have the same score, then the one that explains more peaks in the spectrum is favored. For metabolites M2, M3 and M5, GCDCA, S-1-P and TCA were considered as the most probable metabolites, Although GDCA can explain more peaks in the spectrum than GCDCA, its score is slightly lowered due to its higher bond dissociation energy. For metabolite M4, isomers 7-Sulfo-GCDCA and 3-Sulfo-GCDCA formed a tie and were equally possible. However, both of them showed a clear advantage over Haloperidol decanoate, which provided a confirmation for the result from the previous steps in the pipeline.
3.2.2 Spectral Matching
We checked the presence of MS/MS data in MassBank for the putative identifications of M2–M5. For M2, we found MS/MS data for both putative identifications. The spectral matching results for M2 are shown in Table 3. Similar to spectral interpretation results, the matching scores for GDCA and GCDCA intrinsically form a tie again. In this case, the two putative identifications are considered as equally possible identifications for M2. For metabolites M3–M5, not all of their putative identifications were included in MassBank, which made direct comparison across putative identifications impossible. However, the spectral matching can still be used to support the prioritization from previous steps. For example, we were able to establish a spectral matching score of 0.74 for M5 regarding the putative identification TCA. Since the range of spectral matching score is between zero and one, this relatively high matching score in combination with the spectral interpretation results can be considered as the evidence that TCA is the most likely identification for M5.
Table 4 presents the prioritization results obtained by the proposed pipeline for the 13 peaks. It should be noted that the pipeline only provides putative identifications for the (de)protonated ions of M1-M5, as other peaks are different ion formations of the same metabolite. The table also compares these results of the pipeline with the putative identifications obtained by mass-based search only using the same mass tolerance range.
Table 4.
Putative identifications prioritized by the proposed pipeline compared with those from mass-based search.
| Mass-based search results | Proposed pipeline (* indicates priority) | |||
|---|---|---|---|---|
| m/z | Retention time (s) | ID | Annotation | ID |
| 432.31 | 227.14 | Sphingofungin A | [M1-H2O+H] + | |
| 433.31 | 227.14 | 4,4′-Diaponeurosporenic acid (20R,24R)-20-fluoro-1alpha,24-dihydroxy-26,27- cyclovitamin D3 |
[M1+1-H2O+H] + | |
| 432.31 | 224.09 | Sphingofungin A | [M2-H2O+H]+ | |
| 433.32 | 224.06 | 4,4′-Diaponeurosporenic acid (20R,24R)-20-fluoro-1alpha,24-dihydroxy-26,27- cyclovitamin D3 |
[M2+1-H2O+H]+ | |
| 450.32 | 224.68 | GDCA GCDCA |
[M2+H]+ | GDCA GCDCA |
| 450.32 | 227.17 | GDCA GCDCA |
[M1+H]+ | GCDCA GDCA |
| 378.24 | 261.80 | Celiprolol S-1-P |
[M3-H] − | S-1-P (*) Celiprolol |
| 528.26 | 197.95 | 7-sulfo-GCDCA 3-sulfo-GCDCA Haloperidol Decanoate |
[M4-H] − | 7-sulfo-GCDCA (*) 3-sulfo-GCDCA (*) Haloperidol Decanoate |
| 529.27 | 194.67 | - | [M4+1-H] − | |
| 514.29 | 182.78 | TCA Tauro-b-muricholicacid 2-Aminoethylphosphocholate Candoxatril PC(18:4(9E,11E,13E,15E)/0:0) PC(18:4(6Z,9Z,12Z,15Z)/0:0) |
[M5−H] − | TCA (*) Tauro-b-muricholicacid Candoxatril 2-Aminoethylphosphocholate PC(18:4(9E,11E,13E,15E)/0:0) PC(18:4(6Z,9Z,12Z,15Z)/0:0) |
| 515.29 | 182.78 | Arg Arg Trp Trp Arg Arg Atracurium (Quaternary alcohol) L-Olivosyl-oleandolide |
[M5+1-H] − | |
| 516.29 | 182.79 | - | [M5+2-H] − | |
| 517.29 | 182.79 | Sativanine B Hypercalin B |
[M5+3-H] − | |
4 Discussion and Verification
For an untargeted metabolomic analysis where only LC-MS data are available, the proposed pipeline is able to recognize the peaks which are derived from the same compound. As shown in Table 1, the ion annotation generally enables more peaks to be assigned with putative identifications. The improvement is because more appropriate mass values are used for mass-based search, which are calculated based on the ion annotation information. This is also demonstrated in Table 4 for peaks with m/z values 529.27 and 516.29. Direct mass-based search did not give any hit from the database for these peaks, because the wrong mass values were used. Ion annotation determines that these peaks represent isotopes of other peaks in the data. The appropriate mass values were then used to find the putative identifications for these peaks. The ion annotation also simplifies the identification task. As can be seen in Table 4, although there are seemingly 13 peaks, after ion annotation, only five peaks need to be identified. In addition, without ion annotation, all the peaks may be treated as (de)protonated, monoisotopic peaks. This leads to the exclusion of correct identifications from the putative identifications for many peaks, as illustrated in Table 4. The experimental verification of metabolites would then be performed in vain on those wrong putative identifications. Although it is possible to consider other ion formations (adducts, neutral-loss fragments, isotopes) during mass-based search blindly without ion annotation, it will significantly expand the search space and unnecessarily increase the number of putative identifications, which further complicates the experimental verification of metabolites. With ion annotation, the appropriate masses were used to retrieve the putative identifications. The exclusion of unlikely putative identifications with the help of ion annotation can save the efforts needed in the subsequent verification experiments.
For LC-MS data, the prioritization capability of the pipeline comes from the isotopic pattern analysis and pathway and network analysis. The isotopic pattern analysis is limited to differentiate only the putative identifications with different elemental formulas. However, it is still helpful to guide the subsequent experimental verification of metabolites. In some cases, it can even lead to the unique identification such as M3 in Table 4. However, the isotopic pattern analysis is not able to differentiate isomers such as 3-Sulfo-GCDCA and 7-Sulfo-GCDCA for M4. In addition, the isotopic pattern analysis can be easily distorted by intensity noise, which makes the prioritization difficult.
The pathway and network analysis has the potential to differentiate structural isomers, as different structural isomers may have different biochemical connections to other metabolites. The major difficulty in using network information for the metabolite identification is the reaction promiscuity of enzymes and the sparseness of detected peaks from LC-MS data. We resort to Tanimoto similarity scores to partially alleviate this problem by reconstructing a biochemical network. A stringent similarity score cut-off of 0.9 was used in our study for the network reconstruction. Since this cut-off value will greatly affect the reconstructed network and in turn the probabilistic assignments of putative identifications, the determination of the most appropriate value will require further investigations. Also, further studies are needed to reformulate our proposed approach such that the analysis can be performed on the combined peak groups from positive and negative mode data.
For LC-MS/MS-based metabolomic analysis, the acquired MS/MS spectra enable improved prioritization for putative identifications. For example, M5 in Table 4 has six putative identifications. Among them, the prioritization for TCA and Tauro-b-muricholic acid is still ambiguous even after the isotopic pattern analysis and the pathway and network analysis. Through the prioritization using the spectral interpretation and the spectral matching, TCA is assigned the highest prioritization. As a result, the experimental verification of metabolites will start from TCA.
To verify the metabolite identifications presented in Table 4, we acquired the authentic compounds of GDCA, GCDCA, S-1-P, TCA and 3-Sulfo-GCDCA. The chromatograms and MS/MS spectra of protonated (or deprotonated) ions from the authentic compounds were compared against those from the experimental samples. Based on the MS/MS spectra of the authentic compounds, we observed that GDCA and GCDCA have highly similar fragmentation patterns (results are not presented). This explains the reason that the proposed pipeline could not prioritize the two putative identifications of M2. The two metabolites M1 and M2 were later verified as GCDCA and GDCA respectively, by comparing their retention times with those from authentic compounds. Also we verified that M3 is S-1-P, M4 is 3-sulfo-GCDCA, and M5 is TCA, by comparing their MS/MS spectra with those from the corresponding authentic compounds, as depicted in Figure 4. Similar verification experiments were also performed for the neutral-loss fragments and some of the isotopes by comparing their retention times with those of authentic compounds. The results (not shown in this manuscript) verified the accuracy of the ion annotation.
Figure 4.

MS/MS spectral comparison of experimental samples M3, M4, and M5, versus authentic compounds S-1-P, 3-sulfo-GCDCA, and TCA.
Generally, the power of the prioritization increases with each step of the pipeline. The isotopic pattern analysis can only differentiate metabolites of different elemental formulas. Spectral interpretation can discriminate the structural isomers to a certain extent if their structural differences result in different theoretical fragments. Spectral matching provides more confidence than spectral interpretation, because both spectra in comparison are experimentally acquired. On the other hand, some level of integration is possible as the steps complement each other. For example, in the identification of M5, TCA and Candoxatril could not be distinguished based on the spectral interpretation results, as there is only small difference over the number of the explained peaks. However, the isotopic pattern analysis and the pathway and network analysis suggest a strong preference for TCA. The high spectral matching score of TCA further enhance the conclusion that TCA should be given more preference over Candoxatril.
Similar identification pipeline has been included in some software tools. For example, Thermo’s Xcalibur provides spectral interpretation capability through Mass Frontier. However, major difference exist between the proposed pipeline and the existing software solutions including the following: (1) the existing software tools are proprietary while the proposed pipeline is constructed mainly using publicly available software or databases; (2) the proposed pipeline does not require proprietary data format because common data formats such as NetCDF, mzML, and mzXML are accepted.
The pipeline proposed in this paper is a conceptual workflow for computer-assisted metabolite identification, as suggested in [25]. It is demonstrated that such pipeline can be implemented with existing techniques and be practically useful. However, we believe that other alternative approaches exist in almost every step of the pipeline. For example, a previously reported algorithm performs ion annotation by using the peak intensity correlations across LC-MS runs in addition to correlations between EICs [26]. Other spectral libraries, such as Metlin [15], provide high resolution ESI-MS/MS spectra that are useful for spectral matching.
Future work will focus on the following topics: (1) integrating multiple pieces of software tools utilized by the pipeline into one unified framework; and (2) integrating the scores acquired in each step of the pipeline to obtain a single score which measures the overall prioritization of the putative identifications and the confidence of such prioritization.
Acknowledgments
This work was supported in part by NIH Grants R21 CA153176 and U54 CA149147.
Abbreviations
- m/z
mass-to-charge ratio
- MS/MS
tandem mass spectrometry
- 3-sulfo-GCDCA
glycochenodeoxycholic acid 3-sulfate
- 7-sulfo-GCDCA
glycochenodeoxycholic acid 7-sulfate
- CAMERA
Collection of Algorithms for Metabolite pRofile Annotation
- EIC
extracted ion chromatogram
- GDCA
glycodeoxycholic acid
- GCDCA
glycochenodeoxycholic acid
- HMDB
Human Metabolome DataBase
- InChI
International Chemical Identifier
- S-1-P
sphingosine-1-phosphate
- TCA
taurocholic acid
- UPLC
ultra performance liquid chromatography
- QTOF
quadrupole time-of-flight
- LC-MS
liquid chromatography-mass spectrometry
- GC-MS
gas chromatography-mass spectrometry
References
- 1.van der Greef J, Stroobant P, van der Heijden R. The role of analytical sciences in medical systems biology. Curr Opin Chem Biol. 2004;8:559–565. doi: 10.1016/j.cbpa.2004.08.013. [DOI] [PubMed] [Google Scholar]
- 2.Khoo SH, Al-Rubeai M. Metabolomics as a complementary tool in cell culture. Biotechnol Appl Biochem. 2007;47:71–84. doi: 10.1042/BA20060221. [DOI] [PubMed] [Google Scholar]
- 3.Goodacre R, Vaidyanathan S, Dunn WB, Harrigan GG, Kell DB. Metabolomics by numbers: acquiring and understanding global metabolite data. Trends Biotechnol. 2004;22:245–252. doi: 10.1016/j.tibtech.2004.03.007. [DOI] [PubMed] [Google Scholar]
- 4.Koek MM, Muilwijk B, van der Werf MJ, Hankemeier T. Microbial metabolomics with gas chromatography/mass spectrometry. Anal Chem. 2006;78:1272–1281. doi: 10.1021/ac051683+. [DOI] [PubMed] [Google Scholar]
- 5.Chen C, Gonzalez FJ, Idle JR. LC-MS-based metabolomics in drug metabolism. Drug Metab Rev. 2007;39:581–597. doi: 10.1080/03602530701497804. [DOI] [PMC free article] [PubMed] [Google Scholar]
- 6.Sumner L, Amberg A, Barrett D, Beale M, et al. Proposed minimum reporting standards for chemical analysis. Metabolomics. 2007;3:211–221. doi: 10.1007/s11306-007-0082-2. [DOI] [PMC free article] [PubMed] [Google Scholar]
- 7.Tautenhahn R, Böttcher C, Neumann S. In: Bioinformatics Research and Development. Hochreiter S, Wagner R, editors. Springer; Berlin/Heidelberg: 2007. pp. 371–380. [Google Scholar]
- 8.Wolf S, Schmidt S, Muller-Hannemann M, Neumann S. In silico fragmentation for computer assisted identification of metabolite mass spectra. BMC Bioinformatics. 2010;11:148. doi: 10.1186/1471-2105-11-148. [DOI] [PMC free article] [PubMed] [Google Scholar]
- 9.Cui Q, Lewis IA, Hegeman AD, Anderson ME, et al. Metabolite identification via the Madison Metabolomics Consortium Database. Nature Biotechnology. 2008;26:162–164. doi: 10.1038/nbt0208-162. [DOI] [PubMed] [Google Scholar]
- 10.Horai H, Arita M, Kanaya S, Nihei Y, et al. MassBank: a public repository for sharing mass spectral data for life sciences. Journal of Mass Spectrometry. 2010;45:703–714. doi: 10.1002/jms.1777. [DOI] [PubMed] [Google Scholar]
- 11.Zhou B, Xiao JF, Ressom HW. A Computational Pipeline for LC-MS/MS Based Metabolite Identification. Bioinformatics and Biomedicine (BIBM), 2011 IEEE International Conference on; 2011. pp. 247–251. [Google Scholar]
- 12.Kuhl C, Tautenhahn R, Böttcher C, Larson TR, Neumann S. CAMERA: An Integrated Strategy for Compound Spectra Extraction and Annotation of Liquid Chromatography/Mass Spectrometry Data Sets. Analytical Chemistry. 2011;84:283–289. doi: 10.1021/ac202450g. [DOI] [PMC free article] [PubMed] [Google Scholar]
- 13.Zhou B, Wang J, Ressom HW. MetaboSearch: Tool for Mass-Based Metabolite Identification Using Multiple Databases. PLoS ONE. 2012;7:e40096. doi: 10.1371/journal.pone.0040096. [DOI] [PMC free article] [PubMed] [Google Scholar]
- 14.Wishart DS, Knox C, Guo AC, Eisner R, et al. HMDB: a knowledgebase for the human metabolome. Nucleic Acids Research. 2009;37:D603–610. doi: 10.1093/nar/gkn810. [DOI] [PMC free article] [PubMed] [Google Scholar]
- 15.Smith CA, Maille GO, Want EJ, Qin C, et al. METLIN: A Metabolite Mass Spectral Database. Therapeutic Drug Monitoring. 2005;27:747–751. doi: 10.1097/01.ftd.0000179845.53213.39. [DOI] [PubMed] [Google Scholar]
- 16.Sud M, Fahy E, Cotter D, Brown A, et al. LMSD: LIPID MAPS structure database. Nucleic acids research. 2007;35:D527–D532. doi: 10.1093/nar/gkl838. [DOI] [PMC free article] [PubMed] [Google Scholar]
- 17.Pervukhin A. Doctoral Dissertation. Friedrich-Schiller-Universität; Jena: 2009. Molecular Formula Identification using High Resolution Mass Spectrometry: Algorithms and Applications in Metabolomics and Proteomics. [Google Scholar]
- 18.Rogers S, Scheltema RA, Girolami M, Breitling R. Probabilistic assignment of formulas to mass peaks in metabolomics experiments. Bioinformatics. 2009;25:512–518. doi: 10.1093/bioinformatics/btn642. [DOI] [PubMed] [Google Scholar]
- 19.Barupal DK, Haldiya PK, Wohlgemuth G, Kind T, et al. MetaMapp: mapping and visualizing metabolomic data by integrating information from biochemical pathways and chemical and mass spectral similarity. BMC Bioinformatics. 2012;13:99. doi: 10.1186/1471-2105-13-99. [DOI] [PMC free article] [PubMed] [Google Scholar]
- 20.Wishart DS, Knox C, Guo AC, Eisner R, et al. HMDB: a knowledgebase for the human metabolome. Nucl Acids Res. 2009;37:D603–610. doi: 10.1093/nar/gkn810. [DOI] [PMC free article] [PubMed] [Google Scholar]
- 21.Stein SE, Scott DR. Optimization and testing of mass spectral library search algorithms for compound identification. Journal of the American Society for Mass Spectrometry. 1994;5:859–866. doi: 10.1016/1044-0305(94)87009-8. [DOI] [PubMed] [Google Scholar]
- 22.Hisayuki H. Comparison of ESI-MS Spectra in MassBank Database. 1st International Conference on BioMedical Engineering and Informatics Sanya; Hainan, China. 2008. pp. 853–857. [Google Scholar]
- 23.Ressom HW, Xiao JF, Tuli L, Varghese RS, et al. Utilization of metabolomics to identify serum biomarkers for hepatocellular carcinoma in patients with liver cirrhosis. Analytica Chimica Acta. 2012;743:90–100. doi: 10.1016/j.aca.2012.07.013. [DOI] [PMC free article] [PubMed] [Google Scholar]
- 24.Smith CA, Want EJ, O’Maille G, Abagyan R, Siuzdak G. XCMS: Processing mass spectrometry data for metabolite profiling using Nonlinear peak alignment, matching, and identification. Analytical Chem. 2006;78:779– 787. doi: 10.1021/ac051437y. [DOI] [PubMed] [Google Scholar]
- 25.Xiao JF, Zhou B, Ressom HW. Metabolite identification and quantitation in LC-MS/MS-based metabolomics. TrAC Trends in Analytical Chemistry. 2012;32:1–14. doi: 10.1016/j.trac.2011.08.009. [DOI] [PMC free article] [PubMed] [Google Scholar]
- 26.Scheltema RA, Decuypere S, Dujardin JC, Watson DG, et al. Simple data-reduction method for high-resolution LCMS data in metabolomics. Bioanalysis. 2009;1:1551–1557. doi: 10.4155/bio.09.146. [DOI] [PubMed] [Google Scholar]